A Constraint-Based Pattern Mining View ... Data Mining and Mining (DM2L) Research Group ... Generic techniques to unders
Mining Dynamic and Augmented Graphs A Constraint-Based Pattern Mining View
Marc Plantevit MEET THE INDUSTRY DAY, UNIVERSITY-INDUSTRY WORKSHOP ON SYSTEMS BIOLOGY Data Mining and Mining (DM2L) Research Group LIRIS UMR5205
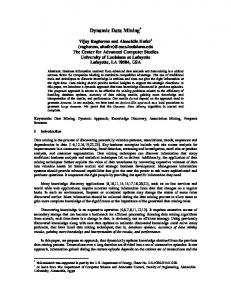
Data: a new “natural ressource”
M. Plantevit N
2 / 35
Potential increase of our knowledge
M. Plantevit N
3 / 35
Viewed as augmented graphs
Graphs are dynamic with attributes associated to vertices and/or edges. Generic techniques to understand the underlying mechanisms. M. Plantevit N
4 / 35
Mining augmented graphs Network data brings several questions: Working with network data is messy Not just “wiring diagrams” but also dynamics and data (features, attributes) on nodes and edges
Computational challenges Large scale network data
Algorithmic models as vocabulary for expressing complex scientific questions Social science, physics, biology, neuroscience
� Understanding how network structure and node attribute values relate and influence each other. A constraint-based pattern mining view
M. Plantevit N
5 / 35
Constraint-based pattern mining view A (local) pattern ϕ describes a subgroup of the data D observed several times or characterized by specific properties
M. Plantevit N
The pattern shape is fixed: ϕ∈L
� whose cardinality is exponential
in the size of the data or infinite
6 / 35
Constraint-based pattern mining view A (local) pattern ϕ describes a subgroup of the data D observed several times
The pattern shape is fixed: ϕ∈L
� whose cardinality is exponential
or characterized by specific properties
in the size of the data or infinite
The constraints C evaluates the adequacy of the pattern to the data C(ϕ, D) → Boolean
M. Plantevit N
To express the interest of the end-user Taking into account the domain knowledge objective interest, statistical assessment
6 / 35
Constraint-based pattern mining view A (local) pattern ϕ describes a subgroup of the data D observed several times
The pattern shape is fixed: ϕ∈L
� whose cardinality is exponential
or characterized by specific properties
in the size of the data or infinite
The constraints C evaluates the adequacy of the pattern to the data
To express the interest of the end-user
C(ϕ, D) → Boolean
Taking into account the domain knowledge objective interest, statistical assessment
Pattern mining task: Find all interesting subgroups Th(L, D, C) = {ϕ ∈ L | C(ϕ, D) is true } Th(L, D, C) is an inductive query.
M. Plantevit
N
6 / 35
Fully taking into account user preferences :-( A constraint ≡ some (too many) thresholds to set !!! A well-known issue in data mining that limits the full use of this paradigm
Let’s see the constraints as preferences !
� Computing only the patterns that maximize the user preferences � [Soulet et al., ICDM 2011] m2
0.6
⇒ Skyline Analysis
0.5 0.4
to compute only the (sky)patterns that are pareto-dominant w.r.t. to the user’s preferences.
0.3 0.2 0.1 0
0
0.1
0.2
0.3
0.4
m1
Case Study: Discovering Toxicophores Skypatterns are useful to discover toxicophores background knowledge can easily be integrated, adding aromaticity and density measures M. Plantevit N
7 / 35
Some inductive queries for augmented graphs What are the node attributes that strongly co-vary with the graph structure?
�
Co-authors that published at ICDE with a high degree and a low clustering coefficient. [Prado et al., IEEE TKDE 2013]
What are the sub-graphs whose node attributes evolve similarly?
�
Airports whose arrival delays increased over the three weeks following Katrina hurricane [Desmier et al., ECMLPKDD 2013]
For a given population, what is the most related subgraphs (i.e., behavior)? For a given subgraph, which is the most related subpopulation? People born after 1979 are over represented on the campus.
M. Plantevit N
8 / 35
Co-evolution patterns in dynamic attributed graphs
Talk Outline
1
Co-evolution patterns in dynamic attributed graphs
2
Extensions to hierarchies and skyline analysis
3
Conclusion
M. Plantevit N
9 / 35
Co-evolution patterns in dynamic attributed graphs
Dynamic Attributed Graphs A dynamic attributed graph G = (V, T , A) is a sequence over T of attributed graphs Gt = (V, Et , At ), where: V is a set of vertices that is fixed throughout the time, Et ∈ V × V is a set of edges at time t, At is a vector of numerical values for the attributes of A that depends on t.
Example a1 a1
a2
↑
↓
a3 →
↑
a2 →
a3 ↑
v1
a1
a2
a3
↓
↓
↓
v5 v2
↓
a2 →
a3
N
a3
↓
↓
v1
a1
a2
a3
↓
↓
↑
v2
a1
a2
a3
↑
↓
↓
v4 v3
↑ t1
M. Plantevit
a2
↓ v5
v4 a1
a1
a1 →
a2
a3
↑
↓
a1 →
a2
a3
↓
↑
v3 t2
a1
a2
a3
↑
↓
↓
10 / 35
Co-evolution patterns in dynamic attributed graphs
Co-evolution Pattern Given G = (V, T , A), a co-evolution pattern is a triplet P = (V , T , Ω) s.t.: V ⊆ V is a subset of the vertices of the graph. T ⊂ T is a subset of not necessarily consecutive timestamps. Ω is a set of signed attributes, i.e., Ω ⊆ A × S with A ⊆ A and S = {+, −} meaning respectively a {increasing , decreasing } trend.
M. Plantevit N
11 / 35
Co-evolution patterns in dynamic attributed graphs
Predicates A co-evolution pattern must satisfy two types of constraints: Constraint on the graph strucConstraint on the evolution: ture: Makes sure attribute values Makes sure vertices are related through the graph structure.
co-evolve We propose δ-strictEvol.
We propose diameter. � ∆-diameter V , T , Ω = true ⇔ ∀t ∈ T diamGt (V ) ≤ ∆
∀v ∈ V , ∀t ∈ T and ∀as ∈ Ω then δ-trend(v , t, a) = s
respects diameter () v1
v1
v5 v4
M. Plantevit N
v1
v5
v5
v2
v2
v2
v4
v4
v3
v3
v3
d =1
d =2
...
d =4
clique
...
...
connected component
12 / 35
Co-evolution patterns in dynamic attributed graphs
Example P = {(v1 , v2 , v3 )(t1 , t2 )(a2− , a3+ )} a1
a2
↑
↓
a3 →
a1
a2
a3
↑
↓
↑
v1
a1
a2
a3
↓
↓
↓
v5 a1
a2
a3
↓
↓
↑
↓
a3
a3
↓
↑
v1 v2
v4 a2 →
a2
↓ v5
v2 a1
a1
a1
a2
a3
↑
↓
↑
v4 v3 a1 →
↑ t1
a2
a3
↓
↑
a1 →
a2
a3
↓
↑
v3 t2
a1 →
a2
a3
↓
↑
1-Diameter(P) is true, 0-strictEvol(P) is true.
M. Plantevit N
13 / 35
Co-evolution patterns in dynamic attributed graphs
Density Measures Intuition Discard patterns that depict a behaviour supported by many other elements of the graph. We propose : vertex specificity, temporal dynamic and trend relevancy.
M. Plantevit N
14 / 35
Co-evolution patterns in dynamic attributed graphs
Algorithm How to use the properties of the constraints to reduce the search space? Binary enumeration of the search space. Using the properties of the constraints to reduce the search space Monotone, anti-monotone, piecewise (anti-)monotone, etc.
Constraints are fully or partially pushed: to prune the search space (i.e., stop the enumeration of a node), to propagate among the candidates.
�[Cerf et al, ACM TKDD 2009]
�
Our algorithms aim to be complete but other heuristic search can be used in a straightforward way (e.g., beam-search) to be more scalable M. Plantevit N
15 / 35
Top temporal dynamic trend dynamic sub-graph (in red) 71 airports whose arrival delays increase over 3 weeks. temporal dynamic = 0, which means that arrival delays never increased in these airports during another week. The hurricane strongly influenced the domestic flight organization. Katrina
|V | 280
|T | 8
|A| 8
density 5 × 10⁻²
M. Plantevit N
Top trend relevancy (Yellow) 5 airports whose number of departures and arrivals increased over the three weeks following Katrina hurricane. trend relevancy value equal to 0.81 Substitutions flights were provided from these airports during this period. This behavior is rather rare in the rest of the graph 16 / 35
Co-evolution patterns in dynamic attributed graphs
Brazil landslides Discovering lanslides Taking into account expert knowledge, focus on the patterns that involve NDVI+ . Regions involved in the patterns: true landslides (red) and other phenomena (white). Compare to previous work, much less patterns to characterize the same phenomena (4821 patterns vs millions).
Brazil landslide
|V | 10521
|T | 2
|A| 9
density 0.00057
M. Plantevit N
17 / 35
Co-evolution patterns in dynamic attributed graphs
Overview of our proposal Experimental results DBLP
a1
a2
a3
2
7
6
a1
a2
a3
2
5
3
v1
a1
a2
a3
3
6
9
v5 a1
a2
a3
6
7
1
v4 a1
a2
a3
8
8
2
a1
a2
a3
6
5
4
v1
a1
a2
a3
2
5
5
v5 v2 v3 t1
a1
a2
a3
2
3
9
a1
a2
a3
3
8
9
v4 a2
a3
3
5
1
a2
a3
2
2
2
Brazil landslides
v1 v5
v2 a1
a1
US flights
v3 t2
a1
a2
a3
2
6
6
v2
a1
v4 a1
a2
a3
3
4
7
a2
a3
4
6
5
v3 t3
a1
a2
a3
9
2
5
Co-evolution patterns
Some obvious patterns are discarded ... ... but some patterns need to be generalized
Interestingness Measures
(Desmier et al., ECML/PKDD 2013)
M. Plantevit N
18 / 35
Co-evolution patterns in dynamic attributed graphs
Overview of our proposal Experimental results DBLP
a1
a2
a3
2
7
6
a1
a2
a3
2
5
3
v1
a1
a2
a3
3
6
9
v5 a1
a2
a3
6
7
1
v4 a1
a2
a3
8
8
2
a1
a2
a3
6
5
4
v1
a1
a2
a3
2
5
5
v5 v2 v3 t1
a1
a2
a3
2
3
9
a1
a2
a3
3
8
9
v4 a2
a3
3
5
1
a2
a3
2
2
2
Brazil landslides
v1 v5
v2 a1
a1
US flights
v3 t2
a1
a2
a3
2
6
6
v2
a1
v4 a1
a2
a3
3
4
7
a2
a3
4
6
5
v3 t3
a1
a2
a3
9
2
5
Co-evolution patterns Interestingness Measures
Some obvious patterns are discarded ... ... but some patterns need to be generalized
Hierarchical co-evolution patterns Take benefits from a hierarchy over the vertex attributes to :
(Desmier et al., ECML/PKDD 2013)
M. Plantevit
return a more concise collection of patterns;
All a3
A a1
a2
discover new hidden patterns; N
18 / 35
Extensions to hierarchies and skyline analysis
Talk Outline
1
Co-evolution patterns in dynamic attributed graphs
2
Extensions to hierarchies and skyline analysis
3
Conclusion
M. Plantevit N
19 / 35
Extensions to hierarchies and skyline analysis
Hierarchy A hierarchy H on A is a tree where: the edges are a relation isa ,
All
the node All is the root of the tree,
a3
A
the leaves are attributes of A, a1
dom(H) is all the nodes except the root. a1 a1
a2
↑
↓
a3 →
↑
a2 →
a3 ↑
a1
a2
a3
↓
↓
↓
v1 v5 a1
a2
a3
↓
↓
↑
↓
a3
a2
a3
↓
↓
↓
v1 v2
v4 a2 →
a1
v5 v2
a1
a2
a1
a2
a3
↑
↓
↓
v4 v3
↑ t1
a1 →
a2
a3
↑
↓
a1 →
a2
a3
↓
↑
v3 t2
M. Plantevit N
a1
a2
a3
↑
↓
↓ 20 / 35
Extensions to hierarchies and skyline analysis
Hierarchical co-evolution Patterns Given G = (V, T , A) and H, a hierarchical co-evolution pattern is a triplet P = (V , T , Ω) s.t.: V ⊆ V is a subset of the vertices of the graph. T ⊂ T is a subset of not necessarily consecutive timestamps. Ω is a set of signed attributes, i.e., Ω ⊆ A × S with A ⊆ dom(H) and S = {+, −} meaning respectively a {increasing , decreasing } trend.
It must respect the following constraints: 1 2
Constraint on the evolution. Constraint on the graph structure.
M. Plantevit N
21 / 35
Extensions to hierarchies and skyline analysis
Evolution Constraint
For an attribute A, its evolution is computed from the evolution of the leaves it covers.
M. Plantevit N
22 / 35
Extensions to hierarchies and skyline analysis
Example
All
a1 A↓ A↓ a1
a2
↑
↓
a3 →
a2
a3
↑
↓
↑
a1 ↑
a2 →
a1
a2
a3
↓
↓
↓
A↓ a2
a3
↓
↓
↑
v3 t1
a1 →
a2
a3
↓
↑
a2
a3
↓
↓
↑
v1 A↓ v2
A↓ a1 →
A↓
↑
a1
v5
a1
v4 a3
A↓
v1 v5
A↑
a2
A↓
a1
v2
a3
A
P = {(v1 , v2 , v3 )(t1 , t2 )(A− , a3+ )}
a1
a2
a3
↑
↓
↑
v4
a2
a3
↓
↑
v3 A↓ t2
a1 →
a2
a3
↓
↑
1-Diameter(P) is true, 0-strictEvolHierarchical(P) is true. M. Plantevit N
23 / 35
Extensions to hierarchies and skyline analysis
Purity of the pattern Is the pattern described with the good level of granularity? Purity computes the proportion of valid triplet (v , t, as ) with regard to the number of possible triplets. All 10
B Value
b1
b2
b1 b2 b3 B
8
b3
6 4 2 0 1
2
3
4
5
Timestamp
P purity (P) =
v ∈V
P
t∈T
P
as ∈leaf (Ω) δas (v ,t)
|V | × |T | × |leaf (Ω)|
M. Plantevit N
24 / 35
Extensions to hierarchies and skyline analysis
Use of hierarchies does not impact other measures/constraints Maximality:
Size measures: |leaf (A)| ≥ minA ,
Vertex specificity:
Temporal dynamicity:
No trend relevancy with hierarchies. What level of hierarchy do we consider? M. Plantevit
What about attributes discarded because of a too small purity gain? N
25 / 35
Extensions to hierarchies and skyline analysis
Overview Experimental results DBLP
a1
a2
a3
2
7
6
a1
a2
a3
2
5
3
v1
a1
a2
a3
3
6
9
v5
a1
a2
a3
8
8
2
a1
a2
a3
6
5
4
v1
a1
a2
a3
2
5
5
v5 v2
a1
a2
a3
6
7
1
v4 v3 t1
a1
a2
a3
2
3
9
a2
a3
3
5
1
a2
a3
2
2
2
Brazil landslides
v1 v5
v2
a1
a2
a3
3
8
9
v4 a1
a1
US flights
v3 t2
a1
a2
a3
2
6
6
v2
a1
a1
a2
a3
3
4
7
a2
a3
4
6
5
v4 v3 t3
a1
a2
a3
9
2
5
Some obvious patterns are discarded ... ... but some patterns need to be generalized X
Co-evolution patterns
� [Desmier et al, IDA 2014]
Difficulties to set parameters. Interestingness Measures
(Desmier et al., ECML/PKDD 2013)
M. Plantevit N
26 / 35
Extensions to hierarchies and skyline analysis
Overview Experimental results DBLP
a1
a2
a3
2
7
6
a1
a2
a3
2
5
3
v1
a1
a2
a3
3
6
9
v5
a1
a2
a3
8
8
2
a1
a2
a3
6
5
4
v1
a1
a2
a3
2
5
5
v5 v2
a1
a2
a3
6
7
1
v4 v3 t1
a1
a2
a3
2
3
9
a2
a3
3
5
1
a2
a3
2
2
2
Brazil landslides
v1 v5
v2
a1
a2
a3
3
8
9
v4 a1
a1
US flights
v3 t2
a1
a2
a3
2
6
6
v2
a1
a1
a2
a3
3
4
7
a2
a3
4
6
5
v4 v3 t3
a1
a2
a3
9
2
5
Some obvious patterns are discarded ... ... but some patterns need to be generalized X
Co-evolution patterns
� [Desmier et al, IDA 2014]
Difficulties to set parameters. Interestingness Measures
⇒ Skyline Analysis m2 0.6 0.5 0.4 0.3
(Desmier et al., ECML/PKDD 2013)
0.2 0.1 0
0
0.1
0.2
0.3
M. Plantevit N
0.4
m1
26 / 35
Extensions to hierarchies and skyline analysis
Skyline analysis The skyline operator returns all the skypatterns:
m2 p1 0.6
sky (P, M) = {P ∈ P| 6 ∃Q ∈ P s.t. Q �M P}
0.5 p2
0.4
Q �M P iff: Q is better (i.e., more preferred) than P in at least one measure,
p4
p5
0.2
p6
0.1
p7 0
Q is not worse than P on every other measure.
p3
0.3
0
0.1
0.2
0.3
p8 0.4
m1
We propose to discover skypatterns considering a multidimensional space composed with a subset of the measures: sizeV, sizeT, sizeA volume purity
vertexSpecificity temporalDynamic
M. Plantevit N
27 / 35
Extensions to hierarchies and skyline analysis
US flights datasets: Katrina
Vertices: 280 airports. Times: 8 weeks around the Katrina hurricane. Attributes: number of departure/arrival/cancelled/deviated flights, departure/arrival delays and ground times. All
NbFlights
NbDep
NbArr
NbDisturb
NbCan
NbDiv
Delays
depDelay
Taxi
arrDelay
taxiIn
taxiOut
RITA “On-Time Performance” database. (http://www.transtats.bts.gov) M. Plantevit N
28 / 35
Extensions to hierarchies and skyline analysis
Hierarchy impact 2 experiments with and without a hierarchy, Thresholds: minV =40, minT =minA =ϑ=1, ψ=0.9, κ=0.2, τ =0.4. NbArr &
Delays %
92
NbDep &
50 88
92
83 NbArr & NbDep &
NbDep &
2,3,4
1,6,7
2,3,4
M. Plantevit N
29 / 35
Extensions to hierarchies and skyline analysis
Hierarchy impact 2 experiments with and without a hierarchy, Thresholds: minV =40, minT =minA =ϑ=1, ψ=0.9, κ=0.2, τ =0.4. NbFlights & NbArr &
Delays %
92
50 88
99 92
NbDep &
83 NbArr & NbDep &
NbDep &
2,3,4
1,6,7
2,3,4
M. Plantevit N
29 / 35
Extensions to hierarchies and skyline analysis
Hierarchy impact 2 experiments with and without a hierarchy, Thresholds: minV =40, minT =minA =ϑ=1, ψ=0.9, κ=0.2, τ =0.4. NbFlights & NbArr &
Delays %
NbDep &
92
50 88
99 92
83
Delays % NbArr & NbDep &
NbDep &
2,3,4
1,6,7
2,3,4
M. Plantevit N
29 / 35
Extensions to hierarchies and skyline analysis
Hierarchy impact 2 experiments with and without a hierarchy, Thresholds: minV =40, minT =minA =ϑ=1, ψ=0.9, κ=0.2, τ =0.4. NbFlights & NbArr &
Delays %
NbDep &
92
50 51
88
99 92
83
Delays % NbArr & NbDep &
NbDep &
2,3,4
NbFlights &
1,6,7
2,3,4
M. Plantevit N
29 / 35
Extensions to hierarchies and skyline analysis
Qualitative experiments: Using skyline analysis ϑ = minV = 5, minT = minA = 1, ψ=0.9 Skyline dimensions: VS, TD temporalDynamic P1 0.6 0.5 0.4 P2 P3
0.3
P4 P5
0.2 P6
0.1
P7 0
0
0.1
0.2
0.3
P8 0.4
vertexSpecificity
M. Plantevit N
30 / 35
Extensions to hierarchies and skyline analysis
Qualitative experiments: Using skyline analysis
P1
|V | 213
T 4
A nbFlights−
purity 0.96
VS 0
TD 0.61
TD P1 0.6 0.5 0.4 0.3 0.2 0.1 0
0
0.1
0.2
0.3
0.4
VS
� This behavior is not followed by another node (airport) at this timestamp. M. Plantevit N
31 / 35
Conclusion
Talk Outline
1
Co-evolution patterns in dynamic attributed graphs
2
Extensions to hierarchies and skyline analysis
3
Conclusion
M. Plantevit N
32 / 35
(dynamic) Augmented graphs: A powerful mathematical abstraction that makes possible to depict many phenomena We have to define a large variety of inductive queries:
�
to focus on the evolution (of the attributes, the graph structure), to take into account the intrinsic richness of the edges and the nodes. [Pitarch et al, ASONAM 2014]: triggering attributes.
Multi-level graphs
� find all dense
multi-level graphs
hypothesis elicitation (rare diseases), clustering
Contextualized trajectories
� Find subgraphs that are
specific to a subpopulation
recommendation, link prediction.
3D graphs
� Are there some 3D configurations specific to a class?
hypothesis elicitation (olfaction)
M. Plantevit N
33 / 35
Conclusion
Skyline analysis to support more interaction Skypattern mining is particularly well suited to interactive research: it proposes a reduced collection of patterns to the data expert which can quickly analyze it.
� Integration of the user feedbacks to make to foster iterative and interactive process.
refining the dominance relation; computing the cube of all possible measures; the skypattern cube exploration will provide a better understanding of the impact of the measures on the problem at hand; Removing some uninteresting skypatterns and recompute the local changes;
A challenging issue, especially with augmented graphs!
M. Plantevit N
34 / 35
Conclusion
Thank you for your attention.
M. Plantevit N
35 / 35