Computational Statistics & Data Analysis 50 (2006) 1113 – 1130 www.elsevier.com/locate/csda
Mining the customer credit using classification and regression tree and multivariate adaptive regression splines Tian-Shyug Leea,∗ , Chih-Chou Chiub , Yu-Chao Chouc , Chi-Jie Lud a Graduate Institute of Management, Fu-Jen Catholic University, Hsin-Chuang, Taipei, Taiwan b Institute of Commerce Automation and Management, National Taipei University of Technology, Taipei, Taiwan c Department of Business Administration, Fu-Jen Catholic University, Hsin-Chuang, Taipei, Taiwan d Department of Industrial Engineering and Management, Ching Yun University, Chungli, Taoyuan, Taiwan
Received 16 October 2002; received in revised form 10 August 2004; accepted 11 November 2004 Available online 7 December 2004
Abstract Credit scoring has become a very important task as the credit industry has been experiencing severe competition during the past few years. The artificial neural network is becoming a very popular alternative in credit scoring models due to its associated memory characteristic and generalization capability. However, the relative importance of potential input variables, long training process, and interpretative difficulties have often been criticized and hence limited its application in handling credit scoring problems. The objective of the proposed study is to explore the performance of credit scoring using two commonly discussed data mining techniques—classification and regression tree (CART) and multivariate adaptive regression splines (MARS). To demonstrate the effectiveness of credit scoring using CART and MARS, credit scoring tasks are performed on one bank credit card data set. As the results reveal, CART and MARS outperform traditional discriminant analysis, logistic regression, neural networks, and support vector machine (SVM) approaches in terms of credit scoring accuracy and hence provide efficient alternatives in implementing credit scoring tasks. © 2004 Elsevier B.V. All rights reserved. Keywords: Credit scoring; Data mining; Classification and regression tree; Multivariate adaptive regression splines; Support vector machine
∗ Corresponding author. Tel.: +886 2 2903 1111x2905; fax: +886 2 2901 8475.
E-mail address:
[email protected] (T.-S. Lee). 0167-9473/$ - see front matter © 2004 Elsevier B.V. All rights reserved. doi:10.1016/j.csda.2004.11.006
1114
T.-S. Lee et al. / Computational Statistics & Data Analysis 50 (2006) 1113 – 1130
1. Introduction Data mining (DM), sometimes referred to as knowledge discovery in database (KDD), is a systematic approach to find underlying patterns, trend, and relationships buried in data. Data mining has drawn serious attention from both researchers and practitioners due to its wide applications in crucial business decisions. Basically, the researches regarding DM can be classified into two categories: methodologies and technologies. According to Curt (1995), the methodologies consist of data visualization, machine learning, statistical techniques, and deductive database. The related applications using these methodologies can be summarized as classification, prediction, clustering, summarization, dependency modeling, linkage analysis, and sequential analysis (Fayyad et al., 1996). The technology part of DM consists of techniques such as statistical methods, neural networks, decision trees, genetic algorithms, and non-parametric methods. Among the above-mentioned applications, the classification problems where observations can be assigned to one of several disjoint groups have long played important roles in business decision making due to their wide applications in decision support, financial forecasting, fraud detection, marketing strategy, process control, and other related fields (Cabena et al., 1997; Chen et al., 1996; Fayyad et al., 1996). Credit risk evaluation decisions are crucial for financial institutions due to high risks associated with inappropriate credit decisions. It is an even more important task today as financial institutions have been experiencing serious competition during the past few years. Credit scoring has gained more and more attention as the credit industry can benefit from improving cash flow, insuring credit collections and reducing possible risks. Hence, many different useful techniques, known as the credit scoring models, have been developed by the banks and researchers in order to solve the problems involved during the evaluation process. The objective of credit scoring models is to assign credit applicants to either a “good credit” group that is likely to repay financial obligation or a “bad credit” group who has high possibility of defaulting on the financial obligation. Therefore, credit scoring problems are basically in the scope of the more general and widely discussed classification problems (Johnson and Wichern, 2002). In the first beginning, financial institutions usually adopted rules or principles built by analysts to decide whom to give credit. However, it is impossible both in economic and manpower terms to conduct all works with the explosive size growths. Therefore, it is in dire need to automate the credit evaluation process. Usually, credit scoring is applied to rank credit information and to target collection activities including the application form details and the information held by a credit reference agency on the applicant. As a result, accounts with high probability of default can be monitored and necessary action can be taken in order to prevent the account from being default. In response, the statistical methods, non-parametric statistical methods, and artificial intelligence approaches have been proposed to support the credit approval decision process (Desai et al., 1996; Thomas, 2000; West, 2000). Generally, discriminant analysis and logistic regression are two most commonly used data mining techniques to construct credit scoring models. However, linear discriminant analysis (LDA) has often been criticized because of its assumption about the categorical nature of the data and the fact that the covariance matrices of different classes are unlikely to be equal
T.-S. Lee et al. / Computational Statistics & Data Analysis 50 (2006) 1113 – 1130
1115
(Reichert et al., 1983). In addition to the LDA approach, logistic regression is an alternative to conduct credit scoring. Basically, the logistic regression model emerged as the technique in predicting dichotomous outcomes. A number of logistic regression models for credit scoring applications have been reported in the literature. Harrell and Lee (1985) found out that logistic regression is as efficient as LDA. However, it is also being criticized for some strong model assumptions like variation homogeneity which has limited its application in handling credit scoring problems. In addition to LDA and logistic regression, credit scoring also lends itself to a recent development of neural networks approach. Neural networks provide an alternative to LDA and logistic regression, particularly in situations where the dependent and independent variables exhibit complex nonlinear relationships. Even though neural networks have been reported to have better credit scoring capability than LDA and logistic regression (Desai et al., 1996; Jensen, 1992; Piramuthu, 1999; West, 2000), they are, however, also being criticized for their long training process in designing the optimal network’s topology and inability to identify the relative importance of potential input variables, as a result of which they have limited its applicability in handling credit scoring problems (Piramuthu, 1999). Owing to the above-mentioned drawbacks of LDA, logistic regression, and neural networks, the purpose of this study is to explore the performance of credit scoring using two commonly discussed data mining techniques, classification and regression tree (CART) and multivariate adaptive regression splines (MARS). The rationale to use CART and MARS in credit scoring is fourfold. Firstly, unlike LDA and logistic regression, both CART and MARS approaches exhibit the capability of modeling complex relationship between variables without strong model assumptions. Besides, unlike neural networks, they both are able to identify “important” independent variables through the built tree and basis functions (more details will be described in Section 3) when many potential variables are considered. Thirdly, CART and MARS do not need a long training process and hence can save lots of modeling time when the data set is huge. Finally, one strong advantage of CART and MARS over other classification techniques is that the resulting classification model can be easily interpreted. It not only points out which variables are important in classifying objects/observations, but also indicates that a particular object/observation belongs to a specific class when the built rules are satisfied. The final fact has important marketing implications and can help marketing professionals make better managerial decisions. Since CART and MARS have the described advantages, they have proven to be effective tools in handling forecasting and classification problems (Chai et al., 1996; De Gooijer et al., 1998; Friedman and Roosen, 1995; Griffin et al., 1997; Kuhnert et al., 2000; Lewis and Stevens, 1991; Nguyen-Cong et al., 1996; Ohmann et al., 1996). To demonstrate the effectiveness of credit scoring using CART and MARS, credit scoring tasks are performed on one bank credit card data set. Analytic results demonstrated that CART and MARS outperform traditional discriminant analysis, logistic regression, neural networks, and support vector machine (SVM) approaches in terms of credit scoring accuracy and misclassification costs and hence provide efficient alternatives to conduct credit scoring tasks. The rest of the paper is organized as follows. We will briefly review the literature of credit scoring in Section 2. Section 3 gives a brief outline of CART and MARS. The developments as well as the analytic results of credit scoring models using discriminant analysis, logistic
1116
T.-S. Lee et al. / Computational Statistics & Data Analysis 50 (2006) 1113 – 1130
regression, neural networks, SVM, CART, and MARS are presented in Section 4. Finally, Section 5 addresses the conclusion and discusses the possible future research areas.
2. Literature review We will review the literature of credit scoring and the commonly used techniques in modeling credit scoring problems in this section. 2.1. Discriminant analysis Discriminant analysis was first proposed by Fisher (1936) as a classification technique. Up to date, it has been reported as the most commonly utilized data mining technique in handling classification problems (Lee et al., 1999). As a matter of fact, discriminant analysis has been widely devoted to a considerably wide range of application areas, such as medicine, business, education, marketing research, finance, chemistry, biology, engineering, and archaeology (Altman, 1968; Deakin, 1972; Lee et al., 1997; Kim et al., 2000; Trevino and Daniels, 1995). In addition, applying discriminant analysis in building credit scoring models has been proposed by Bardos (1998), Desai et al. (1996), Martell and Fitts (1981), Overstreet et al. (1992), Reichert et al. (1983), and Titterington (1992). 2.2. Logistic regression Logistic regression is a widely used statistical modeling technique in which the probability of a dichotomous outcome is related to a set of potential independent variables (Cox and Snell, 1989; Hosmer and Lemeshow, 1989). The logistic regression model does not necessarily require the assumptions of discriminant analysis. However, Harrell and Lee (1985) found that logistic regression is as efficient and accurate as discriminant analysis even though the assumptions of discriminant analysis are satisfied. Logistic regression models have been widely discussed in social research, medical research, design, control, bankruptcy prediction, market segmentation, and customer behaviors (Flagg et al., 1991; Kay et al., 2000; Laitinen and Laitinen, 2000; Suh et al., 1999). Logistic regression has also been explored by Joanes (1993), Laitinen (1999), Westgaard and van der Wijst (2001), and Wiginton (1980) in building credit scoring models. 2.3. Artificial neural networks Neural networks are increasingly found to be useful in modeling non-stationary processes due to their associated memory characteristics and generalization capabilities (Anderson and Rosenfeld, 1988; Cheng and Titterington, 1994; Haykin, 1994; Repley, 1994; Stern, 1996). Hence, neural networks have been widely used in engineering, science, education, social research, medical research, business, finance, forecasting, and related fields (Lee and Chiu, 2002; Lee and Chen, 2002; Repley, 1994; Stern, 1996; Vellido et al., 1999; Zhang et al., 1998). Neural networks have also been explored by Arminger et al. (1997), Barney et al. (1999), Deng (1993), Desai et al. (1996), Glorfeld (1996), Glorfeld and Hardgrave
T.-S. Lee et al. / Computational Statistics & Data Analysis 50 (2006) 1113 – 1130
1117
(1996), Jagielska and Jaworski (1996), Jensen (1992), Lee et al. (2002), Piramuthu (1999), Piramuthu et al. (1994), Richeson et al. (1994), Torsun (1996), and West (2000) in handling credit scoring problems. The majority of the above references have reported that the credit scoring accuracies of neural networks are better than those using discriminant analysis and logistic regression techniques.
3. Research methodology 3.1. Classification and regression tree Classification and regression tree (CART), a statistical procedure introduced by Breiman et al. (1984), is primarily used as a classification tool, where the objective is to classify an object into two or more populations. As the name suggests, CART is a single procedure that can be used to analyze either categorical or continuous data using the same technology. The methodology outlined in Breiman et al. (1984) can be summarized into three stages. The first stage involves growing the tree using a recursive partitioning technique to select variables and split points using a splitting criterion. Several criteria are available for determining the splits, including gini, twoing and ordered twoing. For a more detailed description of the mentioned criteria one can refer to Breiman et al. (1984). In addition to selecting the primary variables, surrogate variables, which are closely related to the original splits and may be used in classifying observations having missing values for the primary variables, can also be identified and selected. After a large tree is identified, the second stage of the CART methodology uses a pruning procedure that incorporates a minimal cost complexity measure. The result of the pruning procedure is a nested subset of trees starting from the largest tree grown and continuing the process until only one node of the tree remains. Cross-validation or a testing sample will be used to provide estimates of future classification errors for each subtree. Cross-validation is used when only small numbers of data points are available in building the CART models. The last stage of the methodology is to select the optimal tree, which corresponds to a tree yielding the lowest cross-validated or testing set error rate. Trees in this stage have been identified as unstable. To avoid this instability, trees with smaller sizes, but comparable in accuracy (i.e. within one standard error), will be chosen as an alternative. This process is referred to as the one standard error rule and can be tuned to obtain trees of varying sizes and complexity. A measure of variable importance can be achieved by observing the drop in the error rate when another variable is used instead of the primary split. Basically the more frequent a variable appears as a primary or surrogate split, the higher the importance score assigned. Please refer to Breiman et al. (1984) and Steinburg and Colla (1997) for more details regarding the model building process of CART. 3.2. Multivariate adaptive regression splines Multivariate adaptive regression splines (MARS) was first proposed by Friedman (1991) as a flexible procedure, which models relationships that are nearly additive or involve interactions with fewer variables. The modeling procedure is inspired by the recursive
1118
T.-S. Lee et al. / Computational Statistics & Data Analysis 50 (2006) 1113 – 1130
partitioning technique governing CART and generalized additive modeling (Hastie and Tibshirani, 1990), resulting in a model that is continuous with continuous derivatives. It excels at finding optimal variable transformations and interactions, the complex data structure that often hides in high-dimensional data, and hence can effectively uncover important data patterns and relationships that are difficult, if not impossible, for other methods to reveal. MARS essentially builds flexible models by fitting piecewise linear regressions; that is, the nonlinearity of a model is approximated through the use of separate regression slopes in distinct intervals of the independent variable space. Therefore, the slope of the regression line is allowed to change from one interval to the other as the two “knot” points are crossed. The variables to use and the end points of the intervals for each variable are found via a fast but intensive search procedure. In addition to searching variables one by one, MARS also searches for interactions between variables, allowing any degree of interaction to be considered. The optimal MARS model is selected in a two-stage process. Firstly, MARS constructs a very large number of basis functions (BF), which are selected to overfit the data initially, where variables are allowed to enter as continuous, categorical, or ordinal, the formal mechanism by which variable intervals are defined, and they can interact with each other or be restricted to enter in only as additive components. In the second stage, basis functions are deleted in the order of least contribution using the generalized cross-validation (GCV) criterion. A measure of variable importance can be assessed by observing the decrease in the calculated GCV when a variable is removed from the model. Missing values can also be handled in MARS by using dummy variables indicating the presence of the missing values. By allowing for any arbitrary shape for the function and interactions, and by using the above-mentioned two-stage model building procedure, MARS is capable of reliably tracking the very complex data structures that often hide in high-dimensional data. Please refer to Friedman (1991) for more details regarding the model building process.
4. Empirical study In order to verify the feasibility and effectiveness of credit scoring using CART and MARS, one credit card data set provided by a local bank in Taipei, Taiwan, is used in this study. There are totally 8000 customers in the data set. Among them, 4000 data sets with respect to the ratio of good and bad credit (the prior probabilities or simply priors) were randomly selected as the training sample (estimating the parameters of the corresponding built scoring model), another 2000 will be used to test the model (selecting the final scoring model), and the remaining 2000 will be retained for validation (evaluating the classification capability of the built scoring model). Each bank customer in the data set contains 9 independent variables, namely, gender, age, marriage status, educational level, occupation, job position, annual income, residential status and credit limits. The dependent variable is the credit status of the customer—good or bad credit. As the main purpose of this article is not to try show that CART and MARS are better than the other competing tools under all circumstances and simulation study may provide a simplified picture of the reality, we will solely focus on testing the appropriateness of the built credit scoring models using the above-mentioned data set.
T.-S. Lee et al. / Computational Statistics & Data Analysis 50 (2006) 1113 – 1130
1119
Table 1 Credit scoring results using discriminant analysis Actual class
1 (Good Credit) 2 (Bad Credit)
Classified class 1 (Good Credit)
2 (Bad Credit)
697 (69.91%) 326 (32.31%)
300 (30.09%) 683 (67.69%)
Average correct classification rate: 69.00%.
The neural network simulator Qnet97, developed by Vesta Services Inc. (1998), was utilized to develop the neural networks credit scoring models. The discriminant analysis and logistic regression credit scoring models will be implemented using the popular SPSS software (SPSS, 1998). CART 4.0 (2001) and MARS 2.0 (2001) provided by Salford Systems are used, respectively, in building the CART and MARS credit scoring models. All the modeling tasks are implemented on an IBM PC with Intel Pentium III 733 MHz CPU processor. The detailed credit scoring results using the above-mentioned five modeling techniques can be summarized as follows. 4.1. Discriminant analysis The stepwise discriminant approach (Johnson and Wichern, 2002) in selecting the independent variables is used in building the discriminant analysis credit scoring model.1 Six significant independent variables were included in the final discriminant function, namely gender, age, occupation, annual income, residential status, and credit limits. The credit scoring results (the confusion matrix) of the validation sample using the obtained discriminant function are summarized in Table 1. From the results revealed in Table 1, we can observe that the average correct classification rate is 69.00% with 300 (326) class 1 (2) customers misclassified as class 2 (1) customers (here a class 1 customer is defined as a customer with good credit while a class 2 customer is a customer whose credit is bad). 4.2. Logistics regression The stepwise variables selection procedure (Neter et al., 1996) is used in building the logistic regression credit scoring model. Four significant independent variables, gender, age, annual income, and credit limits were included in the final regression model with the credit scoring results of the validation sample summarized in the following table. From the results in Table 2, it is observed that the average correct classification rate is 70.90% with 234 (340) class 1 (2) customers misclassified as class 2 (1) customers. 1 If the covariance matrices of the given populations are not equal, the quadratic discriminant analysis (QDA) should be applied because the separation surface is a quadratic function. Despite the fact that LDA is a special case of QDA with stronger assumptions, which should restrict its applications, LDA is reported to be a more robust method when the theoretical presumptions are violated (Sanchez and Sarabia, 1995; Sharma, 1996). Hence, the LDA approach will be used in building the credit scoring model in this paper.
1120
T.-S. Lee et al. / Computational Statistics & Data Analysis 50 (2006) 1113 – 1130
Table 2 Credit scoring results using logistic regression Actual class
1 (Good Credit) 2 (Bad Credit)
Classified class 1 (Good Credit)
2 (Bad Credit)
757 (76.38%) 340 (33.97%)
234 (23.62%) 661 (66.03%)
Average correct classification rate: 70.90%.
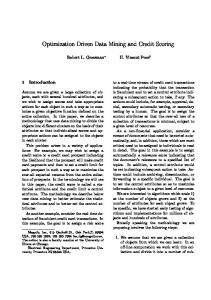
4.3. Neural networks model Since Vellido et al. (1999) indicated that more than 75% of business applications using neural networks will use the BPN algorithm, this study will also use BPN in building the classification model. As recommended by Cybenko (1989) and Hornik et al. (1989), that one-hidden-layer network is sufficient to model any complex system, the designed network model will have only one hidden layer. As to the issue of determining the optimal number of hidden nodes it is a crucial yet complicated one. The most commonly used way in determining the number of hidden nodes is via experiments or trial-and-error (Lippmann, 1987; Hecht-Nielsen, 1990; Wong, 1991; Tang and Fishwick, 1993). Since there are 9 input nodes in the input layer, the initial number of hidden nodes to be tested was chosen to be 17, 18, 19, 20, and 21 (other possible number of hidden nodes have also been tested and no better results can be obtained). The network has only one output node, the credit status of the customer. As Rumelhart et al. (1986) concluded that lower learning rates tend to give better results and the networks were unable to converge when the learning rate was greater than 0.012, learning rates 0.003, 0.005, 0.008, 0.010, and 0.012 are tested during the training process. The convergence criteria used for training are a root-meansquared error (RMSE) less than or equal to 0.0001 or a maximum of 3000 iterations. The network topology with the minimum testing RMSE is considered as the optimal network topology. The prediction results of the neural networks with different combinations of hidden nodes and learning rates are computed and summarized in Table 3. From Table 3, the {9-20-1} topology with a learning rate of 0.005 gives the best prediction result (minimum testing RMSE). Here 9-20-1 stands for the nine, twenty, and one neuron in the input layer, hidden layer, and output layer, respectively. To examine the convergence characteristics of the proposed neural networks model, the RMSE history during the training process for the {9-20-1} network with the learning rate of 0.005 is depicted in Fig. 1. From the results revealed in Fig. 1, the fine convergence characteristic of the proposed BPN model can be observed. The classification results of the validation sample using the designed {9-20-1} BPN model are summarized in Table 4. From the results in Table 4, we can observe that the average correct classification rate is 73.85% with 103 (420) class 1 (2) customers misclassified as class 2 (1) customers. By comparing the crediting scoring results of Tables 1, 2, and 4, it is not surprising to see that BPN has the highest credit scoring accuracy. This fact is consistent with the research findings in the majority of the literature saying that neural networks, in general, provide better
T.-S. Lee et al. / Computational Statistics & Data Analysis 50 (2006) 1113 – 1130
1121
Table 3 BPN model prediction results Number of nodes in the hidden layer
Learning rate
Training RMSE
Testing RMSE
17
0.003 0.005 0.008 0.010 0.012 0.003 0.005 0.008 0.010 0.012 0.003 0.005 0.008 0.010 0.012 0.003 0.005 0.008 0.010 0.012 0.003 0.005 0.008 0.010 0.012
0.297375 0.293887 0.306443 0.297188 0.310065 0.295469 0.293400 0.306443 0.314186 0.300312 0.293925 0.293886 0.333965 0.295710 0.314571 0.297395 0.293283 0.314186 0.314186 0.302951 0.296231 0.292981 0.306443 0.306443 0.306443
0.301549 0.297902 0.312902 0.299258 0.318076 0.298673 0.296700 0.312902 0.307741 0.302081 0.296828 0.296732 0.336793 0.300918 0.322677 0.299639 0.296290 0.307741 0.307741 0.303870 0.298675 0.296648 0.312902 0.312902 0.312902
18
19
20
21
Fig. 1. The RMSE history in the training process for the proposed network.
1122
T.-S. Lee et al. / Computational Statistics & Data Analysis 50 (2006) 1113 – 1130
Table 4 Credit scoring results using {9-20-1} BPN Actual class
Classified class
1 (Good Credit) 2 (Bad Credit)
1 (Good Credit)
2 (Bad Credit)
876 (89.48%) 420 (39.96%)
103 (10.52%) 601 (60.04%)
Average correct classification rate: 73.85%.
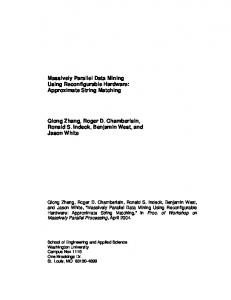
Fig. 2. The tree of CART credit scoring models.
credit scoring results due to their strong capabilities in capturing complex and nonlinear relationship among variables. 4.4. Classification and regression tree model Fig. 2 depicts the obtained CART tree of the testing sample with the popular 1-SE rule in the tree pruning procedure. It is observed from Fig. 2 that occupation and credit limits play important roles in the rule induction. It can also be observed from Fig. 2 that if an observation whose credit limit is between 27,500 and 62,500 and occupation is among one of the seven (0, 7, 10, 11, 12, 13 or 14) categories, it falls into terminal node 3 whose classified class is class 1 (good customer). Table 5 summarizes the rules and the classified results from the built tree. The built rules and terminal nodes, unlike other classification
T.-S. Lee et al. / Computational Statistics & Data Analysis 50 (2006) 1113 – 1130
1123
Table 5 CART analytic rules Terminal node
Rule
1
If
2
If
3
4
5
6
Class Credit limit< = 22500
2
(Occupation =0 or 7 or 10 or 11 or 12 or 13 or 14) & Credit limit > 22500 & Credit limit < = 27500
2
(Occupation = 0 or 7 or 10 or 11 or 12 or 13 or 14) & Credit limit > 27500 & Credit limit < = 62500
1
(Occupation = 1 or 2 or 3 or 4 or 5 or 6 or 8 or 9 or 15) & Credit limit > 22500 & Credit limit < = 47500
1
(Occupation = 1 or 2 or 3 or 4 or 5 or 6 or 8 or 9 or 15) & Credit limit > 47500 & Credit limit < = 62500
2
If
If
If
If
Credit limit > 62500
1
Table 6 Credit scoring results using CART Actual class
1 (Good Credit) 2 (Bad Credit)
Classified class 1 (Good Credit)
2 (Bad Credit)
870 (87.79%) 320 (31.71%)
121 (12.21%) 689 (68.29%)
Average correct classification rate: 77.95%.
techniques, are very easy to interpret and hence marketing professionals can use the built rules in designing proper managerial decisions. The credit scoring results of the validation sample using the obtained CART model an summarized in Table 6. From the results in Table 6, it is observed that the average correct classification rate is 77.95% with 121 (320) class 1 (2) customers misclassified as class 2 (1) customers.
1124
T.-S. Lee et al. / Computational Statistics & Data Analysis 50 (2006) 1113 – 1130
Table 7 Variable selection results using MARS Function
Std. dev.
−gcv
No. bf
Variable
1 2 3
0.302 0.030 0.024
0.251 0.163 0.163
6 2 1
LIMIT OCCUPY HOUSE
Table 8 Credit scoring results using MARS Actual class
1 (Good Credit) 2 (Bad Credit)
Classified class 1 (Good Credit)
2 (Bad Credit)
855 (86.28%) 309 (30.62%)
136 (13.72%) 700 (69.38%)
Average correct classification rate: 77.75%.
4.5. Multivariate adaptive regression splines model The variable selection results using MARS credit scoring model an summarized in Table 7. It is observed that credit limits, occupation, and residential status do play important roles in deciding the MARS credit scoring models. The credit scoring results of the validation sample using the obtained MARS model are summarized in Table 8. From the results in Table 8, we can observe that the average correct classification rate is 77.75% with 136 (309) class 1 (2) customers misclassified as class 2 (1) customers.
4.6. Results between different scoring models In order to evaluate the classification capabilities of the five built credit scoring models, the credit scoring results of the testing and the validation samples are summarized in Table 9. From Table 9, we can conclude that, in both the testing and validation sample, CART and MARS scoring models have better classification capability in terms of the average correct classification rate. Consequently, based on the results from this data set, we can conclude that the credit scoring results of both CART and MARS outperform the commonly utilized linear discriminant analysis, logistic regression, and neural networks credit scoring models and hence provide efficient alternatives in conducting credit scoring tasks. Besides, as the classification accuracy of the validation samples is only slightly lower than those of the corresponding testing samples, it means that the built scoring models successfully unveil the hidden information buried in the data and hence can be successfully applied in the validation sample after the model building procedure.
T.-S. Lee et al. / Computational Statistics & Data Analysis 50 (2006) 1113 – 1130
1125
Table 9 Credit scoring results of the five constructed models Testing sample
Discriminant analysis Logistic regression BPN model CART MARS
Validation sample
{1-1}
{2-2}
Average correct classification rate
{1-1}
{2-2}
Average correct classification rate
71.64% 76.19% 82.04% 89.61% 87.29%
67.49% 67.79% 67.10% 68.88 % 70.34%
69.05% 71.95% 74.50% 79.15% 78.75%
69.91% 76.38% 89.48% 87.79% 86.28%
67.69% 66.03% 60.04% 68.29% 69.38%
69.00% 70.90% 73.85% 77.95% 77.75%
Table 10 Type I and Type II errors of the five models Testing sample
Discriminant analysis Logistic regression BPN model CART MARS
Validation sample
Type I error
Type II error
Type I error
Type II error
28.36% 23.81% 17.96% 10.39% 12.71%
32.51% 32.21% 32.90% 31.12% 29.66%
30.09% 23.62% 10.52% 12.21% 13.72%
32.31% 33.97% 39.96% 31.71% 30.62%
4.7. Type I and Type II errors of the constructed models It is well known that, in order to justify the overall credit scoring capability of the designed credit scoring models, the prior probability of good and bad credit customers, the misclassification probability, and misclassification costs have to be taken into account in order to obtain a model with the smallest expected misclassification costs (Johnson and Wichern, 2002). Hence, special attention also needs to be paid to misclassification cost in order to evaluate the credit scoring accuracy of the five built models. It is apparent that the costs associated with Type I errors (a customer having good credit is misclassified as having bad credit) and Type II errors (a customer with bad credit is misclassified as having good credit) are significantly different. In general, the misclassification costs associated with Type II errors are much higher than those associated with Type I errors (West, 2000). The difference can range from 5 to 1 up to 20 to 1. Therefore, Type II errors of the five models need to be compared in order to justify the overall credit scoring capability. Table 10 summarizes the Type I and Type II errors of the five built models. According to the results from Table 10, CART and MARS have lower Type II errors in comparison with the other three approaches. Hence, we can conclude that CART and MARS not only have higher classification accuracy, but also lower Type II errors and hence can reduce the possible high risks associated with Type II errors.
1126
T.-S. Lee et al. / Computational Statistics & Data Analysis 50 (2006) 1113 – 1130
4.8. The support vector machine credit scoring model In order to further verify the effectiveness of the proposed CART and MARS credit scoring models, the same credit scoring task is also performed using the SVM approach in this study. The SVM is a new and promising technique for data classification tasks. It has recently been successfully applied to machine learning and pattern recognition such as face detection (Osuna et al., 1997), text categorization (Joachims, 1998; Dumais et al., 1998), and texture classification (Kim et al., 2002) problems. The SVM approach is systematic and motivated by statistical learning theory with the foundation mainly developed by Vapnik and his collaborators (Vapnik, 1995, 1998). An SVM credit scoring model with RBF and polynomial kernel using the MATLAB Support Vector Machine Toolbox provided by Steve Gunn at University of South Southampton (see website of www.isis.ecs.soton.ac.uk/resources/svminfo/ for more details) has been built and no better results can be obtained (the obtained correct classification rate is similar to that of the neural networks approach). Besides, the running time in implementing the credit scoring task is a major drawback of SVM. It takes us more than 20 hours (the task is performed on an IBM PC with Pentium IV 2.4 G CPU with more than 1 GB of RAM) to run the program with a sample size of only 8000. On the other hand, the running time of CART and MARS only takes about 5–10 min. Owing to the abovementioned facts about classification accuracy and running time, we believe that CART and MARS are better alternatives in handling this credit scoring problem.
5. Conclusions and areas of future research Credit scoring has become more and more important as the competition between financial institutions has come to a totally conflicting stage. More and more companies are seeking better strategies through the help of credit scoring models and hence credit scoring techniques have been widely used in different credit evaluation processes. Therefore, credit scoring problems are one of the applications that have gained serious attention over the past decades. Modeling techniques like traditional statistical analyses and artificial intelligence techniques have been developed in order to successfully attack the credit scoring tasks. Discriminant analysis and logistic regression are the most commonly used statistical credit scoring techniques, but an often criticized due to their strong model assumptions. On the other hand, the artificial neural networks approach is becoming a very popular alternative in credit scoring tasks due to its associated memory characteristic, generalization capability, and outstanding credit scoring capability. However, it is also being criticized for its long training process, inability to identify the relative importance of potential input variables, and certain interpretative difficulties. The purpose of this study is to explore the performance of credit scoring using two commonly discussed data mining techniques, classification and regression tree (CART) and multivariate adaptive regression splines (MARS), due to the fact that CART and MARS can successfully solve credit scoring problems without those drawbacks when using discriminant analysis, logistic regression, and neural networks. In order to evaluate the feasibility and effectiveness of using CART and MARS in building credit scoring models, credit scoring task is performed on one bank credit card data set. Analytic results demonstrate that CART and MARS both have better average correct classi-
T.-S. Lee et al. / Computational Statistics & Data Analysis 50 (2006) 1113 – 1130
1127
fication rate in comparison with discriminant analysis, logistic regression, neural networks, and support vector machine (SVM). Besides, CART and MARS not only have better credit scoring accuracies, but also lower Type II errors associated with high misclassification costs and therefore have better overall credit scoring capabilities. The research findings provide efficient alternatives in conducting credit scoring tasks. As our studies mainly use demographic variables as independent variables, future studies may aim at collecting more important variables, e.g. consumer variables, in improving the credit scoring accuracies. Integrating fuzzy discriminant analysis, genetic algorithms and/or grey theory, with neural networks and/or support vector machines are possible research directions in further improving the credit scoring accuracies. Other related topics about data mining like market basket analysis, customer acquisition, customer retention, customer profit analysis, and cross sells/up sells models may also be investigated in future studies. Acknowledgements The authors would like to thank the editor, the associate editor, and two anonymous referees for their valuable comments that greatly improved the quality of the paper. This research was partially supported by the National Science Council of the Republic of China under Grant Number NSC 89-2213-E-030-016. Special thanks to the anonymous bank for providing the credit card data that made this research possible. References Altman, E.I., 1968. Financial ratios, discriminant analysis and prediction of corporate bankruptcy. J. Finance 23, 589–609. Anderson, J.A., Rosenfeld, E., 1988. Neurocomputing: Foundations of Research, MIT Press, Cambridge, MA. Arminger, G., Enache, D., Bonne, T., 1997. Analyzing credit risk data: a comparison of logistic discriminant classification tree analysis and feedforward networks. Comput. Statist. 12, 293–310. Bardos, M., 1998. Detecting the risk of company failure at the banque de france. J. Banking Finance 22, 1405–1419. Barney, D.K., Graves, O.F., Johnson, J.D., 1999. The farmers home administration and farm debt failure prediction. J. Account. Public Policy 18, 99–139. Breiman, L., Friedman, J.H., Olshen, R.A., Stone, C.J., 1984. Classification and Regression Trees, Wadsworth, Pacific Grove, CA. Cabena, P., Hadjinaian, P.O., Stadler, R., Verhees, J., Zanasi, A., 1997. Discovering Data Mining from Concept to Implementation, Prentice-Hall, Upper Saddle River, NJ. CART 4.0—for windows 95/98/NT, Salford Systems, San Diego, CA, 2001. Chai, B.-B., Huang, T., Zhuang, X., Zhao, Y., Sklansky, J., 1996. Piecewise linear classifiers using binary tree structure and genetic algorithm. Pattern Recognition 31, 1905–1917. Chen, M.S., Han, J.,Yu, P.S., 1996. Data mining: an overview from a database perspective. IEEE Trans. Knowledge Data Eng. 8 (6), 866–883. Cheng, B., Titterington, D.M., 1994. Neural network: a review from a statistical perspective (with discussion). Statist. Sci. 9, 2–54. Cox, D.R., Snell, E.J., 1989. Analysis of Binary Data, Chapman & Hall, London. Curt, H., 1995. The devil’s in the detail: techniques, tools, and applications for database mining and knowledge discovery—Part 1. Intell. Software Strategies 6, 1–15. Cybenko, G., 1989. Approximation by superpositions of a sigmoidal function. Math. Control Signal Systems 2, 303–314.
1128
T.-S. Lee et al. / Computational Statistics & Data Analysis 50 (2006) 1113 – 1130
Deakin, E.B., 1972. A discriminant analysis of predictors of business failure. J. Accounting Res. 10, 167–179. De Gooijer, J.G., Ray, B.K., Krager, H., 1998. Forecasting exchange rates using TSMARS. J. Int. Money Finance 17 (3), 513–534. Deng, P.-S., 1993. Automatic knowledge acquisition and refinement for decision support: a connectionist inductive inference model. Decision Sci. 24 (2), 371–393. Desai, V.S., Crook, J.N., Overstreet, Jr., G.A., 1996. A comparison of neural networks and linear scoring models in the credit union environment. European J. Oper. Res. 95, 24–37. Dumais, S., Platt, J., Heckerman, D., Sahami, M., 1998. Inductive learning algorithms and representations for text categorization. Proceedings of the 7th International Conference on Information and Knowledge Management, Bethesda, MD, pp. 148–155. Fayyad, U., Piatetsky-Shapiro, G., Smyth, P., 1996. The KDD process for extracting useful knowledge from volumes of data. Commun. ACM 39, 27–34. Fisher, R.A., 1936. The use of multiple measurements in taxonomic problems. Ann. Eugen. 7, 179–188. Flagg, J.C., Giroux, G.A., Wiggins, C.E., 1991. Predicting corporate bankruptcy using failing firms. Rev. Financial Econ. 1, 67–78. Friedman, J.H., 1991. Multivariate adaptive regression splines (with discussion). Ann. Statist. 19, 1–141. Friedman, J.H., Roosen, C.B., 1995. An introduction to multivariate adaptive regression splines. Statist. Methods Med. Res. 4, 197–217. Glorfeld, L.W., 1996. A methodology for simplification and interpretation of backpropagation—based neural network models. Expert Systems Appl. 10 (1), 37–54. Glorfeld, L.W., Hardgrave, B.C., 1996. An improved method for developing neural networks—the case of evaluating commercial loan creditworthiness. Comput. Oper. Res. 23 (10), 933–944. Griffin, W.L., Fisher, N.I., Friedman, J.H., Ryan, C.G., 1997. Statistical techniques for the classification of chromites in diamond exploration samples. J. Geochem. Explor. 59, 233–249. Harrell, F.E., Lee, K.L., 1985. A comparison of the discrimination of discriminant analysis and logistic regression. In: P.K. Se (Ed.), Biostatistics: Statistics in Biomedical, Public Health, and Environmental Sciences. NorthHolland, Amsterdam. Hastie, T., Tibshirani, R., 1990. Generalized Additive Models, Chapman & Hall, London. Haykin, S.S., 1994. Neural Networks: A Comprehensive Foundation, Macmillan, New York. Hecht-Nielsen, R., 1990. Neurocomputing, Addison-Wesley, Menlo Park, CA. Hornik, K., Stinchcombe, M., White, H., 1989. Multilayer feedforward networks are universal approximations. Neural Networks 2, 336–359. Hosmer, D.W., Lemeshow, S., 1989. Applied Logistic Regression, Wiley, New York. Jagielska, I., Jaworski, J., 1996. Neural network for predicting the performance of credit card accounts. Comput. Econ. 9 (1), 77–82. Jensen, H.L., 1992. Using neural networks for credit scoring. Managerial Finance 18, 15–26. Joachims, T., 1998. Text categorization with support vector machines: learning with many relevant features. Proceedings of European Conference on Machine Learning, Chemnitz, Germany, pp. 137–142. Joanes, D.N., 1993. Rejecting inference applied to logistic regression for credit scoring. IMA J. Math. Appl. Bus. Ind. 5, 35–43. Johnson, R.A., Wichern, D.W., 2002. Applied Multivariate Statistical Analysis, (Fifth Edition). Prentice-Hall, Upper Saddle River, NJ. Kay, O.W., Warde, A., Martens, L., 2000. Social differentiation and the market for eating out in the UK. Int. J. Hosp. Manage. 19 (2), 173–190. Kim, K.I., Jung, K., Park, S.H., Kim, H.J., 2002. Support vector machines for texture classification. IEEE Trans. Pattern Anal. Mach. Intell. 24 (11), 1542–1550. Kim, J.C., Kim, D.H., Kim, J.J., Ye, J.S., Lee, H.S., 2000. Segmenting the Korean housing market using multiple discriminant analysis. Constr. Manage. Econ. 18, 45–54. Kuhnert, P.M., Do, K.-A., McClure, R., 2000. Combining non-parametric models with logistic regression: an application to motor vehicle injury data. Comput. Statist. Data Anal. 34, 371–386. Laitinen, E.K., 1999. Predicting a corporate credit analyst’s risk estimate by logistic and linear models. Int. Rev. Financial Anal. 8 (2), 97–121. Laitinen, E.K., Laitinen, T., 2000. Bankruptcy prediction: application of the Taylor’s expansion in logistic regression. Int. Rev. Financial Anal. 9 (4), 327–349.
T.-S. Lee et al. / Computational Statistics & Data Analysis 50 (2006) 1113 – 1130
1129
Lee, H., Jo, H., Han, I., 1997. Bankruptcy prediction using case-based reasoning, neural networks, and discriminant analysis. Expert Systems Appl. 13, 97–108. Lee, G., Sung, T.K., Chang, N., 1999. Dynamics of modeling in data mining: interpretive approach to bankruptcy prediction. J. Manage. Inform. Systems 16, 63–85. Lee, T.S., Chen, N.J., 2002. Investigating the information content of non-cash-trading index futures using neural networks. Expert Systems Appl. 22 (3), 225–234. Lee, T.S., Chiu, C.C., 2002. Neural network forecasting of an opening cash price index. Int. J. Systems Sci. 33 (3), 229–237. Lee, T.S., Chiu, C.C., Lu, C.J., Chen, I.F., 2002. Credit scoring using the hybrid neural discriminant technique. Expert Systems Appl. 23 (3), 245–254. Lewis, P.A.W., Stevens, J.G., 1991. Nonlinear modeling of time series using multivariate adaptive regression splines (MARS). J. Amer. Statist. Assoc. 86, 864–877. Lippmann, R.P., 1987. An introduction to computing with neural nets. IEEE ASSP Mag. 4–22. MARS 2.0—for windows 95/98/NT, Salford Systems, San Diego, CA, 2001. Martell, T.F., Fitts, R.L., 1981. A quadratic discriminant analysis of bank credit card user characteristics. J. Econ. Bus. 33, 153–159. Neter, J., Kutner, M.H., Nachtsheim, C.J., Wasserman, W., 1996.Applied Linear Statistical Models, Irwin, Chicago, IL. Nguyen-Cong, V., Van, D.G., Rode, B.M., 1996. Using multivariate adaptive regression splines to QSAR studies of dihydroartemisinin derivatives. Eur. J. Med. Chem. 31, 797–803. Ohmann, C., Moustakis, V., Yang, Q., Lang, K., 1996. Evaluation of automatic knowledge acquisition techniques in the diagnosis of acute abdominal pain. Artif. Intell. Med. 13, 23–36. Osuna, E., Freund, R., Girosi, F., 1997. Training support vector machines: an application to face detection. Proceedings of the Conference on IEEE Computer Vision and Pattern Recognition, Puerto Rico, pp. 130–136. Overstreet, Jr., G.A., Bradley, Jr., E.L., Kemp, R.S., 1992. The flat-maximum effect and generic linear scoring model: a test. IMA J. Math. Appl. Bus. Ind. 4, 97–109. Piramuthu, S., 1999. Financial credit-risk evaluation with neural and neurofuzzy systems. European J. Oper. Res. 112, 310–321. Piramuthu, S., Shaw, M.J., Gentry, J.A., 1994. A classification approach using multi-layered neural networks. Decision Support Systems 11 (5), 509–525. Qnet 97—Neural Network Modeling for Windows 95/98/NT, Vesta Services, Winnetka, IL, 1998. Reichert, A.K., Cho, C.C., Wagner, G.M., 1983. An examination of the conceptual issues involved in developing credit-scoring models. J. Bus. Econ. Statist. 1, 101–114. Repley, B., 1994. Neural networks and related methods for classification. J. Roy. Statist. Soc. Ser. B 56, 409–456. Richeson, L., Zimmermann, R.A., Barnett, K.G., 1994. Predicting consumer credit performance: can neural networks outperform traditional statistical methods? Int. J. Appl. Expert Systems 2 (2), 116–130. Rumelhart, D.E., Hinton, D.E., Williams, R.J., 1986. Learning internal representations by error propagation in parallel distributed processing, vol. 1. MIT Press, Cambridge, MA, pp. 318–362. Sanchez, M.S., Sarabia, L.A., 1995. Efficiency of multi-layered feedforward neural networks on classification in relation to linear discriminant analysis, quadratic discriminant analysis and regularized discriminant analysis. Chemometr. Intell. Lab. Systems 28, 287–303. Sharma, S., 1996. Applied Multivariate Techniques, Wiley, New York. SPSS 1997—Statistic Modeling for Windows 95/98/NT, SPSS Inc., 1998. Steinburg, D., Colla, P., 1997. Classification and Regression Trees, Salford Systems, San Diego, CA. Stern, H.S., 1996. Neural Networks in Applied Statistics. Technometrics 38 (3), 205–216. Suh, E.H., Noh, K.C., Suh, C.K., 1999. Customer list segmentation using the combined response model. Expert Systems Appl. 17 (2), 89–97. Tang, Z., Fishwick, P.A., 1993. Feedforward neural nets as models for time series forecasting. ORSA J. Comput. 5 (4), 374–385. Thomas, L.C., 2000. A survey of credit and behavioral scoring: forecasting financial risks of lending to customers. Int. J. Forecasting 16, 149–172. Titterington, D.M., 1992. Discriminant analysis and related topics. In: Thomas, L.C., Crook, J.N., Edelman, D.B. (Eds.), Credit Scoring and Credit Control. Oxford University Press, Oxford, pp. 53–73. Torsun, I.S., 1996. A neural network for a loan application scoring system. The New Rev. Appl. Expert Systems 2, 47–62.
1130
T.-S. Lee et al. / Computational Statistics & Data Analysis 50 (2006) 1113 – 1130
Trevino, L.J., Daniels, J.D., 1995. FDI theory and foreign direct investment in the United States: a comparison of investors and non-investors. Int. Bus. Rev. 4, 177–194. Vapnik, V., 1995. The Nature of Statistical Learning Theory, Springer, New York. Vapnik, V., 1998. Statistical Learning Theory, Wiley, New York. Vellido, A., Lisboa, P.J.G., Vaughan, J., 1999. Neural networks in business: a survey of applications (1992–1998). Expert Systems Appl. 17, 51–70. West, D., 2000. Neural Network Credit Scoring Models. Comput. Oper. Res. 27, 1131–1152. Westgaard, S., van der Wijst, N., 2001. Default probabilities in a corporate bank portfolio: a logistic model approach. European J. Oper. Res. 135 (2), 338–349. Wiginton, J.C., 1980. A note on the comparison of logit and discriminant models of consumer credit behavior. J. Financial Quant. Anal. 15, 757–770. Wong, F.S., 1991. Time series forecasting using backpropagation neural networks. Neurocomputing 2, 147–159. Zhang, G., Patuwo, B.E., Hu, M.Y., 1998. Forecasting with artificial neural networks: the state of the art. Int. J. Forecasting 14, 35–62.