Abstractâ. Multi-core computers are ubiquitous and multi-socket versions dominate as nodes in compute clusters. Given the high level of parallelism inherent in ...
Modeling Memory Concurrency for Multi-Socket Multi-Core Systems Anirban Mandal Rob Fowler Allan Porterfield Renaissance Computing Institute Chapel Hill NC {anirban,rjf,akp}@renci.org
Abstract— Multi-core computers are ubiquitous and multi-socket versions dominate as nodes in compute clusters. Given the high level of parallelism inherent in processor chips, the ability of memory systems to serve a large number of concurrent memory access operations is becoming a critical performance problem. The most common model of memory performance uses just two numbers, peak bandwidth and typical access latency. We introduce concurrency as an explicit parameter of the measurement and modeling processes to characterize more accurately the complexity of memory behavior of multi-socket, multi-core systems. We present a detailed experimental multi-socket, multi-core memory study based on the P C HASE benchmark, which can vary memory loads by controlling the number of concurrent memory references per thread. The make-up and structure of the memory have a major impact on achievable bandwidth. Three discrete bottlenecks were observed at different levels of the hardware architecture: limits on the number of references outstanding per core; limits to the memory requests serviced by a single memory controller; and limits on the global memory concurrency. We use these results to build a memory performance model that ties concurrency, latency and bandwidth together to create a more accurate model of overall performance. We show that current commodity memory sub-systems cannot handle the load offered by high-end processor chips.
I. I NTRODUCTION Moore’s Law, the observation that the number of devices in an integrated circuit has been following an exponential growth trajectory, has had two very different effects in processor and memory chips. In processor chips, performance has increased dramatically as shrinking feature sizes allow higher clock rates and more logic gates are used to generate higher concurrency. For many years, the higher concurrency manifested itself as instruction-level parallelism (ILP) realized through the use of multiple deep pipelines and complex, out-of-order control. Recent designs exploit explicit parallelism in multiple cores running multiple threads. In contrast, DRAM memory parts have seen a dramatic increase in capacity, but memorycell speed has been nearly constant while improvements in concurrency (buffering) and in interconnect speeds have been more modest than those in processors. Multi-core systems, especially as nodes in computational clusters, pose new challenges for scientific computing. In
978-1-4244-6022-9/10/$26.00 ©2010 IEEE
assessing the tuning of scientific codes for a variety of multicore architectures, Williams et al. [20], [21] observed that while the Intel quad-core chips (5300-series (Clovertown), 5400-series (Harpertown)) had greater peak floating-point capacity than AMD Opteron systems, the latter outperformed the former on many multi-threaded, multi-socket benchmarks. With a memory controller and a set of memory DIMMs per processor chip, the AMD architecture adds scalable memory throughput. AMD system performance improves dramatically with fully populated DIMM slots [21]. Unsurprisingly, adding memory hardware addresses a performance problem directly by expanding memory-concurrency potential. The newest generation of Intel quad-core systems (Core i7) has approached this problem with an entirely new memory subsystem using more memory channels and DDR3 DRAM, thus leap-frogging AMD performance. Multi-core processor chips with nonblocking caches can generate a highly concurrent load that these memory systems must serve. Multiple concurrent references must be active to keep all of the memory subsystem busy. To obtain optimal performance, it is necessary to understand how many concurrent operations an application can support and to tune systems to that concurrent memory load. As the number of cores increases within a system node, the effective memory bandwidth per core drops. The amount of data per clock cycle that each core can access from off-chip is well below the amount historically considered necessary for a balanced system [1]. As multi-core systems become increasingly memory-bound, application optimization will become more focused on minimizing off-chip data traffic though maximal reuse of data on the chip. Therefore, in this work we focus on the memory accesses that must travel to the DIMMs. A good model of these accesses allows tuning and optimization tools to make informed decisions about resulting application performance. Most characterization methods for memory performance use two measures, memory latency and bandwidth. Memory read latency is the time between from issuance of a memory request and the moment when the data is available in the CPU. Memory bandwidth is the rate, usually expressed in bytes per
66
Authorized licensed use limited to: University of North Carolina at Chapel Hill. Downloaded on July 29,2010 at 14:02:33 UTC from IEEE Xplore. Restrictions apply.
second, at which a sequence of reads, writes, or some mix can transfer data between memory and the CPU. Models often treat these as scalar parameters that are fundamental properties of the system. Both measures depend on a set of complex factors and vary greatly depending on offered load within a system. Latency to different levels of memory (L1, L2, main memory) and peak memory bandwidth are most commonly used for system memory performance characterizations [16], [11], [3], [5]. Benchmarks like LMBench [10] and STREAM [9] are used to measure these parameters. These measures only tell a part of the story for multi-socket multi-core architectures. For example, Snavely et al. [18], [2] use linear models in which expected performance is computed as an inner product of a pair of vectors, one of which characterizes the system using a set of rates for various resources (including unit-stride and “random” memory bandwidths), while the other characterizes applications in terms of demand for each resource. This works well in a domain in which the linear relationships hold. In the context of comparing the performance of UPC versus Co-array Fortran versions of an application, Coarfa et al. [4] showed the importance of compilers that generate code to expose memory concurrency. In one case, exposing memory concurrency in UPC programs increased performance by a factor of 2.3 even with the same memory-access pattern. The key observation is that the offered concurrency among memory operations and the ability of the system to handle that concurrency are the fundamental determinants of performance, not the latency of individual memory operations. In the multi-socket, multi-core domain, simple linear relationships don’t hold true because these systems have bottlenecks at several levels. There are multiple points at which memory requests saturate different levels of the memory and bandwidth no longer increases with offered load. Each saturation point occurs at different numbers of concurrent access from all the threads sharing that hardware resource. Modeling the overall performance must take the multiple limits into account. Hence, a simple memory performance characterization for systems using the offered concurrent memory operation load will provide a more useful model to guide programming and optimization strategies. Because of the importance of concurrency in the systems of interest, we argue that it, rather than latency and bandwidth, should be seen as the fundamental quantity for modeling. The degree of concurrency to memory that a system can serve efficiently is largely a function of higher-level system design and can depend on several factors, including how many outstanding cache misses each core can tolerate, the number of memory controllers, the number of concurrent operations supported by each controller and memory communication channel design, as well as the number and design of each of the memory components. II. M ULTI - SOCKET M EMORY P ERFORMANCE We began this work by expecting to have to build a tool to examine the effects of memory concurrency, but quickly discovered that Pase and Eckl [13], [15], [14], [12], [6] had already developed and used P C HASE to examine the
memory latency and bandwidth of several IBM systems. In this study, P C HASE is specifically used in a mode to test memory throughput under carefully controlled degrees of concurrent access. Each thread executes a loop with a controllable number of independent “pointer chasing” operations per iteration. Each sequence of pointer addresses is pseudo-random and designed to defeat hardware prefetching while limiting TLB misses. We added wrapper scripts around P C HASE to iterate over different numbers of memory reference chains (thereby controlling memory concurrency) and threads for each P C HASE run. P C HASE was also modified to control thread placement on multi-socket, multi-core systems. Recently, several basic multi-socket node configurations have become popular for compute nodes within clusters ranging from a single blade server to some of the largest supercomputers. The most common configurations are currently (early 2010) 2 and 4 socket AMD Opteron (each with 2, 4, or 6 cores) and 2 socket Intel Core i7 (each with 4 cores). The core counts within each socket will be increasing and Intel expects the maximum number of sockets to increase to 8. To explore the significance of these system configurations in terms of memory performance, P C HASE is used to generate memory bandwidth graphs for representative examples (dual- and quadsocket AMD Opteron and a dual-socket Intel Core i7) of the current common node configurations. We have measured a wider variety of systems [17], but the present discussion covers only a few key examples due to space limitations.
A. P C HASE Benchmark P C HASE walks through a chain of memory references that is initialized such that the pointer to the next memory location is stored in the current memory location. This ensures that the next fetch in the chain cannot be issued until the result of the previous one is available. References from different chains can be issued concurrently. A P C HASE experiment run specifies the number of concurrent miss chains generated by a thread. The chains within a thread are independent and interleaved, so their references can be resolved concurrently. An experiment run also specifies the number of threads that access memory concurrently. Threads that run on different cores will use different paths to memory and may use different memory components. While concurrent references within a thread all use the same paths, references from threads on distinct cores and sockets use distinct on-core components, but will interleave and contend with one another in the downstream paths and components of the system. For this work, each experimental run of P C HASE is parametrized by (a) the memory requirement for each reference chain, (b) the number of concurrent miss chains per thread and (c) the number of threads. The other parameters (page size, cache line size, number of iterations, access pattern etc.) have been kept fixed. P C HASE was extended to pin threads to cores and to perform memory initialization after
67 Authorized licensed use limited to: University of North Carolina at Chapel Hill. Downloaded on July 29,2010 at 14:02:33 UTC from IEEE Xplore. Restrictions apply.
Fig. 1.
the pinning.
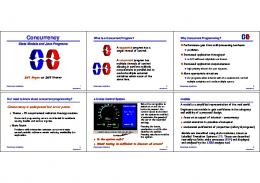
Memory Bandwidth vs. Concurrent Misses (WS1)
1
exceeded 1.99. For a two socket implementation, we saw no additional constraints on bandwidth.
B. Dual-socket AMD Opteron
C. Quad-socket AMD Opteron
The first system tested, WS1, was a Dell PowerEdge T605 with 2 AMD 2.1GHz processors for a total of 8 cores. It runs Ubuntu Linux with a 2.6.25.9 kernel. The memory slots were fully loaded (2 per bank, for a total of 8) with 2GB dual-rank DDR2/667 memory sticks for a total of 16GB. Two sets of tests are presented in Figure 1. The graph on the left has all the threads pinned to cores on one of the two sockets. Choice of socket did not significantly alter the results. The graph on the right uses both sockets and all 8 available cores. With one core active, this system exhibits a simple pattern of behavior. With a single miss, performance is about 850MB/sec. Each additional concurrent miss increases bandwidth by about 500MB/sec until a peak bandwidth of 3.45GB/sec with 7 outstanding references is reached. Any number of additional concurrent misses increases bandwidth by a total of less than 50MB/sec. A per-core limit on outstanding concurrent references clearly exists, which memory models for tuning and optimization should reproduce. For small numbers of concurrent misses per core (1-3), increasing the number of cores raised aggregate bandwidth nearly linearly (3.77 speedup for 4 cores). As the number of concurrent misses per core increases (> 6) the speedup falls to between 1.62 and 1.81. This second bottleneck is a chipwide limit that is more restrictive than the per-core limit. This chip limitation only appears when multiple cores on a chip are competing for resources. When additional concurrent accesses come from a second socket, performance nearly doubles in most cases. The lowest observed speedup was 1.93, and in several cases, speedup
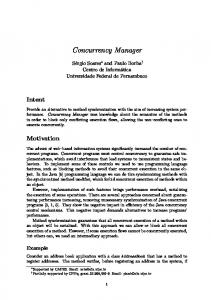
The next system, QB2, was a Dell PowerEdge M905 quadsocket blade with 4 AMD (Barcelona) 2.3GHz processors installed for a total of 16 cores. It runs CentOS Linux with a 2.6.26.2 kernel. QB2 has 16 dual-rank 2GB DDR2/667 memory sticks (evenly loaded) for a total of 32GB. Each socket had 8G of available memory. The same series of tests was run with one, two, three and four active sockets (Figure 2). Again, performance was independent of actual socket assignment. The experiments with 1 and 2 sockets active2 on this system exhibit the same behavior as seen on WS1, the dual-socket system. The additional load supplied by 3 and 4 active cores exposes another, harder limit to the number of concurrent misses. No additional performance is gained once there are approximately 50 concurrent misses active in the system. With 16 cores active, this limit can be reached with only 3 concurrent misses per core. We believe that this a function of the cache coherence protocol and is a third memory-bandwidth bottleneck that should be recognized by memory models for these processors. The newest generation of AMD Opteron processor (Istanbul) has 6 cores and the new feature HT Assist, also known as probe caching, which reduces the number of outstanding probes by caching information about which cache lines have been accessed by remote cores. We measured its effectiveness with the P C HASE benchmark with a quad-socket, 6-core Istanbul system (QB3) in Figure 3. QB3 is a Dell PowerEdge M905 2 Two performance anomalies exist when 4 cores and only some of the sockets are active and a large number of concurrent misses is active. The first occurs when a large amount of memory is being used by one socket, some of the memory is allocated on a second socket and a second memory controller increases the available total bandwidth. The second was found to be caused by the version of Linux being used. As the total amount of allocated memory became large (> 1.2GB), Linux started allocating all of the memory on one socket which therefore used one memory controller. The percentage of references being handled by one memory controller grew to almost 75%. The uneven loading caused performance to fall and then rose again as loading balance was restored.
1 During
initial testing, performance values varied tremendously (up to 60% on one of the AMD systems). This was determined to be due to unfortunate interactions between the Linux scheduler, the Linux memory allocation/placement policy and the threading library. Data was not allocated evenly to the memory controllers, some not used at all. This caused performance to vary wildly between executions. By using a version of taskset from N.C. State, cpuaff, we allowed the program to pin itself to specified cores and to allocate memory evenly across the memory controllers. The need for and effects of pinning are explored further in [17]. A newer Linux kernel, 2.6.31, substantially reduces the need for pinning.
68 Authorized licensed use limited to: University of North Carolina at Chapel Hill. Downloaded on July 29,2010 at 14:02:33 UTC from IEEE Xplore. Restrictions apply.
Fig. 2.
Memory Bandwidth vs. Concurrent Misses (QB2)
quad-socket blade with 4 AMD (Istanbul) 2.1GHz processors installed for a total of 24 cores. It runs CentOS Linux with a 2.6.32.7 kernel. QB3 has 16 dual-rank 2GB DDR2/800 memory sticks (evenly loaded) for a total of 32GB. Each socket has 8G memory available memory. For our P C HASE experiments, HT Assist eliminates the system-wide limit seen with QB2. For all tests, 4 sockets achieved a speedup of at least 397% over 1 socket, with almost all cases above 399%. Across the board, the 20% faster DIMM transfer rate of the QB3 (DDR2/800) resulted in a bandwidth increase between 20 and 40% compared to QB2 (DDR2/667). While the use of faster memory is benefical, fifth and six cores do not increase the peak bandwidth at all, but they do allow the peak to be reached with fewer offered concurrent memory references per thread. On the AMD-based system, the number of cores needed to generate a particular number of concurrent misses has negligible effect on the observed bandwidth.
D. Dual-socket Intel Core i7 The Intel Core i7 is currently available in single- or dualsocket configurations.3 NEH3 is a dual-socket Dell M610 blade with Intel 5570 Core i7 chips. Each has a 2.93GHz clock and 3 memory channels, each with a single dual-rank 2G DDR3/1333 memory stick for a total of 12G. It runs CentOS Linux (kernel 2.6.28). In our systems, adding a second DDR3 memory stick to a channel is possible, but lowers the speed of both sticks to 1066. Hyper-Threading increases peak memory bandwidth slightly (2-5%), reaches the peak with fewer cores, but has poorer performance with high concurrent accesses counts (0-2% for multiple sockets and 18-20% for a single socket). Because of this anomaly, all numbers presented in this paper are with Hyper-Threading turned off. The Intel Core i7 memory performance (Figure 4), is higher on an absolute basis than AMD. By using 3 channels of faster DDR3 memory, the amount of memory concurrency is increased and memory-operation latency is decreased compared to the Opteron dual-channel DDR2 configuration. Peak two-socket memory bandwidth for the Core i7 exceeds 35GB/sec vs 16GB/sec for an AMD. It is interesting to note the similarities and differences in the shapes of the curves for both 1 and 2 sockets between Intel Core i7 and AMD Opteron. For both, adding concurrent misses up to 7 leads to large increases in observed bandwidth. The AMD, however, exhibits a sharp “knee” in the curve beyond which there is almost no
Modeling memory system performance of multi-socket multi-core memory subsystems as a function of the number of concurrent misses becomes increasingly complex as each additional layer of memory bottleneck is added. Without accounting for all of the bottlenecks, any model is going to have regions in which the estimated performance does not match the actual performance. A simple model that takes each of the memory subsystem limitations into account is needed for accurate overall memory performance modeling.
3 We
intend to test larger systems as they become available.
69 Authorized licensed use limited to: University of North Carolina at Chapel Hill. Downloaded on July 29,2010 at 14:02:33 UTC from IEEE Xplore. Restrictions apply.
Fig. 3.
Memory Bandwidth vs. Concurrent Misses (QB3) - 1 and 4 sockets
Fig. 4.
Memory Bandwidth vs. Concurrent Misses (NEH3)
benefit, while the Intel chip continues to get small incremental improvements up to 10 outstanding references.
III. M EMORY M ODEL For performance prediction, code tuning, and compilation, a memory model that takes into account the various bottlenecks in a memory system is desirable. There are differences in memory systems for almost every processor and system. A usable model needs to be easy to generate for new systems, while being accurate particularly near the memory bottlenecks. A method to construct simple “roof-lines” [24], [23] is presented to build memory models for multi-socket, multicore systems. The resulting model is simple to construct and takes into account each of the observed memory sub-system limitations. It characterizes memory performance in terms of memory bandwidth offered by the system as a function of number of concurrent cache misses. The graph representing the model is piecewise-linear starting at a point and slopes upwards until a maximum is reached. To construct such a memory bandwidth model, a base bandwidth, bt , is needed. This is the observed memory bandwidth with one outstanding memory access from a single thread on one core. This quantity is obtained by running P C HASE with 1 thread and 1 concurrent cache miss. bt is generally a function of amount of memory per socket, memory and CPU speed, number of memory ranks, memory channels, and memory controllers, among other factors. The values that correspond to the various bottlenecks within
As the number of active cores per socket is increased, performance scales very well for a small number of concurrent misses per core, but a chip-wide memory bottleneck becomes evident. Peak memory bandwidth for four active cores is less than 1.75 times that of a single core. Thus, on the Core i7, there is less potential payoff for parallelizing memory bandwidth bound codes than there is on the Barcelona. As Intel produces chips with a larger number of QuickPath connections in the future, thereby allowing more sockets in a cache-coherent address space, it important to know any significant constraint on global bandwidth due to coherence protocol issues. Early testing of a quad-socket system does not show any signs of a system-wide limit. With current plans to allow up to 8 sockets and 8 cores per socket within a single system, this area will need future testing. Multi-core bandwidth is a function of the total number of concurrent misses on the AMD. On the Core i7, the bandwidth depends both on the number of concurrent misses per core and on the number of active cores. While the number of concurrent misses per core is low, the Core i7 shows nearlinear bandwidth increase as cores are added.
70 Authorized licensed use limited to: University of North Carolina at Chapel Hill. Downloaded on July 29,2010 at 14:02:33 UTC from IEEE Xplore. Restrictions apply.
the memory subsystem are also needed. mmax1 is the peak bandwidth from a single core, which can be obtained by running P C HASE “wide open” (for example, with 15 concurrent cache misses) using one thread. mmaxc is the peak bandwidth running on c cores within one socket. This is observed by running P C HASE “wide open” on c cores on a single socket. The final bottleneck , mmaxN , is defined as the node-peak bandwidth, which is the peak bandwidth achievable on a multisocket node and is related to memory coherence protocol limitations for a multi-socket address space, as discussed in section II-C. Again, this value is obtained by running P C HASE “wide open” on all the available cores. In addition to the various maxima, the slope is needed, i.e., how much potential bandwidth is added by each additional reference, which is denoted by m. If the hardware implementation is perfectly scalable, m can be calculated as the slope of the line joining bt and the origin (linear bandwidth increase as number of concurrent misses increase) or it can be computed as the slope of a linear fit of data points (considering up to the thread limit bandwidth – mmax1 ) for the base case (running one thread). For the AMD systems, this slope can be obtained by running P C HASE on one thread for 1 through 7 references and fitting a line passing through the base bandwidth. The bandwidth model for a single core with x outstanding memory references, bw core(x), can then be computed as initial bandwidth (bt ) plus bandwidth added by each additional reference, m, times the number of additional references, x−1, up to the maximum possible bandwidth out of one core. bw core(x) = min(mmax1 , bt + m ∗ (x − 1))
number of global memory references outstanding. The system memory bandwidth is capped at mmaxN , the node-peak bandwidth. Substituting appropriately for s, c and x, one can obtain the memory bandwidth model for a system by using equation 3. With a memory bandwidth model for a system, the memory latency model can be obtained for the system by using Little’s law [8]. Little’s law, a fundamental result of queuing theory, states that the average number of requests in a system is equal to the product of the arrival rate and the average time each request resides in the system. In communication, including memory communication, Little’s Law can be restated to be that the number of bits “in flight” is equal to the latency times the bandwidth. In terms of memory operations, the number of concurrent memory operations in the system times the amount of memory moved per operation is equal to latency times bandwidth. Assuming each memory reference fetches ‘cacheline size’ bytes (number of bytes in a cache line) of data from the memory. we can restate Little’s law as conc mem ref s ∗ cacheline size = latency ∗ bandwidth (4) where conc mem ref s is the number of concurrent memory references (due to concurrent cache misses), latency is the time (in seconds) to fetch 1 block of data from memory and bandwidth is the total number of bytes of memory moved per second. For a given system (sockets, s, cores per socket, c, and outstanding memory references per core, x), the total number of concurrent memory references would be
(1)
This core memory bandwidth model reflects the memory bandwidth limitations due to the limit on the number of outstanding memory references per thread. The model bandwidth is capped at mmax1 beyond which additional concurrent misses increases bandwidth little or none. A per-socket-memory-bandwidth model reflects the bandwidth limitations due to the limit on the number of concurrent memory references supported by a memory channel and scales the single core model by the number of active cores. Because both AMD and Intel display good scaling when adding cores with small numbers of concurrent misses, the above equation is used as a starting point. The memory bandwidth model with c active cores on a single socket, bw socket(c, x), is derived by multiplying each term by the number of active cores and using the maximum bandwidth for that number of cores (mmaxc ):
conc mem ref s = s ∗ c ∗ x
Combining these, the memory latency model of a multi-socket system, lat node(s, c, x) can be expressed as: lat node(s, c, x) =
(6)
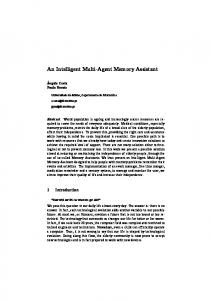
A. AMD Opteron (Barcelona) bandwidth model We present a simple sample use of the memory bandwidth model. Suppose the goal is to model the memory bandwidth for a nearby (architecturally) multi-socket, multi-core system. Another AMD quad-socket system, QB1 was examined. QB1 is similar to the QB2 system except in the number of memory parts per memory bank. While QB2 has 16 dual-rank 2GB DDR2 memory sticks with a total of 32GB system memory, QB1 has 24 dual-rank 2GB DDR2 memory sticks with a total of 48GB system memory, unevenly distributed across the memory controllers. For modeling this new system, we ran P C HASE with 1 thread and 1 concurrent cache miss and measured bt as 617.774 MB/s. The peak bandwidths were measured as: mmax1 = 3109.3 MB/s, mmax2 = 5392.6
To derive the model for a multi-socket system, the previous equation can be scaled by the number of active sockets, s. The memory bandwidth model of the entire multi-socket system, bw node(s, c, x), can be expressed as, s ∗ c ∗ bt + s ∗ c ∗ m ∗ (x − 1))
s ∗ c ∗ x ∗ cacheline size bw node(s, c, x)
These two equations, 3 and 6, provide a simple estimate of system bandwidth and latency for multi-socket, multi-core systems. The model is system-specific but is easy to compute with a few benchmark runs.
bw socket(c, x) = min(mmaxc , c ∗ bt + c ∗ m ∗ (x − 1)) (2)
bw node(s, c, x) = min(min(s ∗ mmaxc , mmaxN ),
(5)
(3)
This system memory bandwidth model reflects all three bottlenecks, including the one due to the limitations on the total
71 Authorized licensed use limited to: University of North Carolina at Chapel Hill. Downloaded on July 29,2010 at 14:02:33 UTC from IEEE Xplore. Restrictions apply.
QB1: 2 sockets 14000
6000
12000
Memory Bandwidth (MB/s)
Memory Bandwidth (MB/s)
QB1: 1 socket 7000
5000
4000
3000
Actual: 1 core active/socket Memory model: 1 core active/socket Actual: 2 cores active/socket Memory model: 2 cores active/socket Actual: 3 cores active/socket Memory model: 3 cores active/socket Actual: 4 cores active/socket Memory model: 4 cores active/socket
2000
1000
0
1
2
3
4
5
6
7
8
9
10
11
12
13
14
10000
8000
6000
Actual: 1 core active/socket Memory model: 1 core active/socket Actual: 2 cores active/socket Memory model: 2 cores active/socket Actual: 3 cores active/socket Memory model: 3 cores active/socket Actual: 4 cores active/socket Memory model: 4 cores active/socket
4000
2000
0
15
1
2
3
4
Concurrent misses / thread QB1: 3 sockets
4
2
x 10
7
8
9
10
11
12
13
14
15
x 10
1.8
1.6
1.6
Memory Bandwidth (MB/s)
Memory Bandwidth (MB/s)
6
QB1: 4 sockets
4
2
1.8
1.4 1.2 1 0.8 Actual: 1 core active/socket Memory model: 1 core active/socket Actual: 2 cores active/socket Memory model: 2 cores active/socket Actual: 3 cores active/socket Memory model: 3 cores active/socket Actual: 4 cores active/socket Memory model: 4 cores active/socket
0.6 0.4 0.2 0
5
Concurrent misses / thread
1
2
3
4
5
6
7
8
9
10
11
12
13
14
1.2
1
0.8 Actual: 1 core active/socket Memory model: 1 core active/socket Actual: 2 cores active/socket Memory model: 2 cores active/socket Actual: 3 cores active/socket Memory model: 3 cores active/socket Actual: 4 cores active/socket Memory model: 4 cores active/socket
0.6
0.4
0.2
15
Concurrent misses / thread
Fig. 5.
1.4
1
2
3
4
5
6
7
8
9
10
11
12
13
14
15
Concurrent misses / thread
Actual Memory Bandwidth vs. Model Memory Bandwidth - 1, 2, 3, 4 sockets (QB1)
MB/s, mmax3 = 6165.47 MB/s, mmax4 = 6432.03 MB/s and mmaxN = 18404.5 MB/s. The slope, m, was obtained by fitting the observed data points for the base case (running P C HASE with 1 thread) in QB2. Using these parameters, we can obtain the memory bandwidth for 1 through 4 sockets with 1 through 4 active cores per socket and 1 through 15 concurrent cache misses for QB1. The predicted memory bandwidth model was constructed by simple evaluation of the model equation 3, as described in the last section. Figure 5 shows actual bandwidths vs. bandwidth obtained by running the model for 1 through 4 sockets. The simple memory model fits well with observed data with maximum error being 13.32%. The error is less than 5% for 82% of the cases and often within a fraction of a percent. It can be inferred that the “roof-line” technique for modeling memory subsystem performance is both fast and surprisingly accurate across the full range of possible memory loads. When looking to predict execution time, whether in a compiler or in a performance prediction tool, this level of accuracy allows much better estimates to be produced. One of the major activities of any code-tuning process is the identification of performance bottlenecks. For a given system, this model clearly shows the limits of outstanding concurrent misses allowed.
of 2661.85 MB/s is computed. We used a slope of m = 1119.6 MB/s, which was computed by fitting the observed data points for the base case (running P C HASE with 1 thread) of a similar Intel 940 Core i7 system (single socket system with 2.93 GHz cpu, 6GB memory configured as 3 memory channels each with 2GB of dual-rank DDR3 memory). The peak bandwidths were measured as: mmax1 = 10247.6 MB/s, mmax2 = 15318.7 MB/s, mmax3 = 17063.1 MB/s, mmax4 = 17891.5 MB/s and mmaxN = 35375.7 MB/s. Comparing the estimate to the actual measured performance, the model is not as accurate as for the AMD systems, but is still within 20% of the observed data. The error is less than 10% for 77% of the cases and less than 5% for 66% of the cases. The bottlenecks are not as pronounced for the Intel systems; there is more tailing off of performance rather than the sharp bend observed for AMD. The model’s predicted performance is not as precise for the current generation of Intel Core i7 systems as it is for the AMD Opterons. We believe that this is a result of processor design decisions made by both vendors. A major selling feature for AMD has been memory performance, particularly in the highend server/gamer market. To achieve this advantage, it appears that AMD has consistently over-engineered the memory subsystem. The entire memory sub-system is not stressed until a bottleneck of some flavor is hit. We assume that each thread only has 7 hardware reservation stations for outstanding misses (really probably 8 and one saved for TLB misses). The DIMMs have a limit to the total memory traffic they can support and the coherence protocol has a limit to the number of active
B. Intel Core i7 bandwidth model We also use NEH3, an Intel Core i7 system, to build a memory bandwidth model with the same methods. A higher base, bt
72 Authorized licensed use limited to: University of North Carolina at Chapel Hill. Downloaded on July 29,2010 at 14:02:33 UTC from IEEE Xplore. Restrictions apply.
NEH3: 1 socket
4
x 10
1.6
3.5
1.4
3
1.2
1
0.8 Actual: 1 core active/socket Memory model: 1 core active/socket Actual: 2 cores active/socket Memory model: 2 cores active/socket Actual: 3 cores active/socket Memory model: 3 cores active/socket Actual: 4 cores active/socket Memory model: 4 cores active/socket
0.6
0.4
0.2
1
2
3
4
5
6
7
8
9
10
11
12
13
14
x 10
2.5
2
1.5 Actual: 1 core active/socket Memory model: 1 core active/socket Actual: 2 cores active/socket Memory model: 2 cores active/socket Actual: 3 cores active/socket Memory model: 3 cores active/socket Actual: 4 cores active/socket Memory model: 4 cores active/socket
1
0.5
0
15
Concurrent misses / thread
Fig. 6.
NEH3: 2 sockets
4
4
Memory Bandwidth (MB/s)
Memory Bandwidth (MB/s)
1.8
1
2
3
4
5
6
7
8
9
10
11
12
13
14
15
Concurrent misses / thread
Actual Memory Bandwidth vs. Model Memory Bandwidth - 1, 2 sockets (NEH3)
probes. Other memory controller resources are designed with enough slack that performance increases nearly linearly until these limits are reached. The Intel Core i7 appears to have a more balanced design, where shared components within the memory controller are nearly saturated just when the memory bottlenecks are reached. As contention increases for the nearly saturated resources (for example a buffer or queue inside the memory controller), it shows up as increased latency, which results in a curve to the peak performance rather than the sharp knee of AMD systems.
bottlenecks) and exposes the sub-optimal memory performance regions where increasing the number of concurrent references raises the latency without corresponding bandwidth increase. By exposing these regions of offered load where bandwidth does not increase but memory queuing latency does, it identifies regions in which program optimizations to increase memory concurrency are not going to improve performance. Conversely, by noting where increasing offered load results in greater bandwidth with little rise in latency, areas of potential further optimization are identified.
C. Latency model - AMD Opteron (Barcelona) & Intel Core i7
IV. I MPLICATIONS AND F URTHER R ELATED W ORK
A simple use case for the memory latency model would be to verify the accuracy of the latency model by comparing the measured latency data from QB1 and NEH3 with the predicted latency data for QB1 and NEH3 obtained by using Equation 6. Figure 7 shows the plot of memory bandwidth (MB/s) vs. memory latency (ns) for 1-4 sockets of QB1 with 1 and 4 active cores per socket and 1 through 15 concurrent cache misses per core. The x-axis denotes average effective memory latency and y-axis denotes memory bandwidth. Each point denotes a specific number of concurrent cache misses. For example, the left-most point in a curve corresponds to a concurrent reference value of 1 and the right-most point in a curve corresponds to a concurrent reference value of 15. Figure 8 shows the same plot for 1-2 sockets of NEH3 with 1 and 4 active cores per socket. We observe that the latency model for the AMD Opteron (QB1), when compared to the actual measured latency is always within 11.75%, often within fractions of a percent of the correct value. The error is less than 5% for 84% of the cases. For the Intel Core i7 system (NEH3) , the model latency differs from actual latency by less than 15% for 93.33% of the cases, by less than 10% for 74.16% of cases and by less than 5% for 64.16% of cases, with maximum error being 25%. This effective latency model provides a complete picture, as it ties together all three important attributes for memory performance estimation: concurrency, latency and bandwidth. It clearly identifies the ‘inflection’ points (hence the various
Williams et al. [24], [23], [22] use a “roof-line” model to provide a graphical aid for characterizing performance of computational kernels. It is presented as a two-dimensional graph with computational intensity (operations per DRAM byte) and attainable operation rate as the horizontal and vertical axes, respectively. The model has a horizontal, asymptotic bound imposed by the peak floating-point performance of the system. At low computational intensity, performance is constrained by peak memory bandwidth as measured using the Stream benchmark. Tighter memory bounds are added to the model by considering cases in which architectural features such as prefetching become ineffective or when access patterns become random. By explicitly introducing offered memory concurrency load as a model parameter, we extend the roofline model quantitatively to use offered memory concurrency as an additional variable to characterize and optimize code. Williams also points out [22] that with the addition of cores to a chip or system the offered memory concurrency will increase rapidly. Our work graphically illustrates that the current generation of memory subsystems for mainstream multicore designs fails to match the load offered by optimized codes running on all cores. On the other hand, for computational kernels with low concurrency, either inherently or as a result of poor optimization, adding threads and cores to a computation will bring it closer to the hardware bounds. Tikir et al. [19] have used a genetic algorithm approach to predict memory bandwidth as a function of cache-hit
73 Authorized licensed use limited to: University of North Carolina at Chapel Hill. Downloaded on July 29,2010 at 14:02:33 UTC from IEEE Xplore. Restrictions apply.
QB1: 2 sockets 14000
6000
12000
Memory Bandwidth (MB/s)
Memory Bandwidth (MB/s)
QB1: 1 socket 7000
5000
4000
3000
2000
Actual: 1 core active/socket Memory model: 1 core active/socket Actual: 4 cores active/socket Memory model: 4 cores active/socket
1000
0 100
150
200
250
300
350
400
450
500
550
10000
8000
6000
4000
Actual: 1 core active/socket Memory model: 1 core active/socket Actual: 4 cores active/socket Memory model: 4 cores active/socket
2000
0 100
600
150
200
250
Memory Latency (ns) QB1: 3 sockets
4
2
x 10
450
500
550
600
x 10
1.6
Memory Bandwidth (MB/s)
Memory Bandwidth (MB/s)
400
1.8
1.6 1.4 1.2 1 0.8 0.6
1.4
1.2
1
0.8
0.6
0.4 Actual: 1 core active/socket Memory model: 1 core active/socket Actual: 4 cores active/socket Memory model: 4 cores active/socket
0.2 0 100
200
300
400
500
600
Actual: 1 core active/socket Memory model: 1 core active/socket Actual: 4 cores active/socket Memory model: 4 cores active/socket
0.4
0.2 100
700
200
300
400
Memory Latency (ns)
Fig. 7. x 10
3
Memory Bandwidth (MB/s)
3.5
1.4
1.2
1
0.8
0.6 Actual: 1 core active/socket Memory model: 1 core active/socket Actual: 4 cores active/socket Memory model: 4 cores active/socket
0.4
60
80
100
120
140
160
180
200
x 10
800
900
2.5
2
1.5
1 Actual: 1 core active/socket Memory model: 1 core active/socket Actual: 4 cores active/socket Memory model: 4 cores active/socket
0.5
0 20
220
Memory Latency (ns)
Fig. 8.
700
NEH3: 2 sockets
4
4
40
600
Actual Memory Bandwidth & Latency vs. Model Memory Bandwidth & Latency - 1, 2, 3, 4 sockets (QB1)
1.6
0.2 20
500
Memory Latency (ns)
NEH3: 1 socket
4
Memory Bandwidth (MB/s)
350
QB1: 4 sockets
4
2
1.8
1.8
300
Memory Latency (ns)
40
60
80
100
120
140
160
180
200
220
Memory Latency (ns)
Actual Memory Bandwidth & Latency vs. Model Memory Bandwidth & Latency - 1, 2 sockets (NEH3)
rates by “learning” the bandwidth using memory bandwidth benchmarks. In contrast, our approach unites three aspects of memory performance (latency, bandwidth and concurrency) in a model that only examines the stream of cache misses.
instructions. Our memory-modeling approach also relates closely to bound and bottleneck analysis [7], which puts emphasis on highlighting and quantifying system bottlenecks to gain insights on performance of computer systems.
The asymptotic bandwidths attained at high concurrency levels in P C HASE are comparable to the figures from Stream, but running the P C HASE ensembles also exposes the full continuum from “random” to “streaming” access patterns and it does not depend upon compiler optimizations. The numbers collected using P C HASE do not reflect the possibilities of optimizations that reduce the number of DRAM page misses, nor do they capture the potential for hardware prefetching to be more efficient than a stream of explicit, concurrent load
V. C ONCLUSIONS In contrast to typical approaches that characterize memory performance in terms of inherent latency and peak bandwidth parameters, we have made memory-system concurrency a fundamental part of the measurement and analysis methodology. Thus, the memory bandwidth available to an application is not a fundamental property of the system, rather it is derived from the abilities of the application and compiler to present
74 Authorized licensed use limited to: University of North Carolina at Chapel Hill. Downloaded on July 29,2010 at 14:02:33 UTC from IEEE Xplore. Restrictions apply.
the system with enough concurrency in its memory reference stream and of the system to handle that load. Furthermore, effective memory latency is not a fundamental property of the system. Rather, the effective latency of any particular operation may be less than some base figure if the operation can be overlapped with code execution through the use of prefetching or code scheduling. Even if overlap with computation is not an available strategy, concurrent memory operations overlap with each other. If program execution can generate very high levels of memory operation concurrency, the effective latencies may be higher than the base latency due to queuing. These observations are not fundamentally new, but they are almost always forgotten in practice. The contribution of this work is to present practical measurement and analysis methods that support concurrency-centric modeling of memory performance. By making it easy to measure and analyze the capabilities of a system architecture for supporting concurrent memory loads, the resulting models can guide programming and optimization strategies to match codes to the capabilities of the systems. One application of the approach is to extend the “roof-line” model of Williams et al. [23] by adding a memory concurrency dimension. Thus, memory optimization can be done by increasing the concurrency of memory references rather than just by reducing the number of operations. Furthermore, on multi-threaded systems, we illustrate how there are operation points in which performance can increase by adding threads or by increasing memory concurrency per thread, as well as other modes in which increasing program concurrency only exacerbates a system bottleneck. As HPC and enterprise systems move to multi-socket, multi-core nodes, the quality of the memory model used by compilers will become critical to effective code generation. As memory bandwidth becomes the most serious problem for the compiler, a good understanding of the response of the memory system to an applied access pattern will be required. A memory-access pattern that is fine when executed by one thread may bottleneck the system if all of the cores attempt it in parallel. Understanding the interactions among the access patterns of multiple threads will become increasingly important to performance-tuning and debugging.
[4] Cristian Coarfa, Yuri Dotsenko, John M. Mellor-Crummey, Franc¸ois Cantonnet, Tarek A. El-Ghazawi, Ashrujit Mohanti, Yiyi Yao, and Daniel G. Chavarr´ıa-Miranda. An evaluation of global address space languages: co-array fortran and unified parallel c. In Keshav Pingali, Katherine A. Yelick, and Andrew S. Grimshaw, editors, PPOPP, pages 36–47. ACM, 2005. [5] G. Hager, T. Zeiser, and G. Wellein. Data access optimizations for highly threaded multi-core CPUs with multiple memory controllers. In Proceedings of IEEE International Symposium on Parallel and Distributed Processing, 2008 (IPDPS 2008), pages 1–7, April 2008. [6] R. L. Knapp, R. L. Pase, and K. L. Karavanic. ARUM: application resource usage monitor. In 9th Linux Clusters Institute International Conference on High-Performance Clustered Computing, April 2008. [7] Edward D. Lazowska, John Zahorjan, G. Scott Graham, and Kenneth C. Sevcik. Quantitative system performance: computer system analysis using queueing network models. Prentice-Hall, Inc., Upper Saddle River, NJ, USA, 1984. [8] J.D.C. Little. A proof of the queuing formula lwλw. Operations Research, 9, 1961. [9] John McCalpin. Memory bandwidth and machine balance in current high performance computers. IEEE Computer Society Technical Committee on Computer Architecture (TCCA) Newsletter, December, 1995. [10] Larry McVoy and Carl Staelin. lmbench: portable tools for performance analysis. In Proceedings of the 1996 annual conference on USENIX Annual Technical Conference, pages 23–, 1996. [11] Thomas Moscibroda and Onur Mutlu. Memory performance attacks: Denial of memory service in multi-core systems. In Proceedings of the 16th USENIX Security Symposium (USENIX SECURITY), Boston, MA, pages 257–274, August 2007. [12] Douglas Pase. The pChase benchmark page. http://pchase.org/. [13] Douglas M. Pase. Linpack HPL performance on IBM eServer 326 and xSeries 336 servers. Technical report, IBM, July 2005. [14] Douglas M. Pase and Matthew A. Eckl. Performance of the AMD Opteron LS21 for IBM Bladecenter. Technical report, IBM, August 2006. [15] Douglas M. Pase and Matthew A. Eckl. Performance of the IBM System x3755. Technical report, IBM, August 2006. [16] Lu Peng, Jih-Kwon Peir, Tribuvan K. Prakash, Carl Staelin, YenKuang Chen, and David Koppelman. Memory hierarchy performance measurement of commercial dual-core desktop processors. Journal of Systems Architecture, 54:8:816–828, August 2008. [17] Allan Porterfield, Rob Fowler, Anirban Mandal, and Min Yeol Lim. Performance consistency on multi-socket AMD Opteron systems. Technical Report RENCI Technical Report TR-08-07, Renaissance Computing Institute, 2008. [18] Allan Snavely, Laura Carrington, Nicole Wolter, Jesus Labarta, Rosa Badia, and Avi Purkayastha. A framework for performance modeling and prediction. In Proceedings of the 2002 ACM/IEEE conference on Supercomputing, pages 1–17, 2002. [19] Mustafa M. Tikir, Laura Carrington, Erich Strohmaier, and Allan Snavely. A genetic algorithms approach to modeling the performance of memory-bound computations. In Becky Verastegui, editor, SC, page 47. ACM Press, 2007. [20] S. Williams, K. Datta, J. Carter, L. Oliker, J. Shalf, K. Yelick, and D. Bailey. PERI: auto-tuning memory intensive kernels for multicore. Journal of Physics: Conference Series, 125 012001, 2008. [21] S. Williams, L. Oliker, R. Vuduc, J. Shalf, K. Yelick, and J. Demmel. Optimization of sparse matrix-vector multiplication on emerging multicore platforms. In Proceedings of the 2007 ACM/IEEE conference on Supercomputing, November 2007. [22] Samuel Webb Williams. Auto-tuning Performance on Multicore Computers. PhD thesis, EECS Department, University of California, Berkeley, Dec 2008. [23] Samuel Webb Williams, Andrew Waterman, and David A. Patterson. Roofline: An insightful visual performance model for floating-point programs and multicore architectures. Technical Report UCB/EECS2008-134, EECS Department, University of California, Berkeley, Oct 2008. [24] S.W Williams, D.A Patterson, L Oliker, J Shalf, and K Yelick. The roofline model: A pedagogical tool for auto-tuning kernels on multicore architectures. In HOT Chips, A Symposium on High Performance Chips, 2008. Stanford, CA.
ACKNOWLEDGMENT This project was supported by the DoD and by the DOE SciDAC PERI project(DE-FC02-06ER25764). R EFERENCES [1] Gene M. Amdahl. Validity of the single processor approach to achieving large scale computing capabilities. In Proc. AFIPS 1967 Spring Joint Computer Conf., pages 483–485, Apr. 1967. [2] Laura Carrington, Allan Snavely, and Nicole Wolter. A performance prediction framework for scientific applications. Future Generation Computer Systems, 22:3:336–346, February 2006. [3] Jonathan Carter, Yun (Helen) He, John Shalf, Hongzhang Shan, and Harvey Wasserman. The performance effect of multi-core on scientific applications. In Cray User Group 2007 conference (CUG 2007), May 2007.
75 Authorized licensed use limited to: University of North Carolina at Chapel Hill. Downloaded on July 29,2010 at 14:02:33 UTC from IEEE Xplore. Restrictions apply.