fabricated and tested using a new focused-beam network analyzer that we developed. I. INTRODUCTION. Two techniques have been reported for the modeling.
TU3B-7 Modeling of Quasi-Optical Arrays Polly Preventza,' Blythe Dicknian,' Eniilio Sovero,2 Michael P. De Lisio? James J. R ~ e n b e r gDavid , ~ B. Rutledge' Department of Electrical Engineering, California Institute of Technology, Pasadena, CA 91125 2Rockwell International Science Center, Thousand Oaks,CA 91358 3Departnient of Electrical Engineering, University of Hawai'i at MEnoa, Honolulu, HI 96822 4Departnient of Engineering, Harvey Mudd College, Claremont, CA 91711 Abstract- A model for analyzing quasi-optical grid ampliiers based on a finite-elementelectromagnetic simulator is presented. This model is deduced from the simulation of the whole unit cell and takes into account mutual coupling effects. By using this model, the gain of a 10 x 10 grid amplifier has been accurately predicted. To further test the validity of the model three passive structures with different loa& have been fabricated and tested using a new focused-beam network analyzer that we developed.
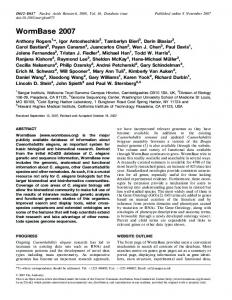
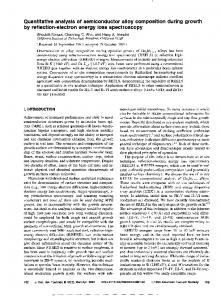
I. INTRODUCTION Two techniques have been reported for the modeling of quasi-optical system.. . The first technique aFsurnes an infinite array, allowing the grid to be analyzed with a single unit cell with synmietry planes [l].The unit cell of an amplifier grid is shown in Fig. 1. De Lisio et al. [I] developed a transniission-line niodel for this unit cell where the metal strips are analyzed by the method of nionients. The model is shown in Fig. 2 and it overpredicts the gain by 3dB. Mutual coupling between the lines is neglected.
15
1
I
I
I
-.
I
I
Fig. 2. (a) The unit-cell transmission-line model. The input, output leads and the bias lines are modelled as inductors. (b) Grid amplifier gain versus frequency.
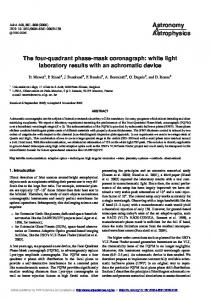
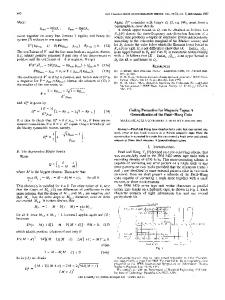
Fig. 1. Unit cell of a 100-element, 10-GHz grid amplifier [11. The input beam is coupled to the gates of the transistor through the horizontal gate leads. The output berun is reradiated from the vertical drain leads. The thin meandering lines provide bias to the drain and source.
The second technique 121, uses the method of nionients to simulate the full grid and includes the edge effects of the array. This niodel uses a simplified grid layout without complicated nietal shapes like meandering lines. It also overpredicts the gain by as much as 3dB. 563
0-7803-5135-5/99/$10.000 1999 IEEE
1999 IEEE MTT-S Digest
Advancement in finite-element analysis techniques, such as Ansoft’s High lirequency Structure Simulator (HFSS),allow an accurate and fast solution for the electromagnetic modeling of arbitrarily-shaped, p m sive, three-dimensional structures. Two new modeb that are an extension of the unit-cell trammimion-line niodel and include mutual coupling effects are developed based on HFSS simulations. The first niodel iR a lumped-element equivalent circuit of the unit cell. The rsecmd niodel finds the full scattering parameters in an approach that is similar to the calibration of a vector network analyzer. In this paper, we show that the new niodeLs agree very well with previously published measurements [l]. Comparison between measurements of pawive arrays and siiniulatiom further validate the new niodels.
11. MODELING OF
(
ellm
=
where 333
=
e21n
el2m
e;
+
%)
I [ i,,
*I 5
I II
----Theoly
I
Frequency, GHz
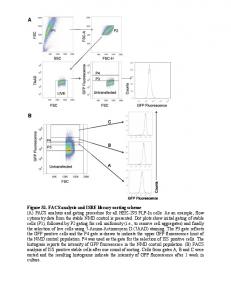
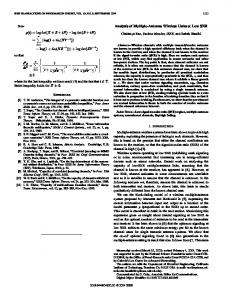
(b) 3. (a) Lumped-element equivalent circuit deduced from HFSS. Lb and L, are the inductancw of bias l i n s and gate radiating lead, respectively, and M is the mutual inductance between them. (b) The measured amplifier gain is within O.lidI3 of the theoretical prediction. Fig.
313
- 2e21m - e21n
e210
e210
-$;r---,
THE UNIT CELL
The empirical trammimion-line equivalent circuit used in [l]to model the unit cell is shown in Fig. 2(a). The input and output leads of the grid are modelled as inductors. The meandering bias lines are modelled as a shunt inductance. The numerical values of these. reactive elements are computed by &st using the niethod of moments to approximate the surfmecurrent distribution and then the induced emf niethod [3] to calculate the impedances of the elements. This technique analyzes single elements of the unit cell, thereby neglecting coupling effects between these elements. Two new models have been developed based on HFSS simulations of the whole unit cell. The first niodel, shown in Fig. 3, accounts for the cmpling between the gate lead and the biar, lines and predicts a gain that is only 0.5dB higher than measured. Other parasitic elements such as the inductance of the bond wires and the finite conductivity of the metal are a h included in the simulation. The wcmd technique, analopus to the calibration of a network analyzer, directly utilizes data obtained from HFSS two-port siniulatiom. Siniulatiom of the unit cell are carried out for matched, short and open terminations placed at the active d e vice location. Therie three twwport ,+parameter files, Go can then be u d to find the three-port s parameter matrix of the grid,
3
r---i
(1)
(2)
564
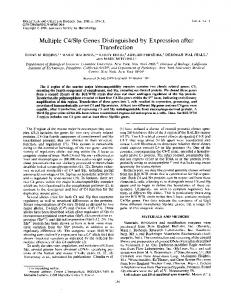
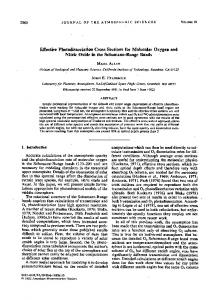
This procedure is done twice, once for each polarization. The resulting pair of *matrices is incorporated into the overall amplifier niodel as shown in Fig. 4(a).
3-port Equivalent output circuit
/ %port Equivalent
I Stabilising
Input Circuit
Resistance
Lw-4
-
+ Fig. 6. Quasi-optical meamrenient network analyzer. 0 Theory
-158
9
11
Fig. 7. Traminission and reflection nieacrurements of a 2.5-
Frequency, GHz
c m polysterene slab (er=2.45).
(b) Fig. 4. (a) The scattering-parameter model. (b) The nieas u r d amplifier gain conipared with theory.
similar to the topology of a grid amplifier. The arrays were fabricated by Rockwell International Science Center. The substrate used is a 0.63bmm thick, 75nml diameter GaAs wafer. The size of the array is chosen to be larger than the beaniwaist.
IV. MEASUREMENTS
Fig. 6. Passive array. The black lines are metal and the shaded area is the location of the devices and the various tenninations.
111. PASSIVE STRUCTURES To validate the use of HFSS in the design of the grid aniplifers, three 23 x 23-element passive structures with short circuits, open circuits and 7s-SI terniinations have been modelled and tcsted (Fig. S). The layout is very 565
We extended the lens-focused reflectometer, developed by Gagtion [4], to a full two-port system. The apparatus is shown in Fig. G. It uses two bi-convex lenses with a 30-cm diameter and focal length to f e cus the bean1 to a spot at the measurement plane. Two corrugated feed horns driven by an HP8722D vector network analyzer are used to transniit and receive the gaudan beam. The calibration standards for the network analyzer were a short (a large sheet of aluminum at the measurement plane), an offset short and a match ( a large section of absorber at some distance from the measurement plane). To check the calibration, measurements were made on a polysterene slab. Fig. 7 shows excellent agreement between simulation
I
\\\\
i,
----_.
40 GHZ
Fig. 8. Simulated and measured scattering parameters of the passive array with short-circuit terminations. The solid line shows the measurement.
Fig. 10. Simulated and measured scattering parameters of the passive array with open-circuit terminations. The solid h e shows the measurement. 10 x 10 grid amplifier. Finally, the scattering paranieter model was validated by measuring the scattering parameters of three passive arrays with different tern& nations.
V. ACKNOWLEDGMENTS The authors appreciate the support from the Arniy Research Office through the Caltech Quasi-Optic Power Combining MURI.
VI. R.EFERENCES
Fig. 9. Simulated and measured scattering parameters of the passive array with 7551 terminations. The mlid line shows the measurement. and measurement. Gating liw been wed to eliniinate niultiple reflections from the lenses and horns. Comparison between the scattering parameter model and niemurenients for the passive arrayR are shown in Fig. 8, 9 and 10. Agreement is good:
[l] Michael P. DeLisio, Scott W. Duncan, Der-Wei Tu,Cheng-Ming Liu, Alina Mous.sessian, James J. b n b e r g and David B. Rutledge, “Modeling and Perforniance of a 100-Element pHEMT Grid Amplifier,” IEEE %ns. on Micmwave Theory and Tech., (dd), No. 12,pp. 2136-2144,Dec. 1996. [2]M.A. Suniniew, C.E. Christoffemn, A.I. Khalil, S. N h a w a , T.W. Nutemn, M.B. Steer and J.W. Mink, “An Integrated Electromagnetic and Nonlinear Circuit Simulation Environment for Spatial Power Combining Systems,” 1998 IEEE MTT S Int. Microwave Symp. Dig. (2), pp. 168-176. [3] Z.B. PopoviC, R.M. Weikle, M.Kirn, D.B. Rutledge, “A 100-MESFET Planar Grid Oscillator,” Ieee %na. on Micmwave Theory and Tech., (39), pp. 823-826,1994. [4]D.R. Gagnon, “Highly Sensitive Measurements With a Lens-Focused Reflectometer,” IEEE %na. on Micmwave Theory and Tech., (39), pp. 2237-2240, Dec. 1991. ~
V. CONCLUSION We have presented two new models for the design of quasi-optical grid aniplifiew bmed on Ansoft’s HFSS. These models account for mutual coupling between the lines of the grid and for parasitic inductances. The niodeLs were used to accurately predict the gain of a 566