269
ISSN 1648-4142 print / ISSN 1648-3480 online TRANSPORT www.transport.vgtu.lt
TRANSPORT – 2006, Vol XXI, No 4, 269–273 MODELING STREAM SPEED IN HETEROGENEOUS TRAFFIC ENVIRONMENT USING ANN-LESSONS LEARNT Debasis Basu1, Bhargab Maitra2 Dept of Civil Engineering, Indian Institute of Technology Kharagpur, Kharagpur – 721 302, India. E-mails:
[email protected],
[email protected] Received 5 May 2006; accepted 4 September 2006
Abstract. In order to model traffic stream speed resulting from complex interactions among different vehicle
types in a heterogeneous/mixed traffic volume, an Artificial Neural Networks (ANN) approach is exploited. Two different categories of ANN model are attempted based on input vectors used. The performance of both categories of ANN model is evaluated using traditional evaluation framework. In addition, relevant logical test is carried out with both categories of ANN model. It is shown that selection of suitable input vectors and carrying out of relevant logical test are the two essential components for ANN model development process. Keywords: heterogeneous/mixed traffic, stream speed, Artificial Neural Networks (ANN).
1. Introduction The rapid growth of traffic congestion on urban roads has become a major concern to transportation professionals. The growing congestion level and resulting additional time, fuel cost, environmental degradation etc. have forced transportation professionals to think of innovative traffic engineering and management measures for mitigation of congestion on urban roads. An advance would be the ability to estimate the traffic state at present/future time slices and if this state was estimated to be congested, suitable traffic management and control measures could be formulated. Hence, an accurate short-term traffic parameters’ estimation has become a crucial step in overall goal of better road network management especially when substantial change of traffic condition is perceived over a span of analysis time. The accuracy in estimation of traffic state becomes a challenge especially for heterogeneous traffic condition because of the complex interactions among different vehicle types. The purpose of estimating present traffic state is to determine different traffic flow parameters in the present time window, using causal parameters of at-present time window. Stream speed resulted from mixed traffic volume is a fundamental traffic parameter, and the estimation of the same is necessary for formulating suitable traffic management measures. Stream speed is also used as Measure of Effectiveness (MOE) for defining the Level of Service (LOS) for urban roads.
In urban areas of developing countries, where the same traffic facility is utilized by different vehicle types, it is indeed needed to induct techniques of artificial intelligence as an alternative approach for traffic parameters’ estimation [1]. Among existing approaches of artificial intelligence, the neural network (NN) approach is commonly used for traffic prediction problems [2, 3]. Use of Artificial Neural Networks (ANN) techniques is advantageous as it is not necessary to predefine relationship between causal input vectors and corresponding output vectors. Also, ANN techniques have the capability to simulate any degree of non-linear complexities of a system in a more direct way by error minimization procedure. Therefore, ANN technique is used in the present work for short-term estimation of traffic stream speed resulting from mixed traffic volume. ANN techniques involve selection of suitable input vectors. As there are no established rules or guidelines for deciding the type and form of input parameters, researchers/ practitioners intuition laced with past experience about cause-effect relationship of the systems' behavior is often used for the same. In many cases, established past models’ parameters are considered as a preliminary guideline for selecting input vectors. But this method may generate erroneous results because those established models might have been developed under certain constrained environment for avoiding complexities of the system. Therefore, it is also necessary to carry out relevant logical test along with conventional basic statistical tests (like RMSE, Correlation Coefficient) for selecting an acceptable ANN model.
270
D. Basu, B. Maitra / TRANSPORT – 2006, Vol XXI, No 4, 269–273
In the present paper an attempt is made to use an ANN approach for the estimation of stream speed in a heterogeneous traffic system based on present traffic condition in an urban mid-block. Stream speed at-present time windows is modeled using logical causal parameters like composition of mixed traffic system, and vehicles’ static characteristics (i.e. vehicles’ physical dimension/ characteristics). 2. Background In the last decade, a lot of works have been done especially in the field of short-term traffic parameters forecasting for immediate future time windows based on traffic condition of present and a little past time windows. A wide range of approaches has been applied depending on type of data available, forecast horizon and end-use of forecast. Significant works have been done to develop responsive urban traffic control systems [4–8] including traffic parameters’ estimation/prediction. Prediction models have also been developed based on spectral analysis, time series or temporal type approaches [9, 10], Box-Jenkins analysis and Kalman filtering [11, 12]. NN approaches have also been used advantageously for short-term estimation/ prediction of traffic parameters [3, 13]. Back-propagation of NN for forecasting of traffic has been used by researchers [14, 15]. Back-propagation of NN was also used to make short-term forecasts of traffic flow, speed and occupancy in the Utrecht/Rotterdam/Hague region of the Netherlands [15]. A straightforward application of NN is possible for forecasting of traffic flows along a motorway link [9]. All these works strengthen the application of NN approach in estimation of traffic stream speed in a mixed traffic environment. 3. Database In order to demonstrate the methodology for studying the effect of mixed traffic volume on stream speed, an urban mid-block section, M. Karve Road in Mumbai Metro city, India is taken as the case study. M. Karve road is a four lane divided road with 7.0 m carriageway width in one direction. Classified traffic volumes and corresponding speeds of different vehicle types on one side of M. Karve road are recorded using Video-graphic technique. Although, speed and traffic volume data are extracted for every minute interval, the data for an interval of 5 min. is used for the present work after carefully observing the scatter of speed-flow data and the variation of estimated maximum hourly traffic volumes with different durations of counting (i.e. 1 min, 2 min, …, 15 min). It may be mentioned that traffic on the study road was operating predominantly in the stable flow zone i.e. covering the range of Level of Ser-
vice from A to E. Therefore, traffic stream speed is also modeled only for the stable flow zone. In the present study, four different vehicle types are considered, namely, Heavy Vehicles (HV) (i.e. the combination of buses and commercial vehicles), Old Technology Car (OC), New Technology Car (NC) and Two-Wheeler (TW). The physical plan area considered for Heavy Vehicle (HV), Old Technology Car (OC), New Technology Car (NC) and Two Wheeler (TW) are taken as 23 m , 7.82 m , 5.47 m , 1.44 m respectively. During the last decade, several new models of passenger cars have been launched in Indian market. These cars are called as “New Technology Cars”. In general most of these cars are smaller in size with superior speed capabilities and acceleration/deceleration characteristics as compared to traditional cars, which were dominating the Indian market in the past [16]. The traditional cars, which are still in use (especially as hired taxi), are referred to as “Old Technology Cars”. A refined dataset with 330 data points, each representing 5-minute traffic state, is used for estimating stream speed in the stable flow zone. Classified traffic counts, composition and physical characteristics of different vehicle types are used for the development of ANN model. The stream speed is calculated based on weighted speed of individual vehicle type. 2
2
2
2
4. Modeling stream speed using ANN Standard back propagation algorithm is used for training neural network, which is of feed-forward type. Two different categories of ANN models are attempted based on the type of input vectors used. From the traditional speed-flow relationships it is established that for a roadway and control condition, the speed of traffic stream depends on total traffic volume [17, 18] As traffic volume increases, the speed is reduced. However, the nature of reduction of stream speed with increase in traffic volume also depends on the characteristics of traffic stream namely the composition. Therefore, in the first category ANN model, total traffic volume (in number of vehicles) and composition of different vehicle types are used as input vectors for the modeling of stream speed. As four different vehicle categories are considered, a total of five input vectors is used for the development of ANN model. In traditional speed-flow relationships, the traffic volume is normally expressed in terms of Passenger Car Equivalency (PCE) by using static PCE values of different vehicle types present in a mixed traffic stream. However, static PCE values do not explicitly consider the non-linear effect of vehicle volume and its compositional variations on stream speed. Therefore, if the traffic volume is expressed .
D. Basu, B. Maitra / TRANSPORT – 2006, Vol XXI, No 4, 269–273
VEq = N HV
23 5.47 1.44 + N OC + N NC + NTW , 7,82 7.82 7.82
where: VEq – total equivalent car volume; N HV – number of heavy vehicles per hour; N OC – number of old technology cars per hour; N NC – number of new technology cars per hour; NTW – number of two wheelers per hour. The other four input nodes i.e. proportions of four different vehicle types are taken as volumetric share of different vehicle types in total equivalent volume. Therefore, in the second category of ANN model, total equivalent volume and volumetric share of each vehicle type are used as inputs for modeling the stream speed level. For both categories of ANN models, several alternative ANN architectures are attempted by varying number of hidden layers, number of nodes per hidden layer, initialization of weight matrix, learning rate, momentum factor, number of training cycles etc. Suitable values of all these parameters are determined through trial and error process, which essentially consisted of increasing and decreasing the parameters unless a comparatively better model than the previous one is obtained. For training purposes 258 training patterns are used whereas for testing the remaining 72 patters are used. For validation purpose, model outputs are compared with both known as well as unknown patterns using different basic statistical measures such as RMSE (Root Mean Square Error) and Correlation Co-efficient. After developing and comparing several models, a 5-3-1 (i.e. 5 input nodes and 1 output node with a single hidden layer of 3 nodes) ANN architecture is accepted for the first category of ANN model, whereas a 5-4-1 ANN (i. e. 5 input nodes and 1 output node with a single hidden layer of 4 nodes) architecture is accepted for the second category of ANN model. The training as well as testing performance of the best-selected ANN model under each category is given in the Table. It is found that there is no significant difference between the two categories of ANN model in terms of RMSE and
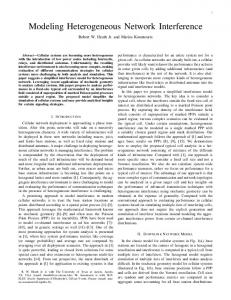
Correlation Coefficient. A further investigation is carried out with the two apparently comparable ANN models by observing modeled speed levels at incremental traffic volumes. Modeled speed levels as obtained from both the ANN models are shown in Fig 1. It is observed from Fig 1 that the variation of stream speed with traffic volume as obtained from each category of ANN model is logical though the first category of ANN model is a bit unable to simulate the speed level at very high traffic volume. The composition of traffic stream used for studying the speed-volume relationship included 9.57 % HV, 51.58 % OC, 13.40 % NC and 25.46 % TW. Training and testing performance for ANN models Best selected Best selected first second category Basic category ann model ann model statistical On On On testOn tests training ing pat- training testing patterns terns patterns patterns RMSE 1.907423 1.966647 2.059474 2.16912 Correlation 0.97063 0.960865 0.964612 0.951291 co-efficient 50 Stream Speed in km/h
in standard prescribed PCE values then the basic purpose of simulating the non-linear behavior of traffic stream using NN model will be lost, as all the volume level inputs to NN will be biased by the PCE values. On the other hand, expressing traffic volume in number of vehicles, especially in a mixed traffic stream may also be inadequate. Therefore, another alternative form of NN input is attempted by expressing traffic volume in terms of equivalent area of old technology cars. It may be recalled that physical plan area of a vehicle type is a static characteristic, while the PCE is a modeled value. Total equivalent car volume is estimated using Equation:
271
40 30 20
Selected First Category ANN Model
10
Selected Second Category ANN Model
0 100
750
1250
1750
2250
2750
3250
Base Traffic Volume
Fig 1. Variation of speed with base traffic volume
5. Logical test A logical test is carried out with the two apparently comparable ANN models to understand if interactions among different vehicle types in a mixed traffic stream, as captured by two different ANN models, are logical and meaningful. At a given volume level and composition, speed damage is defined as the reduction in stream speed caused by marginal increment in traffic volume by a vehicle type. Therefore, speed damage depends on type of vehicle under consideration. In estimating speed damage, the composition of traffic stream before marginal increment is kept the same as used for the development of speed–volume curve. With the same base composition, speed levels are estimated at different
D. Basu, B. Maitra / TRANSPORT – 2006, Vol XXI, No 4, 269–273
Speed damage ratio of heavy vehicle with respect to old tech. car
able accuracy for the dataset used in training and testing. But, it has not been able to capture the interactions among different vehicle types in a logical manner, and therefore should not be used for formulation of traffic management policy measures in mixed traffic environment. Although traffic engineering perspective and judgment played a vital role at this stage, it is shown as an essential 2,5 2 1,5
First Category ANN Model
1 0,5
Second Category ANN Model
0 500
1000
1500
2000
2500
3000
Base Traffic Volume
Fig 2. Speed damage ratio of heavy vehicle w. R. to old
tech. car at different base traffic volumes
Speed damage ratio of new tech. car with respect to old tech. car
traffic volumes ranging from 500 to 3250 vehicles per hour with an increment of hourly traffic volume by 250 vehicles per hour. For each base volume, marginal increment in total traffic volume is done separately by each vehicle type present in the traffic stream. As modeling of stream speed is based on 5min traffic data, marginal increment in a base volume implied addition of 12 vehicles of a type in the hourly traffic volume. The reduction in stream speed at different base volume levels due to the marginal increment in volume by different vehicle types are observed separately using each ANN model. Speed damage ratio of each vehicle type with respect to old technology car (i.e. speed damage caused by a vehicle type to speed damage caused by old technology car) is estimated at different base volume levels. The speed damage ratio of heavy vehicle with respect to old technology car at different base volume levels, as obtained from each ANN model is shown in Fig 2. It is well known that heavy vehicles, in comparison to old technology cars, are more detrimental to traffic stream at higher traffic volume levels. Therefore, with an increase in traffic volume, speed damage ratio of heavy vehicle should show an increasing trend. Fig 2 clearly shows that while the second category ANN model has logically captured the same, the first category ANN model has failed to do so. A similar investigation is made on speed damage ratio of new technology car as well as twowheeler with respect to old technology car. Fig 3 shows that for new technology car, the variation of speed damage ratio with traffic volume level, as obtained from the second category ANN model, is more acceptable and compatible to traffic engineering perspective and judgment. Similarly, the speed damage ratio of two-wheeler with respect to old technology car, as shown in Fig 4, indicates that the second category ANN model is more acceptable to traffic engineers. It could be noted that traffic engineering perspective and judgment may play a vital role while carrying out such logical tests for comparing the performance of two different models at this stage. A more formal comparison in terms of the closeness of modeled outputs with observed field data may not be possible while carrying out such logical tests. Fig 2, 3 and 4 altogether show that the second category ANN model has captured the interactions among different vehicle types in mixed traffic stream, in a much more logical and acceptable manner than the first category ANN model. The logical test carried out clearly shows that although traditional statistical validation procedure indicated nearly similar performance of two ANN models, it is only the second category ANN model that has captured the interactions among different vehicle types in the mixed traffic stream in a logical and acceptable manner. The first category ANN model produced the stream speed with an accept-
1
0,75
0,5
First Category of ANN Model
0,25
Second Category of ANN Model 0 500
1000
1500 2000 2500 Base Traffic Volume
3000
Fig 3. Speed damage ratio of new tech. car w. R. to old
tech. car at different base traffic volumes
1 Speed damage ratio of new tech. car with respect to old tech. car
272
0,75
0,5
0,25
First Cat egory of ANN Model Second Cat egory of ANN Model
0 500
1000
1500 2000 2500 Base T raffic Volume
3000
Fig 4. Speed damage ratio of two wheeler w. r. to old tech.
car at different base traffic volumes
D. Basu, B. Maitra / TRANSPORT – 2006, Vol XXI, No 4, 269–273
step for ANN model development process. The needs for using suitable input vectors laced with carrying out of relevant logical test are the two major aspects highlighted in the present work in relation to ANN model development process. An ANN model tries to correlate the input vectors, specified by modeler, with corresponding output vector in an error minimization procedure. The basic difference of two ANN models attempted in the present work, is the way the input vectors are defined. Physical dimensions of different vehicle types, used judiciously in defining input vectors, helped the second category ANN model to explain the variation of speed with both traffic volume and vehicle types in a logical and acceptable manner. Therefore, right selection of input vectors and their right forms play a pivotal role in ANN model development process. Finally, it is shown that logical test is useful to judge the acceptability of an ANN model for the estimation of stream speed in a mixed traffic operation. 6. Conclusions An attempt is made to develop a logically acceptable ANN model for estimating the stream speed resulting from complex interactions among different vehicle types in a mixed traffic stream. Two different categories of ANN models are developed, which are found to be comparable in terms of their performances during conventional training and testing process. The fundamental difference between two models is the nature of input vectors used. A further investigation is made on both categories of ANN models by carrying out relevant logical tests to understand the rationality of the relationship captured in models. Through logical test, it is found that while the second category of ANN model has captured interactions among different vehicle types present in mixed traffic stream in a logical and acceptable manner, the first category of ANN model has failed to do so. ANN is a powerful computational tool, which can also be used advantageously for traffic engineering applications. In the present paper, ANN is applied successfully for estimating stream speed resulting from complex interactions among different vehicle types in a mixed traffic stream. However, the experience gained from the present work highlights the need for using suitable input vectors and carrying out relevant logical test apart from conventional testing, before accepting an ANN model. References Yin, H.; Wong, S. C.; Xu, J.; Wong, C. K. Urban traffic flow prediction using a fuzzy-neural approach. Transportation. Research C, 2002, p. 85–98. 2. Dougherty, M. S.; Kirby, H. R. and Boyce, D. Using neural networks to recognise, predict and model traf1.
273
fic. Artificial Intelligence Applications to Traffic Engineering, 1994, p. 235–250. 3. Ledoux, C. An urban traffic flow model integrating neural network. Transportation Research 5C, 1997, p. 287–300. 4. Boillot, F.; Papageorgiou, M. A real time coordinated optimal control approach for urban traffic networks. In: Second International Capri Seminar on Urban Traffic Networks. 1992, p. 753–766. 5. Gartner, N. H.; Stamatiadis, C; Tarnoff, P. J. Development of advanced traffic signal control strategies for intelligent transportation systems: Multilevel design. Transportation Research Record, 1494, 1995, p. 98–105. 6. Gartner, N. H.; Tarnoff, P. J.; Andrews, C. M. Evaluation of optimized policies for adaptive control strategy. Transport Research Record, 1324, 1991, p. 105–114. 7. Hunt, P. G.; Robertson, D. L.; Bretherton, R. D.; Winton, R. I. SCOOT – A traffic responsive method of coordinating signals. TRRL LR1014, Transport and Road Research Laboratory, 1981, Crowthorne, UK. 8. Sims, A. G. The Sydney coordinated adaptive traffic system’. In: Proceedings of Engineering Foundation Conference on Research Directions in Computer Control of Urban Traffic System, Pacific Grove, 1979, p. 12–27. 9. Kirby, H.; Dougherty, M.; Watson, S. Should we use neural networks or statistical models for short term motorway traffic forecasting? International Journal of Forecasting, 13, 1997, p. 43–50. 10. Wild, D. Pattern-based forecasting, Second DRIVE II Workshop on short-term traffic forecasting, 1994, Delft. 11. Clark, S. D.; Dougherty, M. S.; Kirby, H. R. The use of neural networks and time series models for short term traffic forecasting: a comparative study. In: Transportation Planning Methods, Proceedings of PTRC 21st Summer Annual Meeting, Manchester, September 1993, London, 1993. 12. Whittaker, J.; Garside, S.; Lindveld, K. Tracking and predicting a network traffic process, Second DRIVE II workshop on short-term traffic forecasting, 1994, Delft. 13. Dougherty, M. S.; Kirby, H. R.; Boyle R. D. Using neural networks to recognise, predict and model traffic. In: M. Bielli, G. Ambrosino and M. Boero, eds. Artificial Intelligence Applications to Traffic Engineering (VSP, Utrecht, The Netherlands), 1994, p. 233–250. 14. Dochy, T.; Danech-Pajouh, M.; Lechevallier, Y. Shortterm road traffic forecasting using neural networks. RTS English Issue, 11, 1996, p. 73–82. 15. Dougherty, M.; Cobbett, M. Short-term inter-urban traffic forecasts using neural networks. International Journal of Forecasting, 13, 1997, p. 21–31. 16. Kadiyali, L. R.; Viswanathan, E. Study for updating road user cost data. Journal of Indian Roads Congress, 1993, Vol 54, No 3, p. 645–731. 17. Khisty, J.; Lal, B. K. Transportation engineering – an introduction. Third edition, Prentice Hall of India Private Limited, 2002, New Delhi. 18. Pignataro, L. J. Traffic Engineering: Theory and practice. Prentice-Hall Inc., Englewood Cliffs, 1973, New Jersey.