ping and decoding techniques over quasi-static fading channels both with and without antenna ... model parameters using EXIT charts, specifically emphasizing.
MODELLING THE FRAME ERROR RATE FOR ITERATIVE DEMAPPING AND DECODING TECHNIQUES OVER QUASI-STATIC FADING CHANNELS W. R. Carson and I. J. Wassell Computer Laboratory University of Cambridge United Kingdom Abstract — In this paper, we present and validate an analytical model for the frame error rate (FER) performance of iterative demapping and decoding techniques over quasi-static fading channels both with and without antenna diversity. In particular, the model characterises the FER performance in terms of four parameters only; the convergence threshold, the number of receive antennas, the number of transmit antennas, and the ratio of the energy per bit to the noise spectral density (Eb /N0 ). We also discuss some complications arising in the estimation of the convergence threshold from extrinsic information transfer (EXIT) charts, for various mapping schemes, different coding schemes and decoding algorithms. Results demonstrate that system characteristics over quasi-static fading channels are accurately captured by the model.
I.
I NTRODUCTION
The turbo principle was conceived over a decade ago by Berrou et al.[1]. The authors proposed an encoder consisting of the parallel concatenation of two recursive systematic convolutional (RSC) encoders separated by a pseudo-random interleaver, and the corresponding turbo decoder consisting of two component soft-input soft-output decoders that exchange soft information in an iterative manner. Turbo codes show an impressive performance, closely approaching the Shannon limit. Turbo or iterative techniques have since been proposed for a large number of communication scenarios including multi-user processing [2], space-time processing [3] and the processing of bit interleaved coded modulation (BICM) [4]. They have been shown to exhibit excellent performance over the additive white Gaussian noise (AWGN) channel [1]. In particular, it has been demonstrated that different system parameters, e.g., the interleaver size and the constituent RSC codes in the case of turbo codes, can dramatically affect the performance of iterative techniques over AWGN channels. Moreover, it has been also shown that they perform very well over fast fading channels [5], however they perform poorly over slow fading channels [6]. Essentially, over rapidly fading channels interleaving can be used as a means to create diversity by spreading the transmit symbols over multiple independently fading blocks in order to enhance performance. However, over slow fading channels interleaving cannot be used as a means to create diversity owing to delay and latency considerations. This situation compromises performance because occasional deep fades will affect the entire transmit frame causing severe error propagation in the iterative receiver [7]. The quasi-static fading situation is extremely important because it models various practical scenarios characterized by extremely low time and frequency diversity, e.g., fixed wireless access (FWA) channels. Bouzekri et al. [8] as well as Ro-
M. R. D. Rodrigues Instituto de Telecomunicac¸o˜ es Department of Computer Science University of Porto, Portugal drigues et al. [9] have studied the effect of quasi-static fading channels on the performance of turbo codes. In particular, Rodrigues et al. presented an analytical framework based on a simple model described by El Gamal and Hammons [7]. Key to the derivation of the FER framework is that there are zero or negligible decoding errors above a particular Eb /N0 value, termed the convergence threshold. However in an iterative demapping and decoding scenario [10] the use of a mapper as an inner encoder enables two other scenarios to arise: in the first instance a convergence threshold does not exist and in the second the decoding errors above the convergence threshold are non-negligible. Consequently, this paper follows this line of work by investigating in detail the robustness of the framework in [9] in modelling the performance of the iterative demapping and decoding schemes proposed by ten Brink over quasi-static fading channels both with and without antenna diversity. Section II introduces the system model. Section III presents the analytical framework for modelling the performance of iterative schemes over quasi-static fading channels. Section IV provides a range of simulation results. In particular, it considers the effect on the system performance of various mapping schemes, different coding schemes, different decoding algorithms as well as space diversity. This section also illustrates how to estimate the key model parameters using EXIT charts, specifically emphasizing the problems that arise in the estimation process when using sub-optimal demapping and decoding. Finally, the main conclusions of this work are summarized in Section V. II.
SYSTEM MODEL
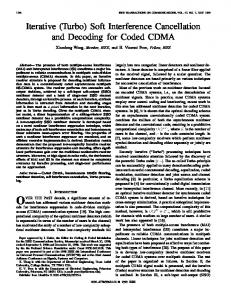
Fig.1 depicts the communications system model. We consider both single antenna systems (NT = NR = 1) often known as single-input single-output (SISO), which do not exploit space diversity, as well as multiple-input multiple-output (MIMO) antenna systems (NT , NR > 1), which do exploit space diversity. The transmitter consists of four main stages: the encoder, the interleaver, the mapper and the space-time processor (see Fig.1). Initially, the information bits are convolutionally encoded, at rate Rc , and these coded bits are then pseudorandomly interleaved. Finally, groups of log2 M interleaved coded bits are mapped to a complex symbol from a unit power M -ary quadrature amplitude modulation (QAM) constellation. In single transmit antenna systems (NT = 1), the space-time processing block does not further process the mapped symbols; instead, the mapped symbols are directly sent to the transmission block. However, in multiple transmit antenna systems (NT > 1), the space-time processing block will further pro-
of the code bits produced by the soft-input soft-output decodera log-likelihood ratio (LLR) - given by: X P r(bm (k) = 1|r) LDem (bm (k)|r) = ln D P r(bm (k) = 0|r)
p(r|s)P r(s)
(s∈s+ )
= ln X
p(r|s)P r(s)
(s∈s− )
X
p(r|s)
(s∈s+ )
= ln
P r(bm (k) = 1) + ln P r(bm (k) = 0) X
log K� 2M Y Y
p(r|s)
(s∈s− )
P r(bm� (k � ))
m� =1 k� =1 m� �=m k� �=k log K� 2M Y Y
(2) �
P r(bm� (k ))
m� =1 k� =1 m� �=m k� �=k
Figure 1: Communications system model.
cess the mapped symbols. In particular, the space-time processor generates a space-time block code (STBC) according to the generator matrices G2 , G3 or G4 given by [9]. Essentially, a total of K×NT symbols obtained from the original K � modulation symbols are transmitted during K time slots by NT transmit antennas. Note that G2 , G3 or G4 are appropriate for two, three and four transmit antennas, respectively, and for an arbi� trary number of receive antennas. The ratio Rs = K K denotes the rate of the STBC. Note also that G2 is rate Rs = 1, whereas G3 and G4 are rate Rs = 12 . The signal is distorted by a frequency-flat quasi-static fading channel as well as AWGN. Therefore, the relationship between the complex receive symbols and the complex transmit symbols associated with a specific STBC frame may be written: r = hs + n.
(1)
Here, r denotes the NR by K matrix whose element rj (k) denotes the complex receive symbol at time slot k and receive antenna j; s denotes the NT by K matrix whose element si (k) denotes the complex transmit symbol at time slot k and transmit antenna i; h denotes the NR by NT matrix of channel gains whose element hj,i denotes the channel gain from transmit antenna i to receive antenna j (note that hj,i is independent of time slot k); and n denotes the NR by K matrix whose element nj (k) denotes the noise random variable at time slot k and receive antenna j. The channel gains are uncorrelated circularly symmetric complex Gaussian with mean zero and variance 12 per dimension. The noise random variables are uncorrelated circularly symmetric complex Gaussian with mean zero and NT 1 = 2·SN variance 2·SN R R per dimension, where SNR denorm notes the average signal-to-noise ratio per receive antenna. The receiver consists mainly of two stages: (i) the soft demapper and (ii) the soft-in soft-out decoder, which are separated by pseudo-random interleavers and de-interleavers. These two stages exchange soft information in an iterative manner (see Fig.1). Specifically, the soft demapper takes as a priori (bm (k)) on the code bits which is an interinformation LDem A leaved version of the extrinsic information LDec E (bm (k)) on the code bits produced by the soft-input soft-output decoder, where bm (k) is the mth bit conveyed by the kth mapped symbol. Then, it computes the a posteriori information LDem (bm (k)|r) D
where s+ is the set of matrices of transmit symbols s such that bm (k) = 1 (i.e., s+ = {s: bm (k) = 1}), s− is the set of matrices of transmit symbols s such that bm (k) = 0 (i.e. s− = {s: bm (k) = 0}). The soft demapper is able to simplify this calculation by using the Jacobian logarithm [11], which we will refer to as max* demapping. Furthermore this can again be simplified by using the max. approximation to the Jacobian, and we shall refer to this as max. demapping. Finally, the soft demapper passes the extrinsic information (bm (k)) = LDem (bm (k)|r)−LDem (bm (k)) on the code LDem E D A bits to the subsequent stage - the soft-in soft-out decoder. Likewise, the soft-input soft-output channel decoder takes as a-priori information a de-interleaved version of the extrinsic information produced by the soft demapper. Then, it computes the a-posteriori information, using a soft-input soft-output decoding algorithm, e.g., the log-MAP algorithm or the SOVA algorithm [11]. Finally, the soft-input soft-output decoder passes the extrinsic information back to the the soft demapper.
III.
A NALYTICAL F RAMEWORK
We now consider an analytic framework to assess the frame error rate (FER) of the iterative demapping and decoding system over quasi-static fading channels with and without antenna diversity. In particular, we will characterize the FER in terms of specific system parameters, namely, the number of transmit and receive antennas, the energy per bit to the noise power spectral density, γb , and the convergence threshold γth . This analytic framework is based on a similar framework in [9] applicable for turbo codes, which in turn builds upon a simple model proposed by El Gamal and Hammons [7]. Assume transmission over an AWGN channel. We then assume that for an iterative system when γb ≤ γth the decoder frame error rate is bounded away from zero, whereas when γb > γth the decoder frame error rate approaches zero as the number of decoding iterations increases. Consequently, it is very simple to estimate the FER performance since the quasistatic fading channel corresponds � to a faded AWGN channel. The instantaneous γb = R1c R1s i,j |hj,i |2 SN Rnorm follows a chi-squared distribution with 2NT NR degrees of freedom [9]. Consequently the frame error rate is given by, where γ¯b is the
average value of γb . „
«�
� 1 � γth k! γ¯b /NT NR
�k �
A. EXIT charts: Estimating γth
The convergence threshold is defined as the lowest possible . (3) Eb /N0 value that allows the decoding trajectory to traverse the entire EXIT chart. It has been observed for turbo codes that k=0 γth is also given by the Eb /N0 value that causes the characWe observe “ that the”final term in (3) is the power series exγth teristic curves of the constituent codes to just touch and hence pansion of e γ¯b /NT NR truncated after NT NR terms. Note that pinch-off any possible trajectory from traversing the chart [12]. an = 0 for all n in the series expansion of e−x ex in (4).
FER = 1 − e
We note that the terms xn cannot affect the coefficents of lower order terms, therefore in the truncated series an = 0 for 0 < n < NT NR . Furthermore, the contribution that the truncated terms would have given to an for n ≥ NT NR must exactly balance the contribution due to the untruncated terms, e.g., only the truncated xNT NR term would contribute to aNT NR , therefore aNT NR = (NT−1 NR )! . The general term is: an =
n−NT NR
X
k=0
(−1)k+1 , for n ≥ NT NR . (n − k)!k!
We consider the performance of the model for Eb /N0 values above the convergence threshold; the performance will be dominated by the polynomial term of order NT NR , since an = 0 for 0 < n < NT NR . Consequently, we can further simplify the FER expressions for the high γ¯b regime in decibels: � � (NT NR )NT NR NT NR (γth − γ¯b ) + log10 FERdB = . (5) 10 (NT NR )! These expressions tell us that the gradient of the FER plots depends only on the number of transmit and receive antennas. IV.
S IMULATION R ESULTS
This section investigates the robustness of the analytical framework in modelling the performance of an iterative demapping and decoding system over frequency-flat quasi-static fading channels both with and without antenna diversity. We consider various mapping schemes including 16-QAM with Gray, antiGray and Boronka mappings (see [10] for details), with either max* or max. demapping. We also consider various coding schemes, rate 1/2 RSC codes with memory two (octal generator polynomial (1, 5/7)) and four (octal generator polynomial (1, 21/37)) with either log-MAP or SOVA decoding. We denote the combination of max* demapping and log-MAP decoding by max* log-MAP decoding, with extensions to max. demapping and SOVA decoding. We use EXIT charts [12] to estimate the convergence threshold γth for the various system configurations, since it is not possible to perform such estimation with analytic techniques. In particular, we will determine both the transfer characteristics and the decoding trajectories for a frame length of 106 bits. In contrast, we will determine the FER performance for a frame length of 2048 bits, averaged over 104 realisations per Eb /N0 value. Note that even though the convergence threshold is only an appropriate measure for very long frames, e.g., 106 bits, the analytical framework still produces very accurate FER results for shorter frames.
RSC Encoder
Demapper
(1,5/7)
max* max
γth Estimate (dB) anti-Gray Boronka 4.7 3.7 5.2 (4.8) 4.0 (3.8)
max* max max* max
5.3 5.7 (5.4) 5.7 (3.7) 5.8 (3.8)
4.2 4.6 (4.3) 4.7 (2.9) 4.9 (3.1)
max* max
6.3 (4.1) 6.4 (4.2)
5.3 (3.4) 5.4 (3.5)
MAP (1,21/37) (1,5/7) SOVA (1,21/37)
Table 1: Convergence thresholds for anti-Gray and Boronka, with RSC codes (1,5/7) and (1,21/37). Estimates using characteristic curves are in brackets.
1) Max* log MAP decoding We observe that the trajectory plot follows the EXIT chart characteristic curves and hence both predict the same convergence threshold, Fig. 2. Generally, we would choose to calculate γth using the characteristic curves, rather than the decoding trajectory, since these are less computationally expensive to simulate. Once we have constructed the EXIT chart, we are able to predict certain qualitative aspects of the FER performance plots. The value of γth is affected by the initial part of the curves on the EXIT chart and initially, the (1,21/37) curve lies above the (1,5/7) curve. This implies that for both anti-Gray and Boronka mappings the lower memory code would have a lower γth . It is important to note that schemes such Gray mapping will not have a convergence threshold due to the shallow gradient of the demapping characteristic curves and therefore, FER performance is dominated by the final portion of the curves on EXIT charts; where the (1,21/37) curve now lies below the (1,5/7) curve. This implies that for Gray mapping, the (1,21/37) code has the better FER performance curve. 1 0.9 0.8 0.7 0.6 Dec
=
, IA
=
Decoding algorithm
x3 x2 x3 x2 − + ...)(1 + x + + + ...) (1 − x + 2! 3! 2! 3! 2 3 1 + a1 x + a2 x + a3 x + ... (4)
Dem
e
NT NR −1
1+
0.5
IE
e
−x x
−γth γ¯b /N N T R
RSC(1,5/7)
0.4
RSC(1,21/37) 0.3
anti−Gray Demapping Characteristic Curve anti−Gray Decoding Trajectory
0.2
Boronka Demapping Characteristic Curve Boronka Decoding Trajectory
0.1
Gray Demapping Characteristic Curve 0
0
0.25
0.5 IDem , IDec A E
0.75
1
Figure 2: EXIT chart characteristic curves and decoding trajectories. All curves were recorded for an Eb /N0 = 4.7dB with max* log-MAP decoding.
1
0.9
0.8 IDem E
1
0.8 0.7
0.4
0.6
0.2
SOVA Decoding 0
0.25
IDem A
0.5 1
IE
Dem Dec ,IA
0.6
0.5
0.75
1
0.4 0.8 0.3 0.2
Traj. Eb/N0=4.9dB
0.1 0
IDem E
RSC (1,5/7) Traj. Eb/N0=4.8dB
0.4 0.2
0
0.25
0.5 IDem ,IDec A E
0.75
1
0
0.25
Dem
0.5
0.75
1
IA
Figure 4: EXIT chart bit-wise decoding trajectories for Boronka mapping and
RSC encoding with generator polynomial (1,5/7) for an Eb /N0 = 5dB decoded with max. SOVA and max* log-MAP. Note that two of the four bit-wise decoding trajectories per EXIT chart overlap and are difficult to distinguish.
Demapping with max. and SOVA decoding
Unfortunately, when we replace either max* with max. demapping or log-MAP by SOVA decoding or both, the characteristic curves of the EXIT chart and the decoding trajectories no longer match, Fig. 3, and therefore they generate two different values for γth , Table 1. The convergence threshold in increased by about 0.3dB by using max. demapping and 2.0dB by using SOVA decoding. It is also interesting to note that due to the deforming of the decoder curve with SOVA compared to the MAP algorithm, the characteristic curves actually predict a lower γth with SOVA than with MAP, Table 1. We further observe that after the fourth iteration of the Eb /N0 = 4.8dB decoding trajectory the mutual information actually begins to decrease. This is particularly interesting and unexpected because it implies that at the fourth iteration an inDem Dem actually decreases the IE . The SOVA decrease in the IA coding is known to overestimate the extrinsic information [13] and we believe that this overconfidence causes the decrease in Dem at the demapper output after the fourth iteration. IE 3)
MAP Decoding
Char. Eb/N0=4.9dB
Figure 3: EXIT chart characteristic curves for Boronka mapping and RSC encoding with generator polynomial (1,5/7), and max. SOVA decoding.
2)
0.6
dent distributions, Fig. 4. We observed that the demapper is highly dependent on the weighting of mutual information over the bits in a symbol, therefore the four independent distributions will cause the decoding trajectory to deviate from the demapper characteristic curve. We get a similar effect of unDem if we implement max. instead evenly distributed average IA of max* demapping with log-MAP decoding. B. FER Results Once we have an accurate estimate of the convergence threshold we are able to assess the robustness of the model to different mapping schemes and coding schemes. Fig. 5 depicts the FER versus Eb /N0 performance curves for max* demapping and log-MAP decoding obtained both by analysis and simulation. We denote MIMO scenarios with shorthand notation, e.g., 4Tx4Rx means four transmit and four receive antennas. The model predicts that any curves that have the same antenna diversity will have the same gradient for γ¯b >> γth , see
EXIT Chart Assumptions 0
10
SISO −1
10
FER
Characteristic curves are simulated under the assumption that the input a-priori information is drawn from a single Gaussian distribution. F`abregas and Grant [14] investigated an iterative demapping and decoding scheme where the decoding trajectories did not follow the characteristic curves and reasoned that this was due to the non-Gaussian a-priori distribution. We have already seen that when we use max* log-MAP decoding, the decoding trajectory matches the characteristic curves, Fig. 2. In this scenario, we also observed that the apriori information for our system is also non-Gaussian however the a-priori information is drawn from a single distribution, i.e. Dem per bit is the same. the average IA We have also already seen that when we use max SOVA decoding, the decoding trajectory does not match the characteristic curves, Fig. 3. In this scenario, we also observed nonGaussian a-priori information however the a-priori information is no longer drawn from a single distribution. Instead each Dem , of the bits in the 16-QAM symbol have different average IA i.e., the input a-priori information is drawn from four indepen-
2Tx2Rx −2
10
Gray Sim. Boronka Sim. 4Tx4Rx
Boronka Anlys anti−Gray Sim. anti−Gray Anlys
−3
10
0
2
4
6
8
10 Eb/N0
12
14
16
18
20
Figure 5: FER versus Eb /N0 performance curves for an iterative system with max* log-MAP decoding. The RSC code generator polynomials are (1,5/7) (thin lines and symbols) and (1,21/37) (bold lines and symbols).
V.
C ONCLUSIONS
In this paper we have investigated in detail the performance of an analytical model for iterative demapping and decoding techniques over quasi-static fading channels both with and without antenna diversity. In particular, we have considered the accuracy of such a model for BICM-ID and the effect on the accuracy of the model to variations of the system parameters, including different demapping strategies, different decoding algorithms, different mapping schemes and different coding schemes. Results demonstrated that the model can capture the FER performance when we are able to accurately estimate the convergence threshold. Difficulties in estimating the convergence threshold arising from the use of sub-optimal demapping and decoding are also discussed.
0
10
SISO
−1
10
2Tx2Rx
FER
(5), therefore in this region and for a fixed FER, the performance gain in dB of one scheme over another corresponds to the difference in dB between the convergence thresholds. We observe that for the anti-Gray and Boronka mappings, the analytical model is a good approximation to the simulated FER curves. Furthermore, since the gradient of the Gray mapping 4Tx4Rx curve differs from the others, we would be unable to model it accurately. We also observe that both anti-Gray and Boronka mappings outperform Gray mapping for systems both with and without antenna diversity. Increasing the constraint length of the RSC encoder affects non-iterative and iterative mappings schemes differently; the FER performance for both anti-Gray and Boronka mappings is made worse whereas the FER performance improves for Gray mapping. We were able to predict this performance using both the analytical model and EXIT charts, by considering the shape of the characteristic curves at the beginning and end of the charts. In [10], we observed that for Gray mapping, longer memory codes have longer burst errors than shorter codes, however burst errors are more frequent for the shorter codes and this dominates performance, leading to longer codes outperforming them. We believe that for anti-Gray and Boronka mappings, the burst length dominates performance and leads to longer codes performing worse than to shorter codes. We observe the robustness of the model to variations in the demapping and decoding algorithms, Fig. 6. For all decoding schemes that do not implement max* log-MAP decoding, we implement the convergence threshold estimated from the decoding trajectory since these are always the true values. As we would expect, by implementing max. SOVA decoding we decrease the computational complexity at the expense of FER performance. The max. demapping approximation has a less profound effect in terms of γth estimation and reduced FER performance compared with SOVA. Again since this scenario is modeled well we are able to estimate the performance of the decoding algorithms at low FER as the difference in convergence thresholds, e.g. at a FER = 10−3 , max* log-MAP decoding is 4.9 − 3.7 = 1.2dB better than max SOVA decoding. We finally observe that we are able to accurately model the FER performance for a frame length of 2048 bits, even though γth was estimated using a much longer frame length, 106 bits.
4Tx4Rx
−2
10
MAP Sim. MAP Bound SOVA Sim. SOVA Bound
−3
10
0
2
4
6
8
10 12 EB/N0 (dB)
14
16
18
20
Figure 6: FER versus Eb /N0 performance curves for an iterative system with Boronka mapping and RSC code generator polynomial (1,5/7), for demapping with max*(bold lines and symbols) and with max. (thin lines and symbols).
ACKNOWLEDGMENT The authors would especially like to thank Dr. Ioannis Chatzigeorgiou for valuable discussions and comments. R EFERENCES [1] C. Berrou and A. Glavieux, “Near optimum error correcting coding and decoding: Turbo codes,” in IEEE Trans. Commun., Oct. 1996. [2] X. Wang and H. V. Poor, “Iterative (turbo) soft interference cancellation and decoding for coded CDMA,” in IEEE Trans. Commun., July 1999. [3] B. Lu and X. Wang, “Iterative receivers for multiuser space-time coding systems,” in IEEE J. Select. Areas Commun., Nov. 2000. [4] S. ten Brink, J. Speidel, and R. H. Yan, “Iterative demapping and decoding for multilevel modulation,” in Proc. IEEE Globecom ’98, July 1998. [5] E. K. Hall and S. G. Wilson, “Design and analysis of turbo codes on Rayleigh fading channels,” in IEEE J. Select. Areas Commun., Feb. 1998. [6] L. Lin, L. J. Cimini, and C. I. Chuang, “Comparison of convolutional and turbo codes for OFDM with antenna diversity in high-bit-rate wireless applications,” in IEEE Commun. Lett., Sept. 2000. [7] H. E. Gamal and J. A. R. Hammons, “Analyzing the turbo decoder using the Gaussian approximation,” in IEEE Trans. Commun., Feb. 2001. [8] H. Bouzekri and S. L. Miller, “An upper bound on turbo codes performance over quasi-static fading channels,” in IEEE Commun. Lett., July 2003. [9] M. R. D. Rodrigues, I. A. Chatzigeorgiou, I. J. Wassell, and R. A. Carrasco, “On the performance of turbo codes in quasi-static fading channels,” in Proc. IEEE ISIT ’05, Sept. 2005. [10] W. R. Carson, I. Chatzigerorgiou, M. R. D. Rodrigues, I. J. Wassell, and R. Carrasco, “On the performance of iterative demapping and decoding techniques over quasi-static fading channels,” in Proc. PIMRC 2007, Sept. 2007. [11] J. P. Woodard and L. Hanzo, “Comparitive study of turbo decoding techniques: An overiew,” in IEEE Trans. Veh. Technol., Nov. 2000. [12] S. ten Brink, “Convergence behaviour of iteratively decoded parallel concatenated codes,” in IEEE Trans. Commun., Oct. 2001. [13] L. Papke, P. Robertson, and E. Villebrun, “Improved decoding with the sova in a parallel concatenated (turbo-code) scheme,” in Proc. Int. Conf. Commun., July 1996. [14] A. Guill´en i F´abregas and A. Grant, “Capacity approaching codes for non-coherent orthogonal modulation,” to appear in IEEE Trans. Wireless Commun.