Instituto Nacional de Investigación y Tecnología Agraria y Alimentaria (INIA) Available online at www.inia.es/forestsystems
Forest Systems 2010 19(3), 449-457 ISSN: 1131-7965 eISSN: 2171-9845
Models for simulating the development of even-aged Pinus brutia stands in Middle East S. de-Miguel1,2*, T. Pukkala1, Z. Shater3, N. Assaf4,5, B. Kraid6 and M. Palahí7 1
Faculty of Science and Forestry. University of Eastern Finland. P.O. Box 111. 80101 Joensuu. Finland Centre Tecnològic Forestal de Catalunya. Ctra. Sant Llorenç de Morunys, km 2. 25280 Solsona. Spain 3 Department of Forestry and Ecology. Faculty of Agriculture. University of Tishreen. Latakia. Syria 4 Department of Conservation of Natural Capital. Directorate General of Environment. Ministry of Environment. Lazarieh bldg. Block A-4 New, 7th floor. P.O. Box 11-2727. Beirut Central District. Lebanon 5 Universidad de Lleida. Avda. Alcalde Rovira Roure, 191. 25198 Lleida. Spain 6 Department of Forestry and Ecology. Faculty of Agriculture. University of Aleppo. Syria 7 European Forest Institute. Mediterranean Regional Office. C/ Castella, 33, esc. B, 3º-2. 08018 Barcelona. Spain 2
Abstract Pinus brutia occurs in the Eastern Mediterranean region and is the most widespread conifer species in Middle East. It is important for multi-purpose forestry owing to its high ecological value and economic importance. To model the stand dynamics of P. brutia, 133 semi-permanent sample plots were placed in 10 to 166 year-old stands in Syria and Lebanon, covering the whole range of variation in site quality, stand age and stand density. Site index, distanceindependent diameter increment, height and self-thinning models that included country effects were fitted to the data. The site index model was fitted using the guide curve method. The data for 10-year diameter growth model consisted of past growth measurements of all trees within the 133 plots. Diameter growth was modelled using variables representing site, size and competition. The self-thinning model was developed by estimating the maximum number of trees per hectare as a function of mean diameter and site index. These are the first cross-border models in Middle East enabling forest growth and yield predictions and stand dynamics simulations on an individual-tree basis. Such models will allow, with the aid of optimization techniques, finding the optimal management for P. brutia forests based on different management objectives. Key words: individual-tree model; stand dynamics; global change; Mediterranean forestry; Syria; Lebanon.
Resumen Modelos para simular el desarrollo de masas regulares de Pinus brutia en Oriente Próximo El área de distribución natural de Pinus brutia se circunscribe principalmente al Mediterráneo oriental, siendo la conífera más extendida en Oriente Próximo. Se trata de una especie de gran importancia para la gestión forestal multiobjetivo debido a su alto valor ecológico y a su importancia económica. Dada la escasez de información científica existente sobre su dinámica en Oriente Próximo, se midió 133 parcelas de inventario semipermanentes en masas de P. brutia de entre 10 y 166 años en Siria y Líbano. Las parcelas se establecieron de tal manera que abarcaran todo el rango de variabilidad de calidades de sitio, de edades y de densidades de la masa. Se ajustaron modelos de índice de sitio, altura, autoclara e incremento en diámetro que incluyeron el efecto país. El modelo de índice de sitio fue obtenido mediante el método de la curva guía. Los datos utilizados en el modelo de incremento en diámetro consistieron en mediciones de los dos últimos períodos de crecimiento de 10 años, utilizando para ello todos los árboles de las 133 parcelas. Dicho modelo se ajustó utilizando variables relacionadas con la calidad de sitio, el tamaño del árbol y la competencia. El modelo de autoclara fue ajustado estimando el número máximo de árboles por hectárea en función del diámetro medio y del índice de sitio. Este conjunto de ecuaciones constituye los primeros modelos transfronterizos en Oriente Próximo, y permiten simular y predecir el crecimiento y la producción de las masas de P. brutia a partir de información obtenida a escala de árbol individual. Dichos modelos, combinados con técnicas de optimización, permitirán optimizar la gestión de los bosques de P. brutia para diferentes objetivos de planificación. Palabras clave: modelos de árbol individual; dinámica forestal; cambio climático; Mediterráneo; Siria; Líbano. * Corresponding author:
[email protected] Received: 12-09-10; Accepted: 23-11-10.
450
S. de-Miguel et al. / Forest Systems (2010) 19(3), 449-457
Introduction Pinus brutia Ten. subsp. brutia occurs naturally mainly in the Eastern Mediterranean region covering extensive areas in Turkey, Greece, Cyprus, Lebanon and Syria. In Middle East it is the main forest species and the most widespread conifer. P. brutia grows naturally from 0 up to 1,600 meters above sea level and thrives in Mediterranean climate characterised by hot and dry summers and mild and rainy winters. It is generally found in thermo-Mediterranean and mesoMediterranean zones. However, the optimal development of the species seems to be within the Eu-Mediterranean altitudinal zone, below 800 meters above sea level (Fontaine et al., 2007). The mean rainfall in the natural distribution area of P. brutia fluctuates between 400 mm and 2000 mm. The mean annual temperature varies between 10-12°C and 20-25°C and the absolute mean minimum temperature ranges from –11-(–5)°C to 4-10°C (Fady et al., 2003; Boydak, 2004; Boydak et al., 2006). In Middle East, most P. brutia forests are found in the humid, sub-humid and semi-arid bioclimatic zones (Nahal, 1983; Quézel, 1985). P. brutia forests are important for multi-purpose forestry and have a high ecological value (Panetsos, 1985). They are of high economic importance and are the only or the main source of wood in several East-Mediterranean countries (Fady et al., 2003). Furthermore, P. brutia forests have a key role in providing important environmental services such as protection of soil and water resources, conservation of biological diversity, support to agricultural productivity, carbon sequestration, climate change mitigation and adaptation, and combating desertification (Fischer et al., 2008). In view of the importance of this species, there is a need for a consistent system of growth and yield predictions to support multi-purpose forest management and planning in the region. Individual-tree growth modelling enables flexible and detailed simulations of the complex structures of Mediterranean forests and their dynamics. Palahí et al. (2008) developed growth and yield models for P. brutia in North-East Greece. Nevertheless, forest modelling and simulation techniques have been seldom applied in Middle East. In a previous research, Shater et al. (2010) fitted a set of growth and yield models for P. brutia stands in Syria. However, as the sample size in that study was not very large, additional data collected in Lebanon enable fitting models that better cover the range of natural
distribution of P. brutia in Middle East, and have a higher statistical significance. The aim of this research paper was to develop a system of models allowing the simulation of P. brutia stand dynamics in Middle East. The model set consisted of a site index, individual-tree diameter increment, height and self-thinning models, including country effects. An attempt was also made to simulate the effect of future changes in site quality on the productivity of P. brutia.
Materials and methods Data 133 plots were measured throughout the natural distribution area of P. brutia in Syria (83 plots) and Lebanon (50 plots). The sample plots were selected so as to capture the whole range of variation in site, stand age and stand density. The sample plots were circular. The plot radius varied depending on the stand density. Around 75 trees were measured in most plots. The following variables were measured for each tree: diameter at breast height (dbh) and radial growth of one or two past 10-year periods. Therefore, an additional criterion for selecting inventory plots was the absence of any forestry operations within or just before the measured past growth period (20 years). Tree height and bark thickness were measured for 10-11 sample trees, and age was measured for 5 dominant trees. The following additional variables describing site characteristics were recorded in each plot: altitude, slope, aspect, average soil depth (5 measurements in different parts of the plot, one in the plot centre and 4 around it) and UTM coordinates of the plot centre. During the data preparation process, additional stand and tree level variables (i.e. stand basal area, basal area of trees larger than the object tree) were calculated for every plot. Several transformations of the tree and stand level variables were also computed. Two plot-wise models were fitted to calculate the height and bark thickness of those trees for which these variables had not been measured in the field. Backdating (Hann and Hanus, 2001; Bravo et al., 2008) was used to calculate tree and stand variables at the beginning of the two past 10-year growth periods assuming that the bark thickness-dbh and height-dbh relationships remain constant along time. More detailed information concerning the backdating procedure can be found in Shater et al. (2010).
Growth of Pinus brutia in Middle East
451
Afterwards, the site index, diameter-increment, height and self-thinning models were fitted using the SPSS software (SPSS Inc., 2008). In nonlinear regression modelling, the modified Levenberg-Marquardt algorithm (Moré, 1977) was utilized to solve the objective function. As the Lebanese and Syrian P. brutia distribution areas are not connected, between-country variation may exist due to differences in site quality (i.e. topography, soil type and climate conditions) and/or historical reasons. Thus, country effects were included in the statistical analysis of every model by using indicator variables.
Strand (Strand, 1964), Richards-Chapman (Mitscherlich, 1919), Schumacher (Schumacher, 1939), Gompertz (cited by Winsor, 1932), Weber (Weber, 1891) and Weibull II (Weibull, 1951) were fitted in nonlinear regression analysis when searching a suitable site index model. The selection of the candidate equations was based on previous experience of the authors on this species, and an aim of having equations from several families of functions. The index age (50 years) used for calculating site index was the rotation period which maximizes wood production according to Shater et al. (2010).
Site index
Diameter increment
The ages and dominant heights calculated for 125 plots were used to fit a model for dominant height development (Table 1). The dominant height was defined as the mean of the total height of 100 thickest trees per hectare. Eight plots representing very old stands on poor sites were not used in this analysis because of lacking data from very old stands on good sites. Since only one measurement of dominant height was available from each plot, the site quality was assessed by using the guide curve method in order to generate anamorphic site index curves (Clutter et al., 1983). Several functions among those compiled by Kiviste et al. (2002) such as Hossfeld I, Hossfeld I modified, Hossfeld III, Hosfeld IV and Smalian (cited by Peschel, 1938),
The data set used for diameter increment modelling (Table 1) included 16,821 observations. The purpose was to develop a model for the future 10-year diameter increment (id10). Linear regression analysis is a suitable tool for modelling growth dynamics if a linear relationship among the key variables and biologically logical models are found. However, since tree growth dynamics are intrinsically nonlinear, logarithmic transformations are needed with a consequence that correction factors are necessary to avoid bias when applying the models (Baskerville, 1972; Snowdon, 1991). To avoid correction factors, ordinary least squares (OLS) linear regression was utilized only to help in the selection of predictors and to get suitable starting values for re-
Table 1. Summary of the data used to model site index, diameter increment, height and self-thinning Site index, 125 obs.
Variable
Stand age, years Dominant height, m Altitude, m Slope, % Soil depth, cm Site index, m No. of trees per hectare Stand basal area, m2/ha Dbh, cm BAL, m2/ha Diameter increment, cm/10 yrs Tree height, m Dominant diameter, m Mean diameter, cm
Diameter increment, 16,821 obs.
Min.
Mean
Max.
Min.
Mean
10.0 4.6 — — — 8. 6 — — — —
50.5 15.5 — — — 15.4 — — — —
99.8 33.3 — — — 28.1 — — — —
4.0 1.8 47.0 0.0 0.0 8.6 136.8 0.1 0.1 0.0
37.6 156.2 14.5 29.7 671 1,283.0 29.4 75.0 28.1 200.0 15.4 28.1 860.7 3,229.5 21.3 69.9 18.0 95.7 14.3 69.8
— — — —
— — — —
— — — —
0.0 — — —
4.1 — — —
Max.
Height, 1,283 obs.
Self-thinning, 40 obs.
Min.
Mean
Max.
Min.
Mean
Max.
— 8.3 — — — — — — 5.0 —
— 15.6 — — — — — — 27.3 —
— 29.1 — — — — — — 96.9 —
— — — —
— — — —
— — — —
30.7 — — 3.5 — 15.0 — —
— 13.7 35.5 —
— 35.1 61.5 —
8.6 16.0 28.1 412.5 1,157.7 3,229.5 — — — — — — — — — — — — 11.1
— — — 24.2
— — — 44.1
452
S. de-Miguel et al. / Forest Systems (2010) 19(3), 449-457
gression coefficients. Then, a model with non-logarithmic increment as the dependent variable was fitted using nonlinear regression analysis. Variables representing site quality, tree size and competition were considered as predictors (site index, diameter at breast height, basal area of trees larger than the subject tree, stand basal area, etc.). Different transformations of these variables were tested.
Height All height measurements of the plots (1,283 observations) were used to model tree height as a function of diameter at breast height, dominant height and dominant diameter (Table 1). The dominant diameter was defined as the mean diameter of 100 thickest trees per hectare. Several height-diameter equations based on Stoffels and Van Soest (1953) modified by Tomé (1989) were tested. The Stoffels and Van Soest power equation constrains the model so that it passes through the point determined by dominant diameter and dominant height. The height-diameter model was static and was fitted by using nonlinear regression analysis.
Self-thinning The plots were first divided into three site quality classes (good, medium and poor) according to site index. The plots that were assumed to be on the selfthinning limit were selected separately in each site index category. This resulted in 40 plots for modelling the self-thinning limit (Table 1). Since P. brutia stands are seldom thinned in Syria and Lebanon, many plots were at the self thinning limit, which could be verified in the field: dead, dying and weak trees were common in the densest plots. In accordance with the Reineke’s expression (Reineke, 1933) and the –3/2 power rule (Yoda et al., 1963), a log-log linear model was fitted between the number of trees per hectare in the 40 densest plots (Nmax) and the mean diameter (dn) by using OLS linear regression. Given that the intercept of the self-thinning line may vary according to site quality (Hynynen, 1993), the site index (SI) was also included as a predictor. As for the diameter increment model, the parameters obtained were utilized as starting values in nonlinear regression using untransformed Nmax as the dependent variable.
Model evaluation The following criteria were considered in model evaluation: a) agreement with current biological knowledge (value of the asymptote and growth pattern at young ages when compared to the modelling data), b) logical behaviour of the model set in extrapolations and long-term simulations, c) simplicity and robustness, d) statistical significance (p-value < 0.05) and non-biasness, and e) homocedasticity and normal distribution of residuals. Furthermore, a sensitivity analysis was carried out for the diameter increment model in order to assess the robustness of the estimation.
Use of the models in simulation considering changes in site quality Precipitation is the key driver influencing P. brutia growth (Sarris et al., 2007). Furthermore, Giorgi and Lionello (2007) have predicted a sharp reduction in rainfall between 1961-1980 and 2081-2100 in the Eastern Mediterranean region. In such a context, future changes in site quality for P. brutia leading to a reduction in site index might be expected. Based on the models presented in this study and with the sole purpose of showing how the models work together, a simulation on the effect of site index reduction on the rotation length and productivity was provided.
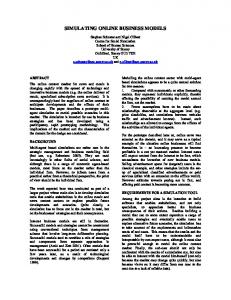
Results Dominant height model Among the tested dominant height models, Hossfeld IV showed the best behaviour according to statistical and biological criteria (Fig. 1):
Hdom =
T 2.522 [1] 52.766 + (0.055 + 0.01Lebanon) T 2.522
where Hdom is the guide curve value of dominant height (m), T is the stand age (years) and Lebanon is a dummy variable representing country effects (0 = Syria; 1 = Lebanon). Site index is the dominant height of the stand at an index age. The index age was taken as 50 years. Therefore, the site index (SI) of the stand can be calculated as follows (Clutter et al., 1983):
Growth of Pinus brutia in Middle East 30
30
25
25
25 Dominant height (m)
22
20 15 10
20
19 16
15
13
Site index (m)
35
Dominant height (m)
453
10
10
5 5
0 0
20
40
60 Age (years)
Hossfeld IV Syria Hossfeld IV Lebanon
80
100
120
Observations Syria Observations Lebanon
Figure 1. Dominant height development (guide curve) of P. brutia stands in Middle East (Hossfeld IV).
Hdom Hdom(50) [2] Hdom(T ) where Hdom is the measured dominant height of the stand of age T, Hdom(T) is the guide curve value for the same age, and Hdom(50) is the guide curve value for 50 years. The dominant height of a stand of age T and site index SI is calculated as follows: SI Hdom = Hdom(T ) [3] Hdom(50)
0 0
10
20
30 40 Age (years) Syria
50
60
70
Lebanon
Figure 2. Anamorphic site index curves for even-aged P. brutia stands in Syria and Lebanon, representing site index classes of 10, 13, 16, 19, 22 and 25 m (index age = 50 years).
SI =
Equation 3 was used to construct anamorphic site index curves separately for Syria and Lebanon (Fig. 2). Dominant height at the reference age is the quantification of the site index.
Diameter increment model The following model was selected for diameter increment: −0.391−(0.019−0.007 Lebanon) BAL+1.050 ln SI −0.125 G −0.083 d id10 = e [4] where i d10 is 10-year diameter increment (cm), G is stand basal area (m 2/ha), BAL is basal area of trees larger than the subject tree (m 2/ha), d is diameter at breast height (cm) and Lebanon is a dummy variable representing country effects (0 = Syria; 1 = Lebanon). The degree of explained variance (R2) was 0.422. The proportional reliability or Root Mean Square Error (RMSE) was 2.04. The bias was 0.002. In the above model, SI represents site quality, BAL and G represent competition and d represents tree size. The sensitivity
analysis (Fig. 3) showed that the model response is sensitive to site index, and not sensitive to the rest of predictors.
Height model The following model was fitted for tree height by using nonlinear regression analysis: d
⎛ d ⎞0.516−0.173Ddom h = Hdom ⎜ ⎟ ⎝ Ddom ⎠
[5]
where h is tree height (m), Hdom is stand dominant height (m), d is diameter at breast height (cm), and Ddom is dominant diameter (cm). The R2 of the model was 0.827, the RMSE was 2.15 and the bias was 0.073.
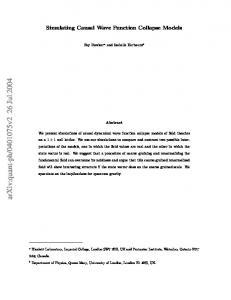
Self-thinning model The model for the self-thinning limit (Fig. 4) is as follows: 11.649−1.639lnDn +(0.026−0.016Lebanon) SI N max = e [6] where Nmax is the maximum possible number of trees per hectare and Dn is non-weighted mean diameter of trees (cm), SI is site index (m) and Lebanon is a dummy variable expressing country effects (0 = Syria; 1 = Lebanon). The R2 was 0.945. RMSE was 199.9 and bias was –4.181.
454
S. de-Miguel et al. / Forest Systems (2010) 19(3), 449-457 40
15
5
0 –10
0
10
–5
–10
Change in 10-year diameter increment (%)
Change in 10-year diameter increment (%)
30
10
20 10 0 –10
0
10
–10 –20 –30 –40 Change in regression coefficients (%)
–15 Change in predictors (%) d
G
SI
BAL
Figure 3. Sensitivity analysis depicting the rate of change (%) of the predicted 10-year diameter increment with ± 10% change in the predictors (above) and ± 10% change in the regression coefficients (below). The starting values for SI correspond to the average site index of the country (17.32 m in Syria and 14.76 m in Lebanon). The starting values of the other predictors are: BAL = 6 m2/ha, G = 20 m2/ha, and d = 20 cm.
Simulations Simulation allowed us to determine the mean annual increment (MAI) and the current annual increment (CAI) curves (Fig. 5). For this purpose, preliminary volume functions, not yet published, based on felled P. brutia trees were used to calculate stem volume. If 4,500 Maximum number of trees per hectare
4,000
wood production is maximized in the absence of thinning, the optimal rotation length is the age at which the MAI and CAI curves cross. According to the simulations, the optimal rotation length was about 50 years in an average-quality site. Site productivity, as described by the maximum MAI, was 4.5 m3/ha per year. The simulation of the scenario with a lower site index led to an increase of the optimal rotation length for maximizing wood production and a decrease of the mean annual wood production.
3,500
Discussion
3,000 2,500
Modelling 2,000 1,500 1,000 500 0 0
10
20 30 40 Non-weighted mean diameter (cm) SI = 22, Syria SI = 10, Syria
50
60
SI = 22, Lebanon SI = 10, Lebanon
Figure 4. Self-thinning limit for a good site (SI = 22 m) and a poor site (SI = 10 m) in Syria and Lebanon.
This study presents, for the first time, cross-border growth models for predicting the development of pure even-aged P. brutia stands in Middle East. The site index, diameter-increment and self-thinning models include an indicator variable that accounts for country effects. Fitting regional models with this kind of crossborder approach allowed us to increase the number of observations and the range of variation, as compared to country-specific data, resulting in more significant equations than those obtained previously by Shater et al. (2010) in Syria. Nevertheless, the set of models
Growth of Pinus brutia in Middle East
455
6 Increase in rotation length
Decrease in site productivity
Annual growth (m3/ha)
5
4
3
2
1
0 0
20
40
60 Age (years)
MAI in current Site Index scenario MAI in reduced Site Index scenario
80
100
120
CAI in current Site Index scenario CAI in reduced Site Index scenario
Figure 5. Simulation of mean annual increment (MAI) and current annual increment (CAI) curves showing the effects of a reduction in site index on rotation length and site productivity.
should be used with caution beyond the ranges specified in Table 1. The dominant height development is s-shaped and it almost reaches the asymptote when the stand is about 50 years old. The diameter increment is higher in younger trees (low diameters) and it gradually decreases as the diameter increases. When comparing these results with those obtained in Greece by Palahí et al. (2008) some differences arise. Whereas in Middle East height growth almost stops at 40-50 years, in NorthEast Greece the site index curves are more linear, they show faster growth than the model for Middle East at young ages, and the dominant height continues growing even after 100 years. This can be due to the lack of data from young stands in Greece, making it difficult to fit a better model for the initial dominant height development. Additionally, different regeneration methods could also explain these differences since, as a whole, P. brutia stands in Middle East seem to be rather evenaged (possibly regenerated after hard disturbances such as wild fires simulating a clear-cut method), whereas some stands in Greece apparently were not strictly even-aged. Regarding diameter increment predictions,
this reasoning could also partly explain why the stands inventoried in Middle East presented the highest increments during the initial development phases, whereas in North-East Greece radial growth was lower in trees with diameters below 15 cm. Furthermore, the negative effect of competition on diameter increment was also observed by Carus (2005) for even-aged P. brutia stands in South-West Turkey. The country effects show that the average dominant height development is slightly lower in Lebanon than in Syria (Fig. 1). When predicting 10-year diameter growth, the basal area of larger trees has smaller effect in Lebanon than in Syria (Fig. 3). Regarding the selfthinning model, site index has less influence on the maximum number of trees per hectare in Lebanon than in Syria (Fig. 4). Such between-country variations are probably related to historical uses affecting stand structure and to differences in site conditions. Wood harvesting from P. brutia forests was allowed in Lebanon until 1991 whereas, in Syria, harvesting activities seem to have been stopped much earlier, resulting in more homogeneous and even-aged stand structures in Syria. These differences could be verified from the data sets
456
S. de-Miguel et al. / Forest Systems (2010) 19(3), 449-457
of the current study. Although no thinning or harvesting had been done within the measured past growth periods (up to 20 years), older forestry operations might have led to a more heterogeneous stand structures in Lebanon. Notwithstanding, the variation in dominant height could be also influenced by differences in site quality due to the fact that, in Lebanon, P. brutia is at the southern limit of its natural distribution area and, consequently, somewhat more arid conditions may negatively affect site index. Under these assumptions, the country effects of the models become logical. Hdom is slightly lower in Lebanon due to poorer average site quality and the possibility that some dominant trees had been removed in thinnings. BAL has less influence on the radial growth in Lebanon possibly because of greater sampling error in BAL due to the heterogeneity of the Lebanese stands. Similarly, the effect of SI on the maximum number of trees per hectare is smaller in Lebanon for the reason that the Lebanese stands are less homogeneous and the ability of the SIs calculated for the plots to describe true site quality is lower in Lebanon than in Syria. When modelling tree height, no country-specific effect was found. This suggests that the relationship between dominant height, dominant diameter and diameter at breast height remains more or less constant for P. brutia in Middle East. The predicted optimal rotation length in medium sites (around 50 years) coupled with the sharp diminution of the density of living trees when tree diameter increases, reflects the ecology of a fast growing pioneer species as several authors stated (Gezer, 1985; Richardson, 1998; Awada et al., 2003; Boydak, 2004; Boydak et al., 2006).
Link with global change As mentioned above, P. brutia is a key species in the Mediterranean, especially in Middle East, when facing climate change. Its ability of withstanding aridity and continentality and of regenerating after wild f ires makes it an irreplaceable forest species in fragile Mediterranean ecosystems (Fischer et al., 2008). The models presented in this study were used in simulation to demonstrate how they work together in growth and yield prediction considering a reduction in site index (Fig. 5). Since site index was as a strong predictor of diameter increment and affected also self-thinning, variations in site quality can be simulated in order to analyse their impact on stand dynamics. The results
showed that a hypothetical decrease in site index leads to a diminution in annual growth and yield and to longer optimal rotation lengths. Such effects may imply considerable changes in forest management schedules and must be taken into account when dealing with longterm forest planning and decision-making. However, accurate long-term predictions require further research in order to examine the effects of rainfall and temperature on site quality and on tree growth and survival. Moreover, concerning global change mitigation through carbon sequestration, the models presented in this study can be used in combination with taper equations and biomass models for predicting assortment volumes and for proposing optimal management schedules to maximize carbon sequestration by considering products’ lifespan.
Acknowledgments This study has been supported by the Spanish Agency for International Development Cooperation (Agencia Española de Cooperación Internacional para el Desarrollo, AECID) and Fundación Biodiversidad. The authors wish to thank the Government of Lebanon (Ministry of Environment) and the Government of Syria (Ministry of Agriculture) for the precious collaboration.
References AWADA T., RADOGLOU K., FOTELLI M.N., CONSTANTINIDOU H.I.A., 2003. Ecophysiology of seedlings of three Mediterranean pine species in contrasting light regimes. Tree Physiol 23, 33-41. BASKERVILLE G.L., 1972. Use of logarithmic regression in the estimation of plant biomass. Can J For Res 2, 49-53. BOYDAK M., 2004. Silvicultural characteristics and natural regeneration of Pinus brutia Ten. – a review. Plant Ecol 171, 153-163. BOYDAK M., DIRIK H., ÇALIKOG˘ LU M., 2006. Biology and Silviculture of Turkish Red Pine (Pinus brutia Ten.). Ormancılıg˘ı Gelis¸tirme ve Orman Yangınları ile Mücadele Hizmetlerini Destekleme Vakfı Yayını, Lazer Ofset Matbaası, Ankara, Turkey. 253 pp. BRAVO F., PANDO V., ORDÓÑEZ V., LIZARRALDE I., 2008. Modelling ingrowth in Mediterranean pine forests: a case study from Scots pine (Pinus sylvestris L.) and Mediterranean maritime pine (Pinus pinaster Ait.) stands in Spain. Invest Agr: Sist Rec For 17(3), 250-260. CARUS S., 2005. A diameter increment model for Crimean pine (Pinus nigra Arnold) and Calabrian pine (Pinus bru-
Growth of Pinus brutia in Middle East tia Ten.) stands in Isparta region, Turkey. J Environ Biol 26(3), 467-473. CLUTTER J.L., FORSTON J.C., PIENNAR L.V., BRISTER G.H., BAILEY R.L., 1983. Timber management – a quantitative approach. Willey, New York. 333 pp. FADY B., SEMERCI H., VENDRAMIN G.G., 2003. EUFORGEN Technical Guidelines for genetic conservation and use for Aleppo pine (Pinus halepensis) and Brutia pine (Pinus brutia). International Plant Genetic Resources Institute, Rome, Italy. 6 pp. FISCHER R., LORENZ M., KÖHL M., BECHER G., GRANKE O., CHRISTOU A., 2008. The condition of forests in Europe: 2008 executive report. United Nations Economic Commission for Europe, Convention on Longrange Transboundary Air Pollution, International Co-operative Programme on Assessment and Monitoring of Air Pollution Effects on Forests (ICP Forests). 23 pp. FONTAINE M., AERTS R., ÖZKAN K., MERT A., GÜLSOY S., SÜEL H., WAELKENS M., MUYS B., 2007. Elevation and exposition rather than soil types determine communities and site suitability in Mediterranean mountain forests of southern Anatolia, Turkey. For Ecol Manage 247, 18-25. GEZER A., 1985. The sylviculture of Pinus brutia in Turkey. In: CIHEAM, le pin d’Alep et le pin brutia dans la sylviculture méditerranéenne. Options Méditerranéennes, Série Etudes, Paris, 86(1), 55-66. GIORGI F., LIONELLO P., 2008. Climate change projections for the Mediterranean region. Global Planet Change 63, 90-104. HANN D.W., HANUS M.L., 2001. Enhanced mortality equations for trees in the mixed conifer zone of southwest Oregon. For Res Lab Res, Contr. 17. Oregon, State University. 34 pp. HYNYNEN J., 1993. Self-thinning models for even-aged stands of Pinus sylvestris, Picea abies and Betula pendula. Scand J Forest Res 8, 326-336. KIVISTE A.K., ÁLVAREZ-GONZÁLEZ J.G., ROJO A., RUIZ A.D., 2002. Funciones de crecimiento de aplicación en el ámbito forestal, Monografía INIA: Forestal nº 4, Ministerio de Ciencia y Tecnología, Instituto Nacional de Investigación y Tecnología Agraria y Alimentaria, Madrid. MITSCHERLICH E.A., 1919. Das gesetz des pflanzenwachstums. Landwirtschaftliche jahrbucher 53, 167-182. MORÉ J.J., 1977. The Levenberg-Marquardt algorithm: implementation and theory in numerical analysis. In: Lecture notes in mathematics (Watson G.A., ed). Berlin, Springer-Verlag. NAHAL I., 1983. Le pin brutia (Pinus brutia Ten. subsp. brutia), Première partie. Forêt Méditerranéenne 5(2), 165-172. PALAHÍ M., PUKKALA T., KASIMIADIS D., POIRAZIDIS K., PAPAGEORGIOU A.C., 2008. Modelling site quality
457
and individual-tree growth in pure and mixed Pinus brutia stands in north-east Greece. Ann For Sci 65(5). doi: 10.1051/forest:2008022. PANETSOS K.P., 1985. Genetics and breeding in the group halepensis. In: CIHEAM, le pin d’Alep et le pin brutia dans la sylviculture méditerranéenne. Options Méditerranéennes, Série Etudes, Paris, 86(1), 81-88. PESCHEL W., 1938. Die mathematischen methoden zur herleitung der wachstumsgesetze von baum und bestand und die ergebnisse ihrer anwendung. Tharandter Forstliches Jahrburch 89, 169-247. QUÉZEL P., 1985. Les pins du groupe halepensis - Ecologie, végétation, ecophysiologie. In: CIHEAM, Le pin d’Alep et le pin brutia dans la sylviculture méditerranéenne. Options Méditerranéennes, Série Etudes, Paris, 86(1), 11-66. REINEKE L.H., 1933. Perfecting a stand-density index for even-aged forests. Journal of Agricultural Research 46, 627-638. RICHARDSON D.M., 1998. Ecology and biogeography of Pinus. Cambridge University Press, Cambridge. 527 pp. SARRIS D., CHRISTODOULAKIS D., KÖRNER C., 2007. Recent decline in precipitation and tree growth in the eastern Mediterranean. Glob Change Biol 13, 1187-1200. SCHUMACHER F.X., 1939. A new growth curve and its application to timber yield studies. J Forest 37, 819-820. SHATER Z., DE-MIGUEL S., KRAID B., PUKKALA T., PALAHI M., 2010. A growth and yield model for evenaged Pinus brutia stands in Syria. Ann For Sci. [In press]. SNOWDON P., 1991. A ratio estimator for bias correction in logarithmic regressions. Can J For Res 21, 720-724. SPSS Inc, 2008. SPSS Base system syntax reference Guide. Release 17.0.1. STOFFELS A., VAN SOEST J., 1953. The main problems in sample plots. Ned Boschb Tijdschr 25, 190-199 STRAND L., 1964. Numerical constructions of site-index curves. For Sci 10 (4), 410-414. TOMÉ M., 1989. Modelação do crescimiento da árvore individual em povoamentos de Eucalyptus globulus Labill. (1ª Rotação). Região Centro de Portugal. Ph D thesis, ISA, Lisbon. WEBER R., 1891. Lehrbuch der forsteinrichtung mit besonderer berücksichtigung der zuwachsgesetze der waldbaüme. Springer-Verlag. 440 pp. WEIBULL W., 1951. A statistical distribution function of wide applicability. J Applied Mechanics 18(3), 293-297. WINSOR C.P., 1932. The Gompertz curve as a growth curve. Proc Nat Acad Sci 18, 1-8. YODA K., KIRA T., OGAWA H., HOZUMI K., 1963. Selfthinning in overcrowded pure stands under cultivated and natural conditions. Journal of Biology, Osaka City Univ 14, 107-129.