Monitoring Aggregate k-NN Objects in Road Networks Lu Qin1 , Jeffrey Xu Yu1 , Bolin Ding1 and Yoshiharu Ishikawa2 1
The Chinese University of Hong Kong, China, {lqin,yu,blding}@se.cuhk.edu.hk 2 Nagoya University, Japan,
[email protected]
Abstract. In recent years, there is an increasing need to monitor k nearest neighbor (k-NN) in a road network. There are existing solutions on either monitoring k-NN objects from a single query point over a road network, or computing the snapshot k-NN objects over a road network to minimize an aggregate distance function with respect to multiple query points. In this paper, we study a new problem that is to monitor k-NN objects over a road network from multiple query points to minimize an aggregate distance function with respect to the multiple query points. We call it a continuous aggregate k-NN (CANN) query. We propose a new approach that can significantly reduce the cost of computing network distances when monitoring aggregate k-NN objects on road networks. We conducted extensive experimental studies and confirmed the efficiency of our algorithms.
1 Introduction With the development of positioning technologies such as the Global Positioning System (GPS), many applications are developed in transportation domains by taking advantages of monitoring object movements in road networks where the position and distance of objects are constrained by spatial networks. An important type of these queries is a k nearest neighbor (k-NN) query, which is widely used in location-based services, traffic monitoring, emergency management. Existing solutions focused on either monitoring k-NN objects over a road network from a single query point (observation point) [1], or computing the snapshot k-NN objects over a road network to minimize an aggregate distance function with respect to the multiple query points [2]. In this paper, we study a new problem that is to monitor k-NN objects over a road network from multiple query points to minimize an aggregate distance function with respect to multiple query points. We call it a continuous aggregate k-NN (CANN) query. In brief, it deals with the network distance instead of Euclidean distance, and it monitors the top-k objects, where an object is ranked based on an aggregate function value of the distances between the object and multiple query points. As an example, consider people in n companies/organizations need to schedule meetings in downtown frequently. The room availabilities in hotels and restaurants is monitored, and the best place is selected to reduce the total travel time for people to meet. The main difficulties for processing CANN query are as follows. First, when there are a large number of objects in the road network or there are a large number of CANN queries, the cost of computing network distances becomes the bottleneck. Second, an object is ranked in the road network based on an aggregate function value in terms
2
Lu Qin and Jeffrey Xu Yu, Bolin Ding, Yoshiharu Ishikawa n1
q1(15) e1(30) n3
p1(10) e2(30) n2
p5(15) p2(20)
q3(40)
n4
e4(80) p4(35) q2(50)
p3(70)
e3(120)
e6(30)
n5
e5(30) p6(20) n6
Fig. 1. Road Network
of the network distances to a set of query points. Unlike computing a CANN query for a single query point in the road network where the order of visiting edges can be determined using an expansion tree from the query point, computing the CANN query from multiple query points makes it difficult to find an order of visiting edges. The main contributions of this paper are summarized below. (1) We study a new problem of processing the continuous aggregate nearest neighbor queries (CANN) over large road network. To the best of our knowledge, this is the first attempt to study this problem. (2) We propose new approaches that do not need to expand tree to compute CANN queries. Our approach can reduce the cost of computing network distances significantly. (3) We conducted extensive performance studies, and confirmed the efficiency of our new approaches. The rest of the paper is organized as follows. Section 2 gives the problem statement. Section 3 introduces two existing solutions. Section 4.2 discusses our new approaches followed by discussions on implementations in Section 5. Section 6 shows our experimental results. The related work is given in Section 7. Finally, Section 8 concludes this paper.
2 Problem Definition Road Network is an undirected weighted connected graph, G(V, E), where V is a set of nodes (road intersections), and E is a set of edges (roads). An edge, e ∈ E, connects two nodes ni and nj . A positive number, len(e), denotes the length of the edge e. (Data or Query) points lie on edges of road network G. We use pose (p) to denote the position of a point p on e = (ni , nj ) by the distance from point p to node ni on edge e, provided i < j. Network Distance: For two nodes ni , nj ∈ V , the network distance d(ni , nj ) is the length of the shortest path between ni and nj in the road network. The network distance between a point, p that lies on the edge e = (ni , nj ), and a node, nk , is computed as d(p, nk ) = min{pose (p) + d(ni , nk ), (len(e) − pose (p)) + d(nj , nk )}. For any two data points p and p0 , if p and p0 are on different edges, their network distance is computed as d(p, p0 ) = min{pose (p) + d(p0 , ni ), (len(e) − pose (p)) + d(p0 , nj )}. Otherwise, d(p, p0 ) is min {|pose (p) − pose (p0 )|, pose (p) + d(p0 , ni ), (len(e) − pose (p)) + d(p0 , nj )}. Figure 1 shows a simple road network. There are 6 nodes and 6 edges. The number in the brackets under each edge ei denotes its length (len(ei )). For instance, e4 is the
Monitoring Aggregate k-NN Objects in Road Networks
3
edge that connects nodes n3 and n4 , and the length of e4 is len(e4 ) = 80. In Figure 1, a data point is indicated by a cross. The position of a data point is marked in the brackets above it. For instance, p3 lies on edge e3 , and its position is pose3 (p3 ) = 70. The network distance between two nodes, n1 and n6 , is d(n1 , n6 ) = 30+80+30 = 140, along the shortest path e1 → e4 → e6 , the network distance between data point p3 and node n4 is d(p3 , n4 ) = min{pose3 (p3 ) + d(n2 , n4 ), (len(e3 ) − pose3 (p3 )) + d(n6 , n4 )} = min{70 + 110, 50 + 30} = 80, and the network distance between two data points, p3 and p2 , that are on two different edges e3 and e4 , is d(p3 , p2 ) = min{pose3 (p3 ) + d(n2 , p2 ), (len(e3 ) − pose3 (p3 )) + d(n6 , p2 )} = min{70 + 50, 50 + 90} = 120. Problem Statement (CANN Query): Given a road network G(V, E) and the set of data points (moving objects) P = {p1 , p2 , · · · } over G(V, E). A continuous aggregate nearest neighbor query is denoted as CANN(Q, k, h), where Q = {q1 , q2 , · · · } is a set of fixed query points over G(V, E), k is a positive number (> 0), and h is an aggregate function (sum, min, max). Here, for a data point, pi ∈ P , h(pi ) = h{d(pi , q1 ), d(pi , q2 ), · · · , d(pi , q|Q| )}, regarding the query points Q. The CANN (Q, k, h) query is to monitor the top-k data points in P that has the smallest h function values while all data points are moving. Consider a CANN(Q, k, sum) where Q = {q1 , q2 , q3 }, k = 3 against G(V, E) (Figure 1). Here, sum(p1 ) = sum{d(p1 , q1 ), d(p1 , q2 ), d(p1 , q3 )} = 35 + 60 + 60 = 155, sum(p2 ) = 155, sum(p3 ) = 255, sum(p4 ) = 200, sum(p5 ) = 280, and sum(p6 ) = 255. The top-3 result is {p1 , p2 , p4 }.
3 Existing Solutions While many recent researches have focused on continuous monitoring of nearest neighbors over dynamic objects, we first propose the solution for CANN query in road networks. Mouratidis et al.’s work in [1] is the one closest to ours. They gave two algorithms, IMA and GMA, to process continuous nearest neighbor queries over a road network, when there is a single query point, i.e., CANN(Q, k, h) where |Q| = 1 (a special case of CANN). The incremental monitoring algorithm (IMA) retrieves the initial top-k data points using the shortest path expansion tree of the query point for a single CANN query. The group monitoring algorithm (GMA) groups multiple CANN queries that lie on the same edge, as a group, to process them together, based on IMA. IMA keeps expanding the tree and updating the top-k result until the next edge to be expanded has minimal distance that is no less than the kth distance in the current result. When data points move, the result for the query is maintained by incrementally expanding or shrinking the expansion tree. Figure 2 shows an example to explain the expansion tree for CANN({q3 }, k, sum), where k = 3. Assume the current top-3 result is {p1 , p2 , p5 }, and the edges (called partial edges) that may partially affect the new top-3 results when data points move are P = {e1 , e2 , e5 , e6 }. Suppose the data point p1 moves out of the partial edges. IMA needs to expand the expansion tree from nodes n3 and n4 and retrieve all the data points on the edges in P to obtain the new top-k result {p2 , p4 , p5 }. In summary, when data
4
Lu Qin and Jeffrey Xu Yu, Bolin Ding, Yoshiharu Ishikawa n5
n1 p5(15) e1(30) p1(10)
p2(20)
n3
q3(40)
n4
e5(30)
e4(80) e2(30)
n2
e6(30)
p3 (70)
p4(35)
n6
e3(120)
Fig. 2. Expansion tree and partial Edges 235
130
q2
205 q1
f e4,q(x)
ge (x)
135
q3 0
175
4
80
0
40 50 x=pose4(p)
x=pose4(p)
(a) Single source edge functions 130
80
(b) Sum 130 100 80 ge4(x)
g e4 (x) 40 27.5 15 0
12.5
40 x=pose4(p)
80
0
(c) Min
50 x=pose4(p)
80
(d) Max
Fig. 3. Edge functions on e4
points move, IMA does not need to recompute the result from scratch, for a CANN query, but it needs to retrieve the data points, that lie on the partial edges, which is time consuming. In this paper, we propose a new approach that does not need to use an expansion tree for CANN, and allows multiple query points in one CANN query.
4 A New Non-Tree-Expanding Approach The high online processing cost for CANN queries dues to the frequent update of the expansion tree. In this paper, we propose a new approach that does not need an expansion tree. In brief, for a new CANN(Q, k, h) query registered, we construct a query graph, GQ (VQ , EQ ), based on CANN and the road network G. The query graph, GQ (VQ , EQ ), is static when processing CANN(Q, k, h) (no update is needed). It facilitates computing the value of aggregate function h(p), for a data point p ∈ P . With the assistance of query graph GQ , we can efficiently monitor the top-k results, when the data points move.
Monitoring Aggregate k-NN Objects in Road Networks
5
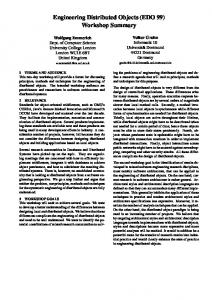
4.1 Query Graph Construction The query graph GQ (VQ , EQ ) facilitates computing the value of aggregate function h(p) in CANN(Q, k, h), for a data point, p ∈ P . We require that, given the position of p on edge e, pose (p), the value of aggregate function h(p) can be computed efficiently. We first discuss the relationship between the distance function d(q, p) / the aggregate function h(p) and the position of p. Distance function w.r.t. pose (p): Consider a data point p on an edge e = (ni , nj ) in GQ , and a query point q ∈ Q. The distance d(p, q) between q and p can be specified as a function of pose (p), denoted as fe,q : fe,q (pose (p)) = d(p, q). We note that function fe,q (·) is a continuous piecewise-linear function in the domain [0, len(e)]. We discuss the main idea behind fe,q (pose (p)) followed by the discussion on how to compute it. An example is illustrated in Figure 3(a) over the road network G (Figure 1). Take the edge e4 = (n3 , n4 ) in G as an example. Its three functions, fe4 ,q1 (pose4 (p)), fe4 ,q2 (pose4 (p)), and fe4 ,q3 (pose4 (p)), for three different query points, q1 , q2 , and q3 , are shown in Figure 3(a). Note: on x-axis, [0, len(e4 )], is pose4 (p), the distance from n3 . The curve of fe4 ,q1 (pose4 (p)) suggests that the shortest distance between q1 and any data points p on e4 should first go to the end node n3 of e4 , and then go to p. The curve of fe4 ,q2 (pose4 (p)) suggests that the shortest distance between q2 and any data points p on e4 may come from two different ends of e4 (from either n3 or n4 ). When the data point p is on the left side of [0, len(e4 )] before the peak value of fe4 ,q2 (pose4 (p)), the shortest distance between q2 and p should come from the end of n3 ; when the data point p is on the right side of [0, len(e4 )] after the peak value of fe4 ,q2 (pose4 (p)), the shortest distance between q2 and p should come from the end of n4 . Function fe,q (pose (p)) can be computed as follows. Assume e = (ni , nj ), where i < j. With Dijkstra’s single-source shortest-path algorithm, we obtain the shortest distance from q to every node in G. There are two cases. i) q is not on edge e: If |d(q, ni ) − d(q, nj )| = len(e), fe,q (pose (p)) is a 1-piece linear function of pose (p) ∈ [0, len(e)]. In this case, its 1-piece segment is (0, fe,q (0))(len(e), fe,q (len(e))), where fe,q (0) = d(q, ni ) and fe,q (len(e)) = d(q, nj ). Otherwise, fe,q (pose (p)) is a 2-piece linear function, and its two linear segments are (0, d(q, ni ))(x, y), and (x, y)-(len(e), d(q, nj )), where x and y are computed as follows. ( x= y=
d(q,nj )−d(q,ni )+len(e) 2 d(q,nj )+d(q,ni )+len(e) 2
(1)
ii) q is on edge e: Query point q split e into two parts, from ni to q and from q to nj respectively. Consider q as a node, function fe,q (pose (p)) on each part shares high similarity to case i), thus, we omit further explanation. The curve of fe4 ,q3 (pose4 (p)) shows such an example. But notice that function fe,q (pose (p)) of pose (p) ∈ [0, len(e)] may be a 3-piece linear function here. The 3-piece case happens only if q is on e. From above discussions, we have the following lemma. Lemma 1. fe,q (·) is a continuous piecewise-linear function with at most 3 linear pieces on domain [0, len(e)].
6
Lu Qin and Jeffrey Xu Yu, Bolin Ding, Yoshiharu Ishikawa
n5
n1 195
s1
q1 150
s2
325
q3
n3
175
q2
n2 165
s9
s8
135
s3 s4
n4
b2 205
s10
s 215 5 245
235
b1
b3 s6
s11
285
s12
n6
s7 265
Fig. 4. Query graph
Aggregate function w.r.t. pose (p): Since distance function fe,q (pose (p)) is a continuous piecewise-linear function of pose (p), given CANN(Q, k, h) and Q = {q1 , q2 , · · · }, the aggregate function value for any data point p on edge e, regarding all query points, can also be specified as a continuous piecewise-linear function of pose (p), denoted by ge (pose (p)) = h{fe,q1 (pose (p)), ..., fe,q|Q| (pose (p))}
(2)
for pose (p) ∈ [0, len(e)]. Since fe,q (·) has at most 3 linear pieces, ge (·) has at most O(|Q|) linear pieces. Lemma 2. ge (·) is a continuous piecewise-linear function with at most O(|Q|) linear pieces on domain [0, len(e)]. Reconsider the example in Figure 3(a) for the three query points, q1 , q2 , and q3 . The aggregate function on edge e4 for h = sum, min, and max, are shown in Figure 3(b), Figure 3(c), and Figure 3(d), respectively. Constructing the query graph GQ (VQ , EQ ): Given a CANN(Q, k, h) query over a road network G(V, E), we define a query graph, GQ (VQ , EQ ), to efficiently compute the value of h(p) given pose (p), the position of a data point p on edge e. The idea to construct GQ is to segment edges in G, such that aggregate function ge (·) w.r.t. pose (p) is a 1-piece linear function within each segment. Formally, suppose on an edge, e = (ni , nj ) in E, ge (·) is a z-piece linear function, then e needs to be segmented into a sequence of edges, (nk0 , nk1 ), (nk1 , nk2 ), · · · , (nkz−1 , nkz ), where ni = nk0 and nkz = nj , such that ge (·) is a 1-piece linear function on each segment [pose (nkl−1 ), pose (nkl )] (1 ≤ l ≤ z). All such nodes nkl , for 0 ≤ l ≤ z, will be included in VQ , and all the segmented edges (nkl−1 , nkl ), for 1 ≤ l ≤ z, will be included in EQ . If ge (·) is a 1-piece linear function, then there is no segmentation needed over an edge e = (ni , nj ) (ni , nj are included in VQ , and e is included in EQ ). We explain how to segment an edge using an example (Figure 3(b)), for a CANN(Q, k, h) where Q = {q1 , q2 , q3 }, and h = sum. Consider edge e4 = (n3 , n4 ), as shown in Figure 3(b), its aggregate edge function is a continuous 3-piece-segment linear function. Therefore, we add two new nodes into query graph GQ , denoted, nk1 and nk2 at position 40 and 50 on the x-axis as shown in Figure 3(b). Note: 40 and 50 are the distance from n3 . e4 = (n3 , n4 ) will be segmented into three edges, (n3 , nk1 ), (nk1 , nk2 ), and
Monitoring Aggregate k-NN Objects in Road Networks
7
Algorithm 1 IRC(Ci ) 1: Ci .top ← ∅; Ci .k ← +∞; 2: e ← head(Ci .E); 3: while e 6= ∅ and low(e) ≤ Ci .k do update Ci .top and Ci .k with data points on e; 4: 5: e ← next(Ci .E);
(nk2 , n4 ), in GQ . Each of the three edges is associated with a 1-piece linear aggregate function. It is important to note that in GQ (VQ , EQ ), every edge is associated with a 1-piece linear function (a piece of ge (·)). We can compute the value of the aggregate function for any data point in any edge with the help of GQ efficiently. Consider an edge (nkl−1 , nkl ) in GQ , which is an edge segment of an edge e in G. Let xl−1 = pose (nkl−1 ) and xl = pose (nkl ). Let yl−1 = ge (xl−1 ) and yl = ge (xl ) be the aggregate function values at nodes nkl−1 and nkl . When the position of a data point p, pose (p), is within [xl−1 , xl ], since ge (·) is a 1-piece linear function on [xl−1 , xl ], the aggregate function value at point p can be computed as: ge (pose (p)) = yl−1 +
(yl − yl−1 ) · (pose (p) − xl−1 ) . (xl − xl−1 )
(3)
Figure 4 shows a query graph, GQ (VQ , EQ ) over the road network G (Figure 1), for a CANN({q1 , q2 , q3 }, k, sum) query. There are totally 12 edges in GQ , and each of them is marked as si for 1 ≤ i ≤ 12. In addition to the original 6 nodes in G(V, E), nj , for 1 ≤ j ≤ 6, there are 6 nodes q1 – q3 (for the three query points), and b1 – b3 , which segment edges in E into linear pieces. The number below each node denotes the ge value. The relationship between the the aggregate edge functions and the two horizontal edges are illustrated in Figure 4. Lemma 3. The time complexity for the construction of query graph GQ (VQ , EQ ) is O((n · log n + m · log |Q|) · |Q|), where n = |V | and m = |E|, given graph G(V, E). Proof. For each query point q in Q, the complexity to find the distances from source q to every other node in G is O(n · log n + m). In sum, we need O((n · log(n) + m) · |Q|) time. Moreover, since ge (·) has at most O(|Q|) linear pieces (Lemma 2), |VQ | and |EQ | are both bounded by O(|Q| · m). To segment an edge e ∈ E into a sequence of edges in EQ , we need O(|Q| log |Q|) time (sort all the linear pieces and scan them). Therefore, the total time complexity is O((n · log n + m · log |Q|) · |Q|). 2 4.2 Basic Top-k Monitoring algorithm In this subsection, we introduce our basic algorithm to monitor the top-k result for a set of CANN queries, {C1 , C2 , · · · }, where Ci = CANN(Qi , ki , hi ), over a road network G with data point set P . For each query, Ci , the query graph is denoted as GQi (VQi , EQi ). Because of the property of query graphs we discussed in the previous subsection (recall Lemma 2), in
8
Lu Qin and Jeffrey Xu Yu, Bolin Ding, Yoshiharu Ishikawa s7 s6 s11 s12 s5 s10 s9 s4 s1 s8 s3 s2 130
p3 p5
p9
p6
p7 p8 p4 p2 influenced
p1
not influenced
180 C i .k
230
280
330
Fig. 5. Example for IRC and M T R
the following part, we can assume the aggregate function value at a given data point p w.r.t. query Ci can be computed in constant time (according to Equation (3)). All edges in EQi are sorted in the ascending order of the aggregate function lower bounds within the edges. The sorted edge list is denoted by Ci .E. A pointer is associated with the ordered list Ci .E, and four operations are defined: i) head(Ci .E) – set the pointer to the first edge in Ci .E and return this edge; ii) current(Ci .E) – return the edge pointed by the pointer currently; iii) next(Ci .E) – move the pointer to the next edge and return this edge (or return emptyset if the pointer points to the end of Ci .E); iv) prev(Ci .E) – move the pointer to the previous edge and return this edge. Initial Top-k Result Computation: The algorithm IRC (Algorithm 1) computes the top-ki data points for a query Ci . In line 1, Ci .top, used to keep the set of the top-ki data points for Ci , is initialized as empty; Ci .k, used to record the ki -th smallest aggregate value of the data points kept in Ci .top, is initialized as +∞. In line 2, head(Ci .E) returns the first edge in Ci .E. In the while statement (line 3-6), it computes the top-ki data points for Ci by scanning the ordered list Ci .E. In line 3, e 6= ∅ means Ci .E has not been scanned to the end yet, and low(e) denotes the aggregate function’s lower bound within the edge e. The case low(e) ≤ Ci .k, called edge e is influenced, indicates that there may be some data points on e, which can be included in Ci .top. In this case, the top-k list (Ci .top) and the ki -th smallest aggregate value in Ci .top are updated using all the data points on the edge e (line 4). Figure 5 shows an example over the road network G (Figure 1), for the query Ci = CANN({q1 , q2 , q3 }, 3, sum). The label for each segment, sl , for 1 ≤ l ≤ 12 is illustrated in Figure 4. The x-axis shows the aggregate function values and the y-axis shows the list of edges Ci .E. All edges are listed in ascending order of the aggregate function lower bound on them, and each data point is marked as a cross in edges. Suppose the current set of data points is P = {p1 , p2 , · · · , p7 }(p7 that lies on s9 is not drawn on Figure 1). After visiting edges from s2 to s4 , the data points, p1 , p2 and p4 , are added to Ci .top. In the next iteration, the edge s9 is visited. Note: s9 is on edge e4 = (n3 , n4 ) over the road network G from the position 40 to 50. On position 40
Monitoring Aggregate k-NN Objects in Road Networks
9
Algorithm 2 M T R 1: 2: 3: 4: 5: 6: 7: 8: 9: 10: 11: 12: 13: 14: 15: 16: 17:
let Pdel be the set of removed data points; let Pins be the set of added data points; for every data point p in Pdel do suppose p lies on edge e; delete p from e (using an object index); for every Ci in that is influenced by e do if p in Ci .top then delete p from Ci .top; Ci .k ← +∞; for every data point p in Pins do suppose p lies on edge e; insert p into e (using object index); for every Ci that is influenced by e do update Ci .top and Ci .k using p; for every Ci do if Ci .k is greater than its previous value then IRC(Ci );
and 50, its aggregate function values are 175 and 205, respectively. This information is recorded in Ci .E. Here, p7 is over s9 , and therefore on e4 in the road network G. Note: pose4 (p7 ) = 45. IRC computes its value, for p7 , 175 + (205−175)×(45−40) = 190, 50−40 which is smaller than the current Ci .k = 200 for the data point p4 . Therefore, p4 is removed from Ci .top and p7 is added. The value Ci .k is updated to be 190. Then, when visiting the next edge s10 , the smallest value is 205 which is larger than Ci .k = 190, and it stops. The top-3 for Ci is then Ci .top = {p1 , p2 , p7 }. Monitor Top-k Result: Algorithm 2 shows top-k monitoring for a list of CANN queries. Here, the movement of a data point is considered as: first to delete it from P ; then to insert a new data point into P . Let the set of deleted data points and the set of newly inserted data points be Pdel and Pins , respectively. (line 1-2). In Algorithm 2, in the first for statement (line 3-9), it updates Ci .top if the deleted data points affects the top-ki results. In the second for statement (line 10-14), it updates Ci .top if the inserted data points affects the top-ki results. In the first two for-statement, there is no need to scan Ci .E. In the third for-statement (line 15-17), if Ci .k is changed and is greater than its previous Ci .k value, it calls IRC(Ci ) to recompute the top-ki results. Reconsider the example (Figure 5) over the road network G (Figure 1), for the query Ci = CANN({q1 , q2 , q3 }, 3, sum). First, suppose p9 that lies on s5 is inserted. The insertion of p9 does not change the current top-3 results for Ci , as shown in Figure 5. Second, suppose p7 is deleted which is in Ci .top. It leads to invoke IRC(Ci ) to recompute the top-k result. The new result is Ci .top = {p1 , p2 , p4 }. Then, suppose p8 (lies on s4 ) is inserted, which lies on the influenced edges (solid lines). It does not request recomputation. The new result is Ci .top = {p1 , p2 , p8 }.
10
Lu Qin and Jeffrey Xu Yu, Bolin Ding, Yoshiharu Ishikawa s7 s6 s11 s12 s5 s10 s9 s4 s1 s8 s3 s2 130
p3 p5 p6
p7
p8
p4 p10
p9
in top list
p2
in candidate list
p1
not influenced
180
Ci .k
230
280
330
Fig. 6. Example for BU A
Algorithm 3 F orwardU pdating(Ci ) 1: e ← current(Ci .E); 2: while e 6= ∅ and low(e) ≤ Ci .k do 3: update Ci .top, Ci .k, Ci .can with data points on e; e ← next(Ci .E); 4:
4.3 Bidirectional Top-k Monitoring Algorithm There are two drawbacks in the M T R algorithm. First, it needs to recompute top-k, for Ci , when Ci .k increases (line 16-17) in M T R, which is time consuming. Second, it may scan some edges in Ci .E which is unnecessary. In this section, we introduce a new incremental monitoring algorithm, to avoid the two drawbacks. The new algorithm keeps an additional structure called candidate list, denoted as Ci .can, for query Ci , which always stores the points lies on the influenced edges, but not in Ci .top. These points may be included in Ci .top, when some points in Ci .top are deleted. As an example, consider Figure 6, for P = {p1 , p2 , · · · , p10 } (here p7 to p10 is different from those in Figure 5) for a query Ci = CANN ({q1 , q2 , q3 }, 4, sum). Suppose Ci .top = {p1 , p2 , p9 , p4 } and Ci .can = {p7 , p10 }. Below, we give two procedures, namely forward updating and backward updating, followed by the introduction to the new monitoring algorithm. Forward Updating: As shown in Algorithm 3, this procedure is similar to that of IRC (Algorithm 1). The differences are as follows. First, it does not need the initialization step. Second, the candidate list is updated in line 3. The forward updating procedure repeat updating Ci .top, Ci .k, and Ci .can when not all the influenced edges are visited. Backward Updating: This procedure, as shown in Algorithm 4, removes from Ci .can the data points on every edge e in Ci .E, if e is not influenced any more. The BU A Algorithm: Our new incremental bidirectional updating algorithm (BU A) is shown in Algorithm 5. We explain it using the example in Figure 6. Suppose initially, the set of data points is P = {p1 , p2 , · · · , p8 }, for a query Ci = CANN ({q1 , q2 ,
Monitoring Aggregate k-NN Objects in Road Networks
11
Algorithm 4 BackwardU pdating(Ci ) 1: e ← prev(Ci .E); 2: while low(e) > Ci .k do 3: delete data points on e from Ci .can; e ← prev(Ci .E); 4: 5: next(Ci .E);
Algorithm 5 BU A 1: 2: 3: 4: 5: 6: 7: 8: 9: 10: 11: 12: 13: 14: 15: 16: 17: 18:
let Pdel be the set of removed data points; let Pins be the set of added data points; for every point p in Pdel do suppose p lies on edge e; delete p from e (using an object index); for every Ci where e is influenced do if p in Ci .top or p in Ci .can then update Ci .top, Ci .k, Ci .can by deleting p; for every point p in Pins do suppose p lies on edge e; insert p into e (using the object index); for every Ci where e is influenced do update Ci .top, Ci .k, Ci .can by inserting p; for every Ci do if low(current(Ci .E)) ≤ Ci .k then F orwardU pdating(Ci ); else BackwardU pdating(Ci );
q3 }, 3, sum). After F orwardU pdating(Ci ) for initialization, we can get the initial result Ci .top = {p1 , p2 , p4 } and Ci .can = {p7 }. Then, suppose Pins = {p10 } and Pdel = {p4 }. When inserting p10 , it lies on the influenced edge s4 but has an aggregate function value that is less than Ci .k. So p10 is inserted into the candidate list of Ci , Ci .can. When deleting p4 , it is in the Ci .top. So it is removed from the Ci .top and p7 will be moved from Ci .can to the Ci .top. At this time, the lower bound of the current edge low(s10 ) ≤ Ci .k (the aggregate function value of p7 ). So the forward updating is invoked, s10 becomes influenced in Ci . The data point p8 that lies on s10 is also added to Ci .can. The current result becomes Ci .top = {p1 , p2 , p7 } and Ci .can = {p8 , p10 }. Note that in case of the M T R algorithm, the result of Ci have to be recomputed because Ci .k increases. In the next time stamp, suppose Pins = {p9 } and Pdel = φ. After p9 is used to update the result of Ci , it is added into Ci .top and p7 is moved from Ci .top to Ci .can. At this time, we have the lower bound of current edge low(s5 ) > Ci .k (the aggregate function value of p9 ). So the backward updating is invoked, and s10 is not influenced any more. The data point p8 that lies on s10 is also removed from Ci .can. The result becomes Ci .top = {p1 , p2 , p9 } and Ci .can = {p7 , p10 }.
12
Lu Qin and Jeffrey Xu Yu, Bolin Ding, Yoshiharu Ishikawa
4.4 Analysis Suppose there are n nodes and m edges in the network, for each query CANN(Q, k, h), there are s segments in the query graph on average, and the average number of objects on each segment is o, the buffer size for each query is b. The average number of segments that influence the result of a query is r, we have o · r ≥ k. We assume that the objects are uniformly distributed on all edges and the portion of objects that changes at each timestamp is λ(0 ≤ λ ≤ 1). For convenience, we ignore the cost for operations on the object index, which is not the dominate cost. Lemma 4. In the IRC algorithm, for each query, the time complexity to compute the initial results is O(o · r · log k), the memory used is O(k + b) and the I/O cost is O( rb ). Proof. To compute the initial top-k result of a query, we need to retrieve all the objects that lie on the influence segments(i.e., the first r segments in the segment list of the query). The number of objects to be retrieved is O(o · r). Each object is used to update the top-k results, which can be implemented as a heap of size k. Each update can be done in O(log(k)) time, so the total time complexity is O(o·r ·log(k)). For the memory cost, we need O(b) to buffer the segment list, and O(k) to store the results, so the total memory used is O(k + b). We visit the first r segments in the segment list sequentially, so the I/O cost is O( rb ). 2 Lemma 5. In the M T R algorithm, with a probability of 0.5, the result of a query is needed to be recomputed at each timestamp. For the query that does not need to be recomputed, the time complexity for updating at each time stamp is O(λ · o · r · log k) and no I/O operation is needed. The memory used for each query is the same as in IRC. Proof. The result of a query needs to be recomputed iff after the deletion and insertion steps, the new top-k result expires, or Ci .k value for the query Ci increases. This case happens when, for the two sets Pdel and Pins , Pdel contains more objects with cost smaller than the former Ci .k. The probability of this situation is 0.5 for the uniformly distributed objects. For each query that does not need re-computation, the time cost is the updates of λ · o · r objects that lie on the influence segments, each update cost log(k) time as the same in the IRC algorithm, so the total time complexity for updating at each timestamp is O(λ · o · r · log k). The influence segments keeps the same after the updating steps, so no I/O operation is needed on the segment list. The memory cost is also the same as the IRC algorithm. 2 Lemma 6. For the BU A algorithm, no re-computation is needed to update the result of a query at each timestamp, the time complexity for each query is O(λ · o · r · log (o · r)). The memory used for each query is O(o · r + b). The I/O cost is O( λ·r b ) in the worst case. Proof. For the BU A algorithm, it uses an extra candidate list for each query to record the candidate objects that lie on the influence segments but not in the top-k result of a query. For the λ · o · r changed objects that lie on the influence segments, the cost for updating each object is O(log o · r) by using a heap to record all the objects that lie on
13
...
Monitoring Aggregate k-NN Objects in Road Networks
e.id x1 y1 x2 y2
Object Index
Query Graphs
Influence Lists
Query Table
... p.id aggregate value
... ...
...
C i.id Q k h
...
Edge Table ...
Internal
... ...
Ci .id influence edges in GQ
...
e.id len n i n j adj edgs to ni adj edgs to n j
...
... ...
...
Ci .E ...
... p.id e.id pos ...
...
External
B+ Tree
Ci .top Ci .can
Fig. 7. Internal and External Structures
the influence segments(i.e., all the objects in the top-k result and candidate list). The total time complexity is O(λ · o · r · log (o · r)). For the memory cost, in addition to the O(b) buffer size, we need O(o · r) cost to record all the objects that lie on the influence segments. The total memory cost is O(o · r + b). For the I/O cost, consider the worst case, when λ · o · r objects move out of the influence segments and no object moves in, or λ · o · r objects move into the influence segments and no object moves out. In the first λ·r case, we need to visit O( λ·o·r o ) = O(λ · r) segments which cost O( b ) I/O operations for the forward updating. In the second case, we also need to visit O(λ · r) that cost λ·r O( λ·r b ) I/O operations for the backward updating. So the I/O cost is O( b ) in the worst case. 2 For the I/O cost of the BU A algorithm, in the average case, the number of objects that move into the influence segments is almost the same to the number of objects that move out, so the average I/O cost is very small in practice.
5 Implementation Details In this section, we introduce the details for implementation including the data structures used and the storage model.We introduce three types of data structures that are constructed over the road network, data objects and queries respectively. Edge Table For every edge e in the road network, we store in the edge table two part of information. The first part is about the network structure, i.e., the edge e.id, the two nodes ni and nj it connects, the length of the edge len(e), and the lists of edges to ni and nj , this part can be used to construct the query graph GQ of a CANN query. The second part is the influence list of e maintaining a set of queries that e influence along with the set of influence edges in GQ . Using this part of information, we can fast retrieve all queries that is influenced by e.
14
Lu Qin and Jeffrey Xu Yu, Bolin Ding, Yoshiharu Ishikawa
Object Index Each object point p in the network can be represented as (e.id, pos), where e.id is the id of the edge it lies on, and pos is its position on e, i.e., pos = pose (p). We use a index of a balanced tree to store all the object points in the network. It allows to retrieve all the objects that lies in a certain interval on a given edge e, or retrieve all the objects that over a certain edge s in a query graph of a CANN query. When the size of objects are large, the index can be stored external and a B+ tree can be used for storage. Query Table The query table stores the set of queries. For every query Ci in the query table, tree parts of information are stored. The first part is the query descriptor, i.e., Ci .id, Q, k and h. The second part is the list of top-k objects Ci .top along with Ci .k and the candidate list Ci .can. The third part is the sorted edge list in the query graph Ci .E, which is a external data structure on which only sequential access and read operation is allowed. Each edge in the list is represented as s = (e.id, x1 , y1 , x2 , y2 ), where e is the edge on the original graph G, x1 and x2 are the start and end positions of s on e, y1 and y2 are the aggregate values on x1 and x2 respectively. Based on the sequential property, a buffer can be used for each query when processing. The main internal and external data structures used for processing are illustrated in Figure 7.
6 Experimental Studies Parameter Number of edges Number of nodes Number of queries Number of query points Number of objects Query distribution Object distribution Top-k Object agility Buffer size Function
Default 25K 20K 5K 20 100K Uniform Uniform 50 10% 2K SUM
Range 10, 15, 20, 25, 30 (K) 5, 10, 15, 20, 25 (K) 1, 3, 5, 7, 10 (K) 1, 10, 20, 30, 40 10, 50, 100, 150, 200 (K) Gaussian, Uniform Gaussian, Uniform 1, 25, 50, 100, 200 5, 10, 15, 20, 25 (%) 1, 2, 3, 4, 5 (K) MIN, MAX, SUM
Table 1. Parameters
We conducted extensive experimental studies to test the performance of our algorithms. All algorithms are implemented using C++. We use the road-map in the Maryland State in US extracted from US Census Bureau 2005 TIGER/Line.3 . All the parameters including default values and ranges are listed in Table 1. Here, number of query points means the number of points in Q (i.e., |Q|) for each query, the query distribution is distribution of all query points, and the object agility is the percentage of objects that is changed per time stamp. The default graph is a subgraph of the above network with 20K nodes and 25K edges. When number of nodes varies, we use a subgraph of the 3
Topologically Integrated Geographic http://www.census.gov/geo/www/tiger/
Encoding
and
Referencing
system:
Monitoring Aggregate k-NN Objects in Road Networks
15
network with the provided node number. When number of edges varies, we fix the node number to be 10K and generate a graph with the provided edge number. For each test that is to monitor the k-NN result, we process for 100 time stamps by generating the moving objects using the generator proposed in [3].We record the average performance for every time stamp. For the IRC algorithm, we mean to recompute the top-k result from scratch for every time stamp. Unless specified, we will use the default value for testing. All tests are conducted on a 2.8GHz CPU/1G memory PC running XP.
Time (sec)
Time (sec)
2
IMA GMA BUA
0.5 0.4 0.3 0.2
1.2
IRC MTR BUA
IRC 1 MTR BUA
1.5
Time (sec)
0.6
1
0.8 0.6 0.4
0.5 0.1
0.2
0
0 U/G
G/U
G/G
(a) IMA,GMA vs BUA
30K
5K
0.6 0.4
0.6 0.4
20%
25%
1.5 1
Time (sec)
1
1 0.8 0.6 0.4
50K
100K
150K
200K
1
(e) Vary Objects
1.6
IRC 1.4 MTR BUA 1.2
0 10K
(d) Vary Object Agility
0.8
0 3K
5K
7K
10K
0.6 0.4
100K
Memory (MBytes)
1K 100 10 1 1K
2K
3K
4K
5K
(j) Vary Buffer Size
200
IRC MTR BUA
1.5 1 0.5
10
20
30
40
MIN
(h) Vary Query Points
IRC MTR BUA
10K
100
0 1
(g) Vary Queries
50
2
IRC MTR BUA
0 1K
25
(f) Vary k
0.2
0.2
25K
0.5
Time (sec)
15%
20K
IRC MTR 2 BUA
0 10%
15K
2.5
0.2
5%
10K
(c) Vary Nodes
IRC MTR 0.8 BUA
0
Time (sec)
25K
1
IRC MTR BUA
0.2
Number of I/Os
20K
45 IRC 40 MTR 35 BUA 30 25 20 15 10 5 0 1K
MAX
SUM
(i) Vary Functions 50
Memory (MBytes)
0.8
15K
(b) Vary Edges
Time (sec)
Time (sec)
1
0 10K
Time (sec)
U/U
IRC MTR 40 BUA 30 20 10 0
3K
5K
7K
10K
(k) Vary Queries
1
25
50
100
200
(l) Vary k
Fig. 8. Experimental Results
Query Graph Construction: We first test the time to construct the query graph for each query. We vary the number of edges, number of nodes and number of query points, and record the time to construct the query graph in each test. The result is shown in Table 2, the time to construct query graph is small (less than 0.7 second) for all tests. As each of the three parameters increases, the response time will increase steadily.
16
Lu Qin and Jeffrey Xu Yu, Bolin Ding, Yoshiharu Ishikawa |E|(K)/T(ms) 10/114 15/214 20/319 25/408 30/505 |N |(K)/T(ms) 5/64 10/155 15/254 20/336 25/437 |Q|/T(ms) 1/26 10/178 20/343 30/506 40/675 Table 2. Time to construct query graph
IMA,GMA vs BUA: With |Q| fixed to be 1, we test the efficiency for IMA, GMA, and BUA algorithms. For each algorithm, we combine the different distributions(i.e., Gaussian and Uniform distribution) for queries and objects (e.g., U/G means the queries are uniformly distributed and the objects are in Gaussian distribution) with all other parameters setting to be the default values. As illustrated in Figure 8(a), our BUA algorithm always performs best and changes for distribution of both the queries and objects will not influence the efficiency of BUA algorithm much. Network: We vary the number of edges and number of nodes for the network with an average of 4 objects on each edge and test the average processing time for IRC, M T R and BU A algorithms in each time stamp. We report our result in Figure 8(b) and Figure 8(c). For each test, the MTR algorithm is about 2-3 times faster than the IRC algorithm, and the the BUA algorithm is 2-4 times faster than the MTR algorithm. When the number of edges increases, the processing time for all three algorithms will increase, because as the network becomes denser, the number of influence edges will increase. When the number of nodes increases, the processing time for all three algorithms do not change much, because both the density of network and density of objects will not change as the network increases. Objects: Figure 8(d) and Figure 8(e) shows the average processing time per time stamp for IRC, M T R and BU A algorithms when the object agility or the number of objects varies. When the object agility increases, the processing time for both M T R and BU A will increase steadily while IRC is not influenced because it will always computes each query from scratch at every time stamp. When the number of objects increases, the density of objects becomes larger, which increases the processing time. But the number of influenced edges will decrease, which decreases the processing time. We can see from Figure 8(e) that when the object number is larger than 50K, the processing time for all the three algorithms all increase slowly. Queries: There are mainly 4 parameters for the query: the top-k value, number of queries, number of query points in each query(i.e., |Q|), and the type of aggregate function for the query. In Figure 8(f) and Figure 8(g), when k increases or the number of queries increases, the processing time for IRC, M T R and BU A algorithms will increase steadily. In Figure 8(h), when the number of query points in each query increases, the processing time for all three algorithms will not influence much, because at one hand, the number of edges in each query’s query graph in will increase which raise the complexity of algorithm; at the other hand, the length of edges in each query’s query graph becomes shorter, and the objects lies on the influence edges become less, which lower the complexity. In Figure 8(i), we see that the MIN function consumes more for all three algorithms. It is because for MAX and SUM function, the best objects retrieved is more centralized for each query, while in the MIN function, each query point in a query can be considered as a center for the distribution of the top objects.
Monitoring Aggregate k-NN Objects in Road Networks
17
Total I/Os: We vary the buffer size used for every query C in the corresponding edge list C.E, and study the number of I/Os for IRC, M T R and BU A algorithms for each time stamp. As shown in Figure 8(j), as the buffer size increases, the number of I/Os will 1 of decrease steadily. The M T R costs about 15 I/Os of IRC while BU A costs about 20 M T R, which is rather small, because the pointer for each query only moves forward of backward incrementally. Memory: We finally test the memory used for algorithms of IRC, M T R and BU A. When the number of queries and top-k value vary, the result is shown in Figure 8(k) and Figure 8(l). As the query number or k increases, the memory used will increase steadily, for all three algorithms. The memory cost of IRC and M T R is the same as analyzed in Section 4.4. The memory cost for BU A is about 1.1 to 2.4 times of IRC.
7 Related Work In this section, we survey k-NN search over road networks in two categories, namely, snapshot approaches and continuous monitoring approaches. Snapshot approaches: Shahabi et al. in [4] applied an embedding technique to transform a road network to a high dimensional space, and used the Minkowski metrics for distance measurement in the embedded space. Jensen et al. in [5] proposed a foundation data model and a system prototype for k-NN queries in road networks. Shekhar et al. in [6] addressed the problem of finding the in-route nearest neighbor (IRNN). Papadias et al. in [7] proposed an architecture that integrates network and Euclidean information for query processing in spatial network databases. Tao et al. in [8] studied the time-parameterized k-NN queries when query points and objects change in certain speed and directions. Kolahdouzan et al. in [9] proposed to find the nearest points of interest to all the points on a path over road networks. They also performed k-NN over spatial networks in [10] based on the pre-computed first order Voronoi diagram. Yiu et al. in [17] first studied the aggregate nearest neighbor query in road networks, which explored the network around the query points until the aggregate nearest neighbors are discovered. UNICONS [11] developed a search algorithm which answers NN queries at any point of a given path. Huang et al. in [12] presented a versatile approach to k-NN computation in spatial networks using the island which is a sub-network in a certain area. Hu et al. in [13] proposed an approach that indexes the network topology based on a set of interconnected tree-based structures. Huang et al. in [14] focused on caching the query results in main memory and subsequently reusing these for query processing when there are multiple k-NN queries over a road network. Almeida et al. in [15] proposed a storage schema with a set of index structures to support Dijkstra based algorithms for k-NN queries in road networks. Deng et al. in [16] considered the problem of efficient multi-source skyline query processing in road networks. Continuous monitoring approaches: In recent years, more works focused on continuous monitoring of NN queries over road networks. Ku et al. in [17] studied the adaptive NN queries in travel time networks. It developed a local-based greedy nearest neighbor algorithm and a global-based adaptive nearest neighbor algorithm that both utilize realtime traffic information to maintain the search results. Mouratidis et al. in [1] focused on monitoring nearest neighbors in highly dynamic scenarios.
18
Lu Qin and Jeffrey Xu Yu, Bolin Ding, Yoshiharu Ishikawa
8 Conclusion In this paper, we studied a new problem (CANN query) that is to monitor k-NN objects over a road network from multiple query points to minimize an aggregate distance function with respect to the multiple query points. In order to reduce the cost of network distance computing, we proposed a new approach that computes a query graph offline for a CANN query. With the help of the query graph, the cost of computing aggregate function values for any possible data points on the road network is significantly reduced. In addition, we proposed two algorithms to monitor CANN queries. We conducted extensive experimental studies over large road networks and confirmed the efficiency of our algorithms. Acknowledgment: This work was supported by a grant of RGC, Hong Kong SAR, China (No. 418206).
References 1. Mouratidis, K., Yiu, M.L., Papadias, D., Mamoulis, N.: Continuous nearest neighbor monitoring in road networks. In: VLDB. (2006) 43–54 2. Yiu, M.L., Mamoulis, N., Papadias, D.: Aggregate nearest neighbor queries in road networks. IEEE Trans. Knowl. Data Eng. 17(6) (2005) 820–833 3. Brinkhoff, T.: A framework for generating network-based moving objects. GeoInformatica 6(2) (2002) 153–180 4. Shahabi, C., Kolahdouzan, M.R., Sharifzadeh, M.: A road network embedding technique for k-nearest neighbor search in moving object databases. In: ACM-GIS. (2002) 94–10 5. Jensen, C.S., Kol´arvr, J., Pedersen, T.B., Timko, I.: Nearest neighbor queries in road networks. In: GIS. (2003) 1–8 6. Shekhar, S., Yoo, J.S.: Processing in-route nearest neighbor queries: a comparison of alternative approaches. In: GIS. (2003) 9–16 7. Papadias, D., Zhang, J., Mamoulis, N., Tao, Y.: Query processing in spatial network databases. In: VLDB. (2003) 802–813 8. Tao, Y., Papadias, D.: Spatial queries in dynamic environments. ACM Trans. Database Syst. 28(2) (2003) 101–139 9. Kolahdouzan, M.R., Shahabi, C.: Continuous k-nearest neighbor queries in spatial network databases. In: STDBM. (2004) 33–40 10. Kolahdouzan, M.R., Shahabi, C.: Voronoi-based k nearest neighbor search for spatial network databases. In: VLDB. (2004) 840–851 11. Cho, H.J., Chung, C.W.: An efficient and scalable approach to cnn queries in a road network. In: VLDB. (2005) 865–876 12. Huang, X., Jensen, C.S., Saltenis, S.: The islands approach to nearest neighbor querying in spatial networks. In: SSTD. (2005) 73–90 13. Hu, H., Lee, D.L., Xu, J.: Fast nearest neighbor search on road networks. In: EDBT. (2006) 186–203 14. Huang, X., Jensen, C.S., Saltenis, S.: Multiple k nearest neighbor query processing in spatial network databases. In: ADBIS. (2006) 266–281 15. de Almeida, V.T., G¨uting, R.H.: Using dijkstra’s algorithm to incrementally find the k-nearest neighbors in spatial network databases. In: SAC. (2006) 58–62 16. Deng, K., Zhou, X., Shen, H.T.: Multi-source skyline query processing in road networks. In: ICDE. (2007) 17. Ku, W.S., Zimmermann, R., Wang, H., Wan, C.N.: Adaptive nearest neighbor queries in travel time networks. In: GIS. (2005) 210–219