K Sriharsha, et al International Journal of Computer and Electronics Research [Volume 1, Issue 4, December 2012]
MONITORING THE PADDY CROP FIELD USING ZIGBEE NETWORK K. Sriharsha PG Student, Dept. of ECE BVC Engg. College Odalarevu, INDIA
[email protected]
T.V. Janardhana Rao Professor, Dept. of ECE BVC Engg. College Odalarevu, INDIA
[email protected]
Abstract- Sensors are the hopeful device for
precision agriculture. By forming wireless sensor network we can make good monitoring system in the paddy crop field area. This paper proposed idea about monitoring the crop field area without man power.In this paper we have detailed about how to utilize the sensors in paddy crop field area and explained about Wireless Sensor Network (WSN), Zigbee technology, Protocol stack of zigbee. The fundamental concept of this paper is to provide a highly enabled monitoring of paddy crop field. This paper is focus on the sensing and monitoring the Temperature, humidity and water level of the paddy crop field and gives various sensing analyzes in the paddy crop field. Wireless Sensor Network, Crop Field Monitoring. Keywords:
Zigbee,
A.Pravin Associate Professor Dept. of ECE BVC Engg. College Odalarevu,,INDIA
[email protected]
K. Rajasekhar Associate Professor, Dept. of ECE BVC Engg. College Odalarevu, INDIA
[email protected]
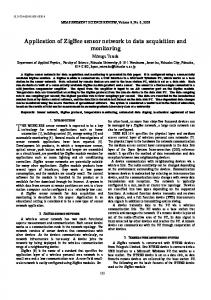
requires no real maintenance. Selecting the optimum sensors and wireless communications link requires knowledge of the application and problem definition. Battery life, sensor update rates, and size are all major design considerations. Examples of low data rate sensors include temperature, humidity and peak strain captured passively. A WSN (wireless sensor network) generally consists of base station (or) gateway that can communicate with a number of wireless sensors via a radio link. power unit produces the power.Data Processing unit have the microcontroller,which is the fully responsible to get sesned data and transmit over the another network. The micro controller performs tasks, processes data and controls the functionality of other components in the sensor node. Sensing unit has the sensors and analog to digital converter (ADC) to convert analog sensed signal to digital signal.
I. INTRODUCTION WSN can eliminate the cost of installation, maintenance and eliminates connectors. Potential benefits includes fewer catastrophic failures, conservation of natural resources, improved manufacturing productivity, improved emergency response, and enhanced homeland security. The ideal WSN is networked and scalable, consumes very little power, is smart and software programmable, capable of fast data acquisition ,reliable and accurate over the long term, costs little to purchase and install, and Webpage: http://ijcer.org
Figure1: Wireless sensor network
ISSN: 2278-5795
Page 202
K Sriharsha, et al International Journal of Computer and Electronics Research [Volume 1, Issue 4, December 2012]
II. ZIGBEE TECHNOLOGY Zigbee is a low power wireless sensor network used in many applications such as oil field monitoring, industrial monitoring, mine safety and all [1],[2]. But the usage of zigbee wireless sensor network in agricultural field is very low. This paper shows the model for perfect real time monitoring of crop field by forming zigbee network and experimental result of that model when deploying nodes in real time. Physical and MAC (Medium Access Control) layers of zigbee are supported by IEEE 802.15.4. The physical layer supports three frequency bands that are 2.450MHz, 915MHz and 868 MHz with different gross data rates (250 kbs1), (40 kbs-1) and (20 kbs-1) respectively[3].
Zigbee is mainly famous for its mesh topology. In this crop field monitoring we used mesh topology. The various sensed data from various sensors goes to the central Global System for Mobile (GSM) node. From that the sensed data is given to the personal computer, which is used by a farmer. B. Protocol Stack: Zigbee wireless networking protocol layers are shown in the above. The Zigbee standard gives only the networking, application, and security layers of the protocol and adopts IEEE 802.15.4 PHY and MAC layers as part of the Zigbee networking protocol.
The functionality of both transmitter and receiver ar combined into a single device known as transceivers. Zigbee transceives are used for transmission purpose.
Figure: 2 Zigbee Transceiver node A. Zigbee Topologies:
Figure: 4 Protocol stack
Figure: 3 Different topologies
Webpage: http://ijcer.org
Therefore, any Zigbee-compliant device conforms to IEEE 802.15.4 as well. Implementing the full Zigbee protocol ensures interoperability with other vendor’s wireless solutions and additional reliability due to the mesh networking capability supported in Zigbee [4].
ISSN: 2278-5795
Page 203
K Sriharsha, et al International Journal of Computer and Electronics Research [Volume 1, Issue 4, December 2012]
The zigbee module is supported by IEEE 802.15.4 and Zigbee devices are FFD (Full Function Device) and RFD (Reduced Function Device). FFD can communicate with both FFD and RFD, and it can be used as a PAN (personal area network) Coordinator, Router, and End Device. RFD can only communicate with FFD, so it can be only End Device. Therefore, RFD requires moderately small resources including memory size.
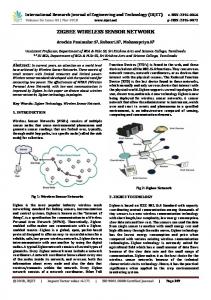
III. PROPOSED ARCHITECTURE Paddy
crop
field
GSM node sensor, the data are sent to the personal computer through gateway. A Gateway is the device which can be used to connect two networks of different protocols. Systems require a gateway or coordinator to establish time synchronization. Also from gateway the datas are sent to the personal computer. A server is connected to the database, which has minimum and maximum threshold value of temperature, water level, Ph level. If the sensed data attains maximum or minimum threshold level stored in the data base, the alarm unit will give an alarm sound to the farmer. By this farmer may get attention about the crop field. The above diagram shows the sensing methodology of wireless sensor network. Location can be detected by X-path algorithm. Data gathered from different sensors are transmitted to the center coordinator node. From coordinator node, the data are sent to the personal computer.The datas are transmitted to the control station for decision making process. Actuation and control decision process are based on the sensed data of sensors from the paddy crop field area.
IV. FLOW CHART area
Figure: 5 Real time paddy crop field monitoring using zigbee. The proposed system architecture has several types of nodes deployed in the crop field area. It captures the physical phenomenon such as temperature, pressure, humidity, water level, pH can be monitored in a paddy crop field. The varioussensed data from various places of crop field area is transmitted to the central Global System of Mobile (GSM) node or coordinator node. From the Webpage: http://ijcer.org
Figure: 6 flow chart
ISSN: 2278-5795
Page 204
K Sriharsha, et al International Journal of Computer and Electronics Research [Volume 1, Issue 4, December 2012]
A. Advantages of proposed system In paddy crop field we have to irrigate the land fully. We have to irrigate depending upon the soil, ups and downs of the land and where it needs. In present era, there is no mechanism to find where irrigation is needed. In this paper, we made zigbee wireless sensor network for monitoring the crop field area by deploying water sensors in the land to detect the places where the water level is low. From those results we irrigate to that particular place only. From the above methodology we can conserve water and minimize the problem of water logging in the land. We used humidity sensor to sense the weather. By this the farmer can get idea about the climate. If there is any chance for rainfall, the farmer need not irrigate the crop field. Due to this we can conserve water and also power since we dint turn on motors. Nowadays in the crops the fertilizer level is increasing, which affects people. By using pH sensors we get the information about the soil and analyze the acid level of the soil. By which we can apply fertilizer to the place where it needs, also we can avoid over fertilization of the crops.Temperature is a randomly varying quantity in the environment of paddy field. Temperature reading gives information to the farmer. By using temperature sensors we can detect the temperature, and irrigate the water to the crop field area. B. Experimental Setup:
microcontroller and humidity sensor was connected to another zigbee via microcontroller. One zigbee node act as a router and one act as a coordinator, another one act as an end device. All sensed data are sent to the coordinator node which is connected to the personal computer via gateway. By using this network we can sense the data such as temperature, humidity, water level, PH level of crop field area. Lot of wired system proposed for this type of monitoring theoretically and practically. We used Zigbee wireless sensor network. The sensing unit consists of sensor and power supply which may be either external power supply or battery operated one. The sensed data from the sensor is fed to the processing unit where the controller processes the data which is then passed to the node for transmission over Wireless network. The Zigbee node receives the data and scan for available node to transmit the data to the coordinator node.The coordinator receives the data, process it and transmit to the monitoring unit, which is going to be observed by a farmer.
V. RESULT AND ANALYSIS TABLE 1 TEMPERATURE READINGS
The above result was received from the temperature sensor, which was connected to the coordinator node; consequently the coordinator node was connected to the personal computer. The above result was taken at real time in our college lab. TABLE 2 HUMIDITY READING
Figure:7 Experimental setup We used four Zigbee nodes to form a Zigbee network.Temperature sensor and pressure sensor were connected to two zigbee device via Webpage: http://ijcer.org
The above result was received from the humidity sensor, which was connected to the coordinator node and consequently the coordinator
ISSN: 2278-5795
Page 205
K Sriharsha, et al International Journal of Computer and Electronics Research [Volume 1, Issue 4, December 2012]
node was connected to the personal computer. The above result was taken at real time in our college lab. TABLE III WATERLEVEL READINGS s.no 1 2 3 4 5
Waterlevel(cm) 26 27 28 27 29
Above graph shows the humidity readings when implemented in real time environment. Analysis report shows that the humidity is a varying quantity in the paddy crop field area. Water level Vs time
Time(s) 11.15 11.16 11.17 11.20 11.21
The above result was received from the water indicator which was connected to the coordinator node and consequently the coordinator node was connected to the personal computer. The above result was taken at real time in our college lab. Figure: 10 Water level Vs Time Above graph shows the water level readings when implemented in real time environment. Analysis report shows that the water level is a varying quantity in the paddy crop field area.
VI. CONCLUSION Figure: 8 Time Vs Temperature Above graph shows the temperature readings when implemented in real time environment. We get the result that the temperature is a varying quantity in the paddy crop field area.
In this paper we have discussed about how to utilize the sensor in the paddy crop field area and gives proposed architecture for real time paddy crop field monitoring with zigbee wireless sensor network. Analyzed about real time readings of temperature, humidity and water sensor deployed in real time. Result shows that zigbee wireless sensor network is efficient for paddy crop field monitoring. Now we are working in the part how to resend the packets when packet loss occurs and also doing simulation work for more number of nodes implementing in the paddy crop field environment. The proposed work gives efficient monitoring of paddy crop field monitoring.
Figure: 9 Humidity Vs Time Webpage: http://ijcer.org
ISSN: 2278-5795
Page 206
K Sriharsha, et al International Journal of Computer and Electronics Research [Volume 1, Issue 4, December 2012]
REFERENCES [1] Khalid EL-Darymli, Faisal Khan, Mohamed H. Ahmed. “Reliability Modeling of Wireless Sensor Network for Oil and Gas Pipelines Monitoring”, Sensor & Transducers Journal, Vol.106, Issue 7, July 2009, pp. 6-26, ISSN 1726-5479.
[3] Alka Kalra, Rajiv Chechi, Dr. Rajesh Khanna,” Role of Zigbee Technology in Agriculture Sector”in NCCI 2010 -National Conference on Computational Instrumentation,CSIO Chandigarh, INDIA, 19-20 March 2010,pp 151-152. [4] Shahin Farahani, “Zigbee Wireless Networks and Transceivers”, newness publications.
[2] K. Nirmal Kumar, R.Prabakaran, V.R. Sarma Dhulipala,P.Ranjith “Future Sensors and Utilization of Sensors in Chemical Industries with Control of Environmental Hazards”, in ICESD 2011International Conference on Environmental Science and Development Jan 7-9 2011,pp 224-228, ISBN 978-1-4244-9235-0,inpress.
Webpage: http://ijcer.org
ISSN: 2278-5795
Page 207