Monitoring Visual Focus of Attention via Local Discriminant Projection Honggang Zhang
Lorant Toth
Weihong Deng
PRIS lab Beijing University of Posts and Telecommunications
InterAct lab Carnegie Mellon University
PRIS lab Beijing University of Posts and Telecommunications
[email protected]
[email protected]
Jun Guo PRIS lab Beijing University of Posts and Telecommunications
[email protected]
[email protected] Jie Yang
InterAct Lab Carnegie Mellon University
[email protected]
ABSTRACT
1. INTRODUCTION
In this paper, we present a system to monitor a subject’s Visual Focus of Attention (VFOA) based on his/her head poses. The system first detects faces from video images and determines if the detected face is a frontal or profile face. If a frontal face is detected, the system further estimates the head pose from the face image. Instead of estimating continuous head poses, we formulate the problem as a classification problem and classify the head pose into one of a predefined number of poses using a local discriminant projection (LDP) method. The LDP method uses two graphs for the modeling the head pose embedding, one is the nearest native neighbor graph, the other is the nearest invader graph. We evaluate the LDP method in CAS-PEAL Database with 21 head poses and a realistic data set with 9 poses collected from our application scenario. The experimental results indicate that our approach outperforms other methods. We describe the implementation of the system with an application in monitoring customers’ VFOA in a display window that displays items for sale in a shop. The system can be used to index and retrieve information for customer analysis.
Focus of Attention refers to the mind’s ability to direct its inner awareness upon a particular target. It, however, would be very difficult to measure focus of attention based on such a definition. Fortunately, the literature suggests that humans are generally interested in what they look at. This has, for example, been demonstrated in Yarbus’ classical experiments in which a subject’s eye movements were tracked when they watched a painting [20]. Recent user studies have further provided strong evidence that people naturally look at objects or devices with which they are interacting [12] [2]. Therefore, in practice, people usually use visual focus of attention (VFOA) which is defined as the direction at which people look to represent their focus of attention. Many human-computer interaction applications require estimate VFOA. One of such applications is to monitor VFOA of a subject in front of a large display, e.g., a display window at a shop or shopping mall. That is, we would like to analyze to which part(s) of the shopping window the subject has paid her/his attention. In this research, we are interested in monitoring VFOA of subjects in a freely moving environment.
Categories and Subject Descriptors
The problem requires estimate a subject’s gaze directions in an unconstrained environment. There are two contributing factors in the formation of where a person looks at: head orientation and eye orientation. Head orientation is considered as a sufficient cue to detect a person’s direction of attention. Relevant psychological literature offers a number of convincing arguments for this approach and the feasibility of this approach is demonstrated [9].
H.4 [Information Systems Applications]: Miscellaneous; I.4.9 [Image Processing and Computer Vision]: Applications
General Terms Algorithms
Keywords Visual Focus of Attention, Local Discriminant Projection, attention information retrieval, head pose estimation, face detection, eye localization
Our VFOA problem is an extension of the traditional one in, at least, two respects. First, a subject’s mobility is unconstrained, i.e., subjects can freely move in the environment. This differs from meeting applications where participants are seated in relatively fixed locations. Second, there are several potential targets in the environment where subjects may pay their visual attention. For example, a shopping window can display many different products in different locations of the widow. This is different from detection of attention to an advertisement in the scene where there is only one target available [16]. As a result, the subject’s target of attention may change, or as the subject moves in the scene, his/her appearance may change as he attempts to keep his attention on a specific target. Unconstrained motion also limits the resolution of the subject in the video, as a wide field of view is necessary to capture
multiple subjects over an area of interest. Limited resolution of the subject’s head makes estimating his/her VFOA more difficult (and impossible in some cases) when a subject is at a distance from the camera. In this paper, we approach the problem using a hierarchical method. We first detect faces from video images and determine if the detected face is a frontal or profile face. If a frontal face is detected, we will further estimate the head pose from the face image cropped based on eye location. Instead of estimating continuous head poses, we formulate the problem as a classification problem and classify the head pose into one of a predefined number of poses using a local discriminant projection (LDP) method. The LDP method uses two graphs for modeling the head pose embedding, one is the nearest native neighbor graph, the other is the nearest invader neighbor graph. We describe the implementation issues of the system including robust face and eye detection. We evaluate the LDP method in CAS-PEAL Database [5] with 21 head poses and a realistic data set with 9 poses. The experimental results indicate that our approach outperforms other methods. The rest of the paper is organized as follows. Section 2 describes problem and related work. Section 3 discusses the LDP method for head pose estimation in detail. Section 4 presents the implementation of the system and Section 5 reports experimental results. We conclude the paper in Section 6.
2.
PROBLEM DESCRIPTION AND RELATED WORK
In this research, we are interested in developing a system that can monitor where a customer are paying attention to in a display window. Our goal is to estimate VFOA from video images in an unconstrained environment where subjects can freely move in the scene. We solve the problem using a hierarchical approach: we first determine whether a subject is facing the window and then determine which part of the widow the subject is paying attention to if the subject is facing the window. Since our application does not require continuous values of head poses, we divide the space into a predefined number of regions and estimate the head pose pointed to one of these regions to enhance the robustness and efficiency of head pose estimation. We formulate the head pose estimation as a classification problem and propose to use the LDP method because we are dealing with a large change in head pose which resides in a nonlinear manifold. Our problem is similar to an evaluation task defined by 2002 workshop on Performance and Evaluation of Tracking Systems (PETS), which provided data for depicting people passing in front of a shop window, including the number of people in front of the window and the number of people looking at the window [13]. However, the task was focused on body motion only. Body motion alone does not contain enough information to accurately determine VFOA. Smith et al. attempted to monitor the attention of passers-by to an outdoor advertisement [16]. The system assumed only one target in the scene. Our approach requires estimate head poses. The existing methods for head pose estimation can be broadly divided into three categories: (1) Shape-based geometric analysis [8]: The generic face model or geometric structure is first defined. Then the geometric parameters are used to estimate head pose. However, defining the face geometry in side views still remains challenge. (2) Appearance-based methods [10]: The method takes the head esti-
mation problem as a pattern classification task. The training data are divided into several subsets for novel view classification. The limitation of these approaches is the weak generalization. Most of these methods can only estimate head pose or face view in a limited range. (3) Manifold learning and dimensionality reduction [3] [14]. During the last few years, a large number of approaches have been proposed for constructing and computing the embedding. The nonlinear methods, such as locally linear embedding (LLE) [15], Laplacian eigenmaps [1], Isomap [18], focus on preserving the geodesic distances which reflect the real geometry of the low-dimensional manifold. The linear methods, such as principal component analysis (PCA), multidimensional scaling (MDS) [3], locality preserving projections (LPP) [6] and linearized LEA [4], L-LDA [11], locality discriminant indexing(LDI) [7] are evidently effective in observing the Euclidean structure for vision applications. The set of all facial images in three angles of rotation (yaw, tilt, and roll) is intrinsically a 3D manifold in the image space. One main drawback of these techniques is that they are sensitive to face alignment, the output from the face detectors are usually not well aligned, which will cause the deterioration in the accuracy of pose estimation.
3. HEAD POSE ESTIMATION USING THE LDP A core technology in our approach is robust head pose estimation using the LDP method. In this section, we describe the LDP method in detail. A set of face images is represented as a matrix X = [x1 , x2 , · · · , xN ], xi ∈ Rm , where N is the number of samples and m is the dimension of the feature space. The class label of the sample xi is ci ∈ {1, 2, · · · , C}, where C is the number of classes, We want to find projection matrix W which maps an m dimensional data space to a d-dimensional subspace (d ¿ m ): W T : Rm → R d .
3.1 Manifold Modeling for Discriminant Analysis Two graphs are introduced to construct class-specific manifold, the k nearest-native graph and invader graph. It is natural to model the within-class local structure by a graph that puts an edge between each sample and its k nearest natives. Therefore, we define the k nearest-native graph as a weighted graph Gn = {V, S n }, with V = {xi }N i=1 , and ( −kxi −xj k2 n t , xi ∈ Nk (xj ), xj ∈ Nk (xi ) e Sij = (1) 0, otherwise. n where S n is a sparse symmetric N × N matrix with Sij weighting the edge connecting vertices xi and xj , Nk (xi ), called k nearestnative neighbors of xi , is the set of k nearest neighbors having the same label with xi . However, class-specific manifold structures are usually overlapped in the high-dimensional space. To effectively characterize the manifold overlap, the invader graph is introduced, which is denoted as a weighted graph Gf = {V, S f }, with V = {xi }N i=1 , ( −kxi −xj k2 f t , xi ∈ Ik (xj ), xj ∈ Ik (xi ) e (2) Sij = 0, otherwise.
where the set Ik (xi ) composes of the invaders of xi . The invaders of xi have two properties: 1) they reside in the local spherical space Rm (xi ) = {x :k x − xi k< ²i } with the radius as ²i = maxxj ∈Nk (xi ) k xj − xi k; and 2) their labels are different from xi .
3.2
Local Discriminant Criterion
It is an ideal case to make each sample and its k-nearest neighbors always belong to the same class in the projected space and its invaders far apart. Based on this locality discriminating criterion, the optimal projection vector can be determined as follows: min
N X N X n (yi − yj )2 Sij ,
(3)
i=1 j=1
max
N X N X f (yi − yj )2 Sij .
(4)
i=1 j=1
Suppose W is a transformation vector, Y = W T X . Finally, by combining the two objective functions (3) and (4), the LDP criterion is given by P T T 2 n ij (w xi − w xj ) Sij ∗ w = arg min P T T 2 f w ij (w xi − w xj ) Sij = arg min w
wT XLn X T w . wT XLf X T w
(5)
The numerator characterizes the intra-class compactness by the sum of the distance between each data and its k-nearest natives, while the denominator models the inter-class overlap by the sum of distance between each data and its invaders. In equation (5),Ln = Dn − S n is the Laplacian of the graph Gn , and the Dn is Pnative n n , and Lf = Df − S f is S = a diagonal matrix with Dii j ij the Laplacian of thePinvader graph Gf , and the Df is a diagonal f f . The vectors w∗ that minimize the obmatrix with Dii = j Sij jective function are given by minimum eigenvalue solutions to the generalized eigenvalue problem. From the above description, the Local Discriminant Projection (LDP) algorithm can be described as follows. 1. PCA projection. For a high-dimensional application, we first project a data set {xi }N i=1 into an n-dimensional PCA subspace by retaining a certain portion of energy. For simplicity, we still use xi to denote the data projected in the PCA subspace in the following steps, let WP CA ∈ Rm×n denote the transformation matrix of PCA. 2. Constructing the k nearest native neighbor graph and invaders neighbor graph according to equations (1) and (2). 3. Solving locality discriminant criterion in equation (5). Computing the eigenvector and eigenvalue of the following generalized eigenvalue problem: XLn X T w = λXLf X T w.
(7)
Then the transformation matrix is: W = WP CA • WLDP .
4.
THE SYSTEM IMPLEMENTATION
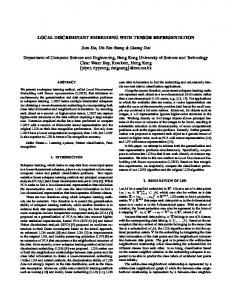
In this section, we discuss system implementation issues. Our application scenario is to monitor customers’ VFOA in a display window that displays items for sale in a shop. A video camera is installed inside of the display window and faced to outside of the window. If a subject is far away from the window (e.g. beyond 3 meters), the system only detects if the subject pays attention to the window by frontal/profile face detection. If a subject is within 3 meters from the window, the system will perform more detailed focus of attention analysis. Fig.1 illustrates the VFOA system architecture. The system performs face detection from input video images. The system provides information of detected faces (locations, frontal/profile) in each frame. If a frontal face is detected, the system will further perform eye detection within the detected face. The eye locations are used to crop a face region and align the face for pose estimation. The head pose is classified by the trained LDP model. The LDP model is trained off-line in advance. The system runs in real-time. Besides the LDP method, robust detection of face and eye plays very important role in our system. We describe the implementation of face and eye detection in the rest of this section.
(6)
4. Outputting the transformation matrix. Let w0 , w1 , · · · , wk−1 be the solutions of (6), eigenvalues ordered in a descent order 0 ≤ λ0 ≤ λ1 ≤ · · · ≤ λn−1 , and d(d ≤ n)be the output dimension. We have WLDP = [w0 , w1 , · · · , wd−1 ].
Figure 1: An illustration of the VFOA system architecture.
(8)
4.1 Face Detection We employ Haar cascade classifiers as described by Viola and Jones for detecting faces from input images [19]. The framework uses Haar basis-like features and an AdaBoost optimized cascade structure to perform efficient and fast object detection. For our application, we have trained face detection module for upright faces, in-plane 45 degree rotated faces and profile views. We utilize Haarlike features introduced by Viola and Jones for their simplicity and good performance in face detection tasks [19]. Even though Haarlike features are simple numerous combinations, scales and possible locations are possible and yield a large set of possible features
to select from. Therefore AdaBoost is used to efficiently select the most promising features. Thresholded Haar-like rectangle features compose AdaBoost’s weak classifiers. By selecting and combining the most discriminative features in several runs AdaBoost builds a strong classifier that is far more powerful than the initial features. In order to further improve runtime performance a cascade structure is utilized that forms a degenerate decision tree. The Classification process is split into several stages that each stage uses fewer weak features than would be necessary for a complete classifier. Early stages are supposed to reject as many negative samples as possible while accepting close to all positive samples, later stages then perform finer differentiation. The cascade structure avoids having to evaluate all necessary features for the whole classifier on most image windows as most input images contain few windows with positive samples. The face detection module outputs the location and attribute (frontal or profile) of detected face(s). The system utilizes the results to make decisions on the further processing.
4.2
Eye Detection
Within a detected face, the system will further detect locations of eyes for face alignment. We use a coarse to fine approach to detect location of eyes. The system first locates eyes using an iterative thresholding method based on the assumption that the iris is the darkest spot in the facial eye-region [17]. Due to the variation of intensity of an eye region for different people and lighting conditions, a simple threshold is insufficient. In our system, instead of fixing a value, the threshold value is iteratively refined until a significant dark point is located. Anthropometric constraints for eyes are applied to limit the search regions within the detected face that are most likely to contain eyes. These restraints are adapted for upright, rotated or profile detected faces. The output of the iterative thresholding algorithm is back projected onto the input image and used to mask the darkest image areas. Then, a mean-shift ascent is utilized on the masked intensity image to locate the center of the most dense, darkest area that is expected to be the iris. Usually, mean-shift is applied to probability distributions to find the local maximum of the distribution by gradient ascent. Here, it is applied directly to the masked, intensity inverted image. It is assumed that the iris and cornea represent a dark patch within the brighter sclera with the iris being the local maximum in the inverted image. The mean-shift ascent is initialized by calculating the centroid (center of mass) of the iteratively thresholded image area.
5.
EXPERIMENTAL RESULTS
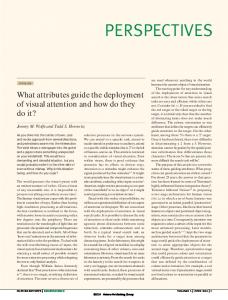
We evaluate performances of our system using two different datasets: the CAS-PEAL face database and a self collected dataset. The CAS-PEAL face database contains 99,594 images of 1,040 individuals (595 males and 445 females) with varying Pose, Expression, Accessory, and Lighting (PEAL). For our purpose, we selected images with pose variations described by pan angles of [−45 ◦ , −30 ◦ ,−15 ◦ , 0 ◦ , 15 ◦ ,30 ◦ , 45 ◦ ] and tilt angles of [−45 ◦ , 0 ◦ , 45 ◦ ], which are 21 poses. From the CAS-PEAL face database, we randomly selected 300 individuals for the training set, and other individuals for testing. Various poses with different pan and tilt angles for a subject are shown in Fig.2. We use the CAS-PEAL dataset to evaluate performances of eye detection and the LDP method because the dataset has provided ground truth of the data.
5.1
Figure 2: An illustration of 21 head poses of one subject in the CAS-PEAL dataset.
Eyes Localization Accuracy
The accuracy of eye localization is crucial for face alignment and head pose estimation. We tested the accuracy of the eye detection module using 21,840 images in 21 head poses form the CAS-PEAL
18000 16000 14000 12000 10000 8000 6000 4000 2000 0
0
0.5
Relative Eye Width
1
1.5
Figure 3: The histogram of the distance between the estimated eye location and ground truth vs eye width. dataset. Since a pupil is movable inside of an eye, we use a relative error of a half of eye width to measure the accuracy, i.e., we consider the output of the eye detection is correct if it is within the range of the eye. The experiment shows that 85% points of the output are correct within 0.5 eye width. Fig.3 shows the histogram of distance between detected eye locations and ground truth v.s. eye width.
5.2 Head Pose Estimation For the pose estimation evaluation, we carried out three experiments. In the first experiment, we provided the image patches cropped at the manually marked eyes as input, so that we can evaluate how the head pose estimators performs when there is no error caused by the misalignment. In the second experiment, the eyes are automatically localized and the head pose estimator uses face image patches cropped from locations of automatically localized eyes. In the third experiment, the head pose estimator uses faces cropped by the face detector only. In the first experiment, we also compare our method with LDA (Linear Discriminant Analysis) and LPP methods. Fig.4 shows a comparison of three methods with dimensionality reduction. Our LDP method outperforms other methods in all cases.
50 LDA PCA LPP LDP
45 40
Error rate (%)
35 30 25 20 15 10 5 0
0
10
20
30
40 50 60 Reduced Dimensionality
70
80
90
100
Figure 4: A comparison with other methods.
60 face cropped with manual eyes detection face cropped with automatic eyes detection face cropped with face detection only
55 50 45
Figure 6: Retrieved top-right VFOA images.
Error rate (%)
40 35
−30 ◦ , 0 ◦ , 30 ◦ . We set a Sony DV camera inside of the widow and recorded 2 sequences of sunny/cloudy conditions and 12 subjects. Seq1 is under the sunshine condition while Seq2 is under the cloudy condition. In the evaluation, we query how many times the topright item have been paid attention, Fig 6 illustrates the result of retrieved images for up-left head pose.
30 25 20 15 10 5 0
0
2
4
6
8
10 12 Head Poses
14
16
18
20
Figure 5: Performances of head pose estimation using different face alignment methods.
Fig.5 shows performances of head pose estimation using different face alignment methods. It is clear that face alignment plays an important role in pose estimation: the face aligned from the manual eye localization performs the best, and the face aligned from the face detection algorithm is the worst. x-coordinate is corresponding to the head pose in Fig.2. It is interesting to see that the automatic eye localization method performs better than the manual eye localization method in some frontal positions when eyes can be located correctly.
5.3
VFOA Application Performance
To evaluate the performance of our system in estimating customers’ VFOA in the display window scenario, we have collected a dataset in a simulated setting. We put 9 marks on a large display window in a commercial street and ask subjects to pass to stand in front of the window looking at these 9 marks. These marks roughly correspond to the view angles of tilt degree −30 ◦ , 0 ◦ , 30 ◦ , and pan angles
we also randomly selected 638 frames of images from the recorded video. Table 1 reports the evaluation results under different weather conditions. Seq2 is better than Seq1 because the eye location is more correct in cloudy condition. Fig.7 shows some examples of VFOA detection results that output from the system interface. The red rectangles denote the detected faces, and the green arrows indicate the classified directions of VFOA. Table 1: Comparison under different conditions( # of Frames) Seq Total face de- eye de- corrected frames tected tected VFOA Seq1 400 381(95.3%) 351(87.8%) 302(75.5%) Seq2 238 228(95.8%) 223(93.7%) 203(85.3%)
6. CONCLUSIONS In this paper, we have presented a system for monitoring customers’ VFOA in a display window using head pose estimation. Our work makes contributions in term of problem formulation and head pose estimation using the LDP method. Our approach to the problem has balanced robustness, accuracy, and speed for this particular application. We have evaluated the performance in CAS-PEAL Database with 21 head poses and a self collected dataset with 9 head poses in a realistic application setting. The experimental results indicate that our approach outperforms other methods in estimating head poses and show promising performance using a fully automatic system in
Figure 7: Examples of VFOA detection from video sequences (the red frame denotes the detected face, the green arrow denotes the attention). monitoring customers’ VFOA in a display window. We will further improve the accuracy of the system and apply the system to a more realistic environment. The developed technology can be applied to customer analysis and other multimedia applications.
7.
ACKNOWLEDGMENTS
This research was partially supported by the gift grants from the Microsoft; General Motors, grants from NSF(No. IIS-0534625), NIH(No. 1U01 HL091736 01). The first author was also partially supported by the scholarship from China Scholarship Council.The second author was also partially supported by the InterAct scholarship. The work was performed while the first and second authors were visiting Carnegie Mellon University.
[9]
[10]
[11]
[12]
8.
REFERENCES
[1] M. Belkin and P. Niyogi. Laplacian eigenmaps for dimensionality reduction and data representation. Neural Computation, 15(6):1373–1396, 2003. [2] B. Brumitt, J. Krumm, B. Meyers, and S. Shafer. Let there be light: Comparing interfaces for homes of the future. IEEE Personal Communications, 2000. [3] L. Chen, L. Zhang, Y. Hu, and H. Zhang. Head pose estimation using fisher manifold learning. Proceeding of IEEE International Workshop on Analysis and Modeling of face and Gesture, 2003. [4] Y. Fu and T. Huang. Graph embedded analysis for head pose estimation. Proceeding of IEEE International Conference Automatic Face and Gesture Recogntion, 2006. [5] W. Gao, B. Cao, and S. S. et.al. The cas-peal large-scale chinese face database and baseline evaluations. IEEE Trans. System, Man and Cybernetics-Part A: Systems and Humans, 38(1):149–161, 2008. [6] X. He, S. Yan, Y. Hu, P. Niyogi, and H.-J. Zhang. Face recognition using laplacian faces. IEEE trans. Pattern Analysis and Machine intelligence, 27(3):328–340, 2005. [7] J. Hu, W. Deng, J. Guo, and W. Xu. Locality discriminating indexing for document classification. ACM SIGIR’07, pages 689–690, 2007. [8] Y. Hu, L. Chen, Y. Zhou, and H. Zhang. Estimating face pose by facial asymmetry and geometry. Proceeding of IEEE
[13] [14]
[15] [16]
[17]
[18]
[19]
[20]
International Conference Automatic Face and Gesture Recogntion, 2006. S. Langton. The mutual influence of gaze and head orientation in the analysis of social attention direction. The Quaterly Journal of Experimental Psychology, 53. S. Li, Q.-D. Fu, L. Gu, B. Scholkopf, Y. Cheng, and H. Zhang. Kernel machine based learning for multi-view face detection and pose estimation. Proceeding of IEEE International Conference on Computer Vision, 2001. Z. Li, Y. Fu, J. Yuan, T. Huang, and Y. Wu. Query driven localized linear discriminant models for head pose estimation. Proceeding of IEEE International Conference on Multimedia & Expo, 2007. P. Maglio, T. Matlock, S. Campbell, S. Zhai, and A. Smith. Gaze and speech in attentive user interfaces. Proceedings of the Third International Conference on Advances in Multimodal Interfaces, 2000. A. Pece. From cluster tracking to people counting. Proceeding of 3rd PETS Workshop, 2002. B. Raytchev, I. Yoda, and K. Sakaue. Head pose estimation by nonlinear manifold learning. Proceeding of IEEE International Conference on Pattern Recognition, 4:462–446, 2004. S. Roweis and L. Saul. Nonlinear dimensionality reduction by locally linear embedding. Science, 290:2323–2326, 2000. K. Smith, S. Ba, D. Gatica-Perez, and J. Odobez. Tracking the multi person wandering visual focus of attention. Proceeding of 8th International Conference on Multimodal Interfaces, pages 265–272, 2006. R. Stiefelhagen and J. Yang. Gaze tracking for multimodal human-computer interaction. Proceedings of ICASSP, pages 2617–2620, 1997. J. Tenenbaum, V. de Silva, and J. Langford. A global geometric framework for nonlinear dimensionality reduction. Science, 290:2319–2323, 2000. P. Viola and M. Jones. Robust real-time object detection. International Journal of Computer Vision, 57(2):137–154, 2004. A. Yarbus. Eye movements and vision. New York Plenum press, 1967.