Florentin Dorian Vintila2 and John K Tsotsos1,2. 1Department of Computer Science and ... {fvintila, tsotsos}@cse.yorku.ca. Abstract. Motion detection and ...
Motion Estimation Using a General Purpose Neural Network Simulator for Visual Attention
1
Florentin Dorian Vintila2 and John K Tsotsos1,2 Department of Computer Science and Engineering, York University, Toronto Ontario 2 Centre for Vision Research, York University, Toronto Ontario {fvintila, tsotsos}@cse.yorku.ca Abstract
Motion detection and estimation is a first step in the much larger framework of attending to visual motion based on Selective Tuning Model of Visual Attention [1]. In order to be able to detect and estimate complex motion in a hierarchical system it is necessary to use robust and efficient methods which encapsulate as much information as possible about the motion together with a measure of reliability of that information. One such method is the orientation tensor formalism which incorporates a confidence measure that propagates into subsequent processing steps. The tensor method is implemented in a neural network simulator which allows distributed processing and visualization of results. As output we obtain information about the moving objects from the scene.
1. Introduction The problem of attending to motion has attracted much research in the past years and it is well known that the accurate estimation of the visual motion plays an essential role in an attentional system especially in the case of complex motion. Motion estimation is subject to statistical and systematic errors depending on the noise level and image content. Thus, to quantify the reliability and precision of the results, motion estimation always needs to be combined with appropriate confidence measures to quantify the measurement precision. In such a system information representation becomes crucial. An object may appear in many different orientations, sizes and projections. In order that this variability is handled efficiently a unique descriptor is necessary to represent different types of features. This characteristic is called invariance of representation [2]. Another characteristic of information representation implies that transformations
IEEE Workshop on Applications of Computer Vision (WACV'07) 0-7695-2794-9/07 $20.00 © 2007
of a feature are reflected in transformations of the representation. This is the concept of equivariance which was introduced by Wilson and Knutsson [3]. Finally, different features must be represented by the same descriptor and different descriptors must indicate different features - the uniqueness characteristic. These three requirements of information representation are met by the tensor representation of orientation. The strength of the tensor representation is that it incorporates a measure of reliability of data, which makes it possible to explore the utility of confidence measures throughout the motion process. The orientation tensor can be obtained by performing a weighted summation of pre-calculated, filter specific, tensors, the weights being the quadrature filter output magnitudes. We used the recursive method developed in [4] for separation of spherically separable quadrature filters into simple kernels. In three dimensions, that in our case are 2D space and one time dimension, we distinguish three principal categories of local topologies: a) planar neighborhood. b) linear neighborhood. c) isotropic neighborhood. These can be discriminated by just looking at the relative size of the eigenvalues of the tensor. Interpreting these cases in space-time, they correspond to ideal situations of a) a moving or stationary line or a sudden change of the whole neighborhood b) a moving/stationary points c) no movement. The difference between moving and stationary is given by the angle that the eigenvectors make to the time direction; this will be explained in detail below. We will extract the velocity field, as an orientation field in the spatiotemporal domain, and visualize it using a color coding of the orientation and magnitude of speed. For implementation we used a general purpose neural network simulator (www.tarzann.org) developed for implementation of different computational models related to visual attention.
2. Tensor representation of orientation What is the optimal representation of orientation that is suitable for further processing? We begin by analyzing the orientation in the two-dimensional case. The most obvious representation for orientation is a scalar (for example the angle between the coordinate system and the principal axes of the structure). The disadvantage with the scalar representation is that it is not possible to restrict the scalar quantity to the interval [0, π ] and at the same time to make it continuous there is a 'jump' between the two end-points of that interval. Using the vectors for representing the orientation, for example the gradient vector, does not solve the problem. Although this vector gives a continuous representation, it is defined mod(2π ) . The vectors x and -x do not map to the same value. This vector representation introduced by Granlund [5] does not work in the 3 dimensional case. The solution proposed by Knutsson [6] is to find a mapping that maps the original space into a suitable representation space and meets the three basic requirements: 1. uniqueness: the vectors x and -x should map to the same value. 2. uniform stretch: preservation of the angle metric of the original space. 3. polar separability the magnitude of the mapped vector should be independent of the direction of the original vector. Such a mapping is obtained if we take the dyadic product of vector and normalize the resulting tensor with the magnitude of the vector:
T≡
xxT x
(1)
From this equation it follows that T is also positive semidefinite and at most of rank one in the case of simple signals. To show how the construction of the tensor describes the local orientation we consider a vector v (x) that contains the orientation vector r (x) . Using the structure tensor we estimate the orientation r (x) within a local neighborhood U irrespective of the sign of v. From its components the symmetric tensor can be constructed in the following way [7] :
J ( x) = ∫ v( x′)v T (x′)dx′
(2)
U
The projection of vector v onto the direction r is represented by the inner product. If both vectors are perpendicular to each other the inner product vanishes and if they are parallel or point into opposite directions
IEEE Workshop on Applications of Computer Vision (WACV'07) 0-7695-2794-9/07 $20.00 © 2007
it reaches a maximal or minimal value. The vector r (x) that constitutes an estimate for the mean orientation within the local neighborhood U maximizes the following expression:
∫ (v
T
( x′)r ( x)) 2 dx′
(3)
U
With the tensor notation (1) this expression can be written as: rTTr →maximum , which reaches a maximum if the vector r (x) is given by the eigenvector of the tensor T to the maximum eigenvalue. This maximization problem is equivalent to an eigenvalue problem which implies that the structure tensor becomes diagonal in a coordinate system that is spanned by the eigenvectors {ek}. The solution, which is defined by finding the orientation, is given by the eigenvector corresponding to the maximum eigenvalue. In this way the relevant information contained in the structure tensor is extracted by computing its eigenvalues and eigenvectors. The eigenvalue decomposition can be written as: (4) T = ∑ λk e k e Tk k
where λ1 ≥ λ2 ≥ " ≥ λ n are the eigenvalues and {ek.} are the corresponding eigenvectors. In three dimensions the orientation tensor can be thought of as an ellipsoid with its three axes oriented along the tensor’s three perpendicular eigenvectors and with the semi-axis lengths proportional to the square root of the eigenvalues of the tensor. The analysis of the eigenvalues of the structure tensor in 3D introduces the different cases shown below[8]: 1. The plane case: λ1 � λ2 = λ3 T1 = λ1e1e1t The signal is constant on parallel planes and the Fourier transform of the signal is concentrated on a line with e1 being the normal vector of the planes in the spatial domain and a direction vector of the lines in the Fourier domain. 2.The line case: λ1 = λ2 � λ3 T2 = λ1 (e1e1t + e 2e 2t ) The signal is constant on parallel lines. The Fourier transform of the signal is concentrated on a plane, with e1 and e 2 being perpendicular to the lines in spatial domain and spanning the plane in the Fourier domain. The orientation of the lines is given by the eigenvector corresponding to the smallest orientation. 3.The isotropic case: λ1 = λ2 = λ3 T3 = λ1 (e1e1t + e 2 e 2t + e3e3t )
The signal is isotropic or rotationally symmetric. There exists energy in the neighborhood but no dominant orientation. The orientation can be represented as a linear combination of three tensors. The first corresponds to a simple neighborhood, i.e. locally planar, the second to a rank 2 neighborhood, i.e. locally constant on lines, and the last term corresponds to an isotropic neighborhood, e.g. non-directed noise. Based on this decomposition, the tensor can be visualized as a sum of a spear, a disc and a sphere. The spear describes the principal direction of the tensor λ1e1e1T where the length is proportional to the largest eignevalue λ1 . The disc describes the plane spanned by the eigenvectors corresponding to the two largest eigenvalues λ2 (e1e1T + e 2 eT2 ) . The sphere with a radius proportional to the smallest value shows how isotropic the tensor is λ3 (e1e1T + e 2 eT2 + e3e3T ) . The regions where motion is present are anisotropic regions in the spatiotemporal cube. We have to filter the tensor field in order to enhance the anisotropy represented by the cases spear and disc and to discard isotropy represented by sphere case. The literature provides different measures of confidence for the anisotropy based on tensor decomposition mentioned above. We have chosen to use the ones proposed by Baerman et al [9] due to simple geometric motivation behind: λ λ −λ λ −λ csphere = 3 cdisc = 1 2 cline = 2 3 (5) λ1 λ1 λ1
3.Tensor construction based on quadrature filters Knutsson has shown that a tensor representation of local orientation can be produced by combining the outputs from polar separable quadrature filters [9]. The structure tensor is constructed by probing Fourier domain in several directions with filters that each pick up energy in an angular sector in a particular direction. These filters are complex-valued quadrature filters for which the impulse response is real and non-zero only in one half of the Fourier space. The quadrature filters used for constructing the tensor are spherically separable in the Fourier domain. The tensor is constructed by using the filters’ response magnitude as a coefficient in a linear summation of basis tensors: (6) T = ∑ q Mk k
k
IEEE Workshop on Applications of Computer Vision (WACV'07) 0-7695-2794-9/07 $20.00 © 2007
where M k is dual of the outer product tensor. k N = nk nkT .The mathematical expression for M depends of the angular distribution of the filters. k
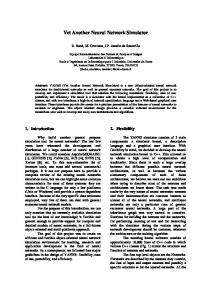
3.1. Sequential filter network In order to perform general and invariant processing it is necessary that the filtering process support a continuous representation of orientation. To reduce the computational demand a limited number of filters were applied at each neighborhood and the partitioning of the orientation space was coarse and incomplete. This approach narrows the range and complexity of tasks on which it can be applied and increases the inaccuracy of the estimates. We use an efficient implementation of the quadrature filtering method that is described in [4] [10]. An efficient way to approximate a given filter, given N coefficients, is to distribute them over a number of smaller filters, which would then be applied in sequence. This is based mainly on the fact that computational complexity of the filtering process is directly proportional to the number of kernel coefficients but it is independent of the spatial coordinates for these coefficients. The quadrature filter responses are computed in three steps. The first two components are real valued and are both oriented in directions orthogonal to the filter orienting vectors. The last component is complex valued and directed along the main direction of the ideal filter. If we used 6 conventional 3D 9x9x9 quadrature filters the number of multiplications would have been almost 9000. In the case of the filter network that we used the number of multiplications are about 350 [10].
Figure 1. Filter structure to compute 3D quadrature filter outputs in 9 directions
4. Velocity estimation We can obtain the velocity field by projecting the eigenvector corresponding to the largest eigenvalue onto the image plane. As we have already shown (5) by examining the relations between the eigenvalues of the orientation tensor the velocity can be estimated in the plane case, corresponding to a moving line, or a line case, corresponding to a moving point. The isotropic case which corresponds to no movement is discarded. The following expression have been used for calculating the velocity [11] 1. moving point � � v p o in t = ( x1 ⋅ ξ 1 + x 2 ⋅ ξ 2 ) / x 3 � � x1 = e 3 ⋅ ξ 1 � � x 2 = e3 ⋅ ξ 2 � � x3 = e3 ⋅ t
(7) 2. moving line � � v lin e = − x 3 ( x1 ⋅ ξ 1 + x 2 ⋅ ξ 2 ) /( x12 + x 22 ) � � x1 = e 1 ⋅ ξ 1 � � x 2 = e1 ⋅ ξ 2 � � x3 = e1 ⋅ t
(8) � � Where ξ1 and ξ 2 are the orthogonal unit vectors � defining the image plane and t is a unit vector in the time direction.
5. Implementation To implement our model for motion estimation we used a publicly available neural network simulator TarzaNN (www.tarzann.org) [12]. TarzaNN is a multiplatform software package written in ANSI C++ and using QT libraries. It allows different models of visual attention to be implemented in a unified framework and accepts input images in a wide variety of file formats, or directly from a camera. TarzaNN is composed of “feature planes” (FP) interconnected by filters. Feature planes are 2D arrays of neurons characterized by identical properties (neuron type, neuron parameters) and receptive fields. Filters are 2D definitions of receptive fields, and they describe how the output of a feature plane is connected to the neurons of another one (like the arrays of weights in classical neural networks). An element of a FP, say, at position (i,j), takes its input from other FPs, namely, from elements that are in a neighborhood of the corresponding position (i,j) in their FP. Strictly speaking, FPs do not need to have the same size - as
IEEE Workshop on Applications of Computer Vision (WACV'07) 0-7695-2794-9/07 $20.00 © 2007
this provides a tool for the scale hierarchy - but they are resized on the fly to adapt to each other. Each FP has an optional sub-window in the graphical user interface of TarzaNN, so that its contents are visible to the user. The value of each element is converted to a 256 values level of gray by default or color if this is requested explicitly in the code. The flexibility of simulator and the XML-based model description have allowed us to implement efficiently our model for motion estimation. We implemented the processing of image sequences by treating them as three-dimensional arrays of pixels. The corresponding feature plane structure for the image sequence consists of individual frame images placed one atop the other, starting with the first frame at the top. The image sequences corresponding to each FP can be displayed as a succession of individual frames by using auxiliary feature planes that store and display one frame at a time The network structure used for simulation consists of five layers of feature planes. The filtering is performed in 4 levels where the three first are real valued and the last is complex. The first layer is the input layer which contains the input sequence. The input layer is connected to the second layer of 3 feature planes by low-pass filters. The third layer contains 9 feature planes. Each FP from the second layer is connected by 3 filters to a FP from third layer. The fourth layer is composed of 9 FP and contains the images after quadrature filters. The fifth layer is the output layer of a nonlinear function in which are fed the outputs from quadrature filters. This nonlinear function computes the local tensor and discriminates the three cases (line, plane, and sphere). We calculate for each point in the image sequence the certainty measures csphere, cdisc and cline. If csphere is greater than a threshold TC then we have only isotropic noise patterns. Otherwise, we have to decide if we have a moving point (line case) or a moving line (plane case). This is done by comparing cline with cdisc multiplied by a second threshold TS, used to discriminate between line and plane case. If cline is greater then we are in the line case, if smaller, in the plane case. Finally, for the corresponding case we compute the direction and magnitude of velocity with formulas (7) (8).
6. Results We illustrate the motion estimation using 2 synthetic and a real scene sequence. All of them contains grey scale images, have a resolution of 128x128 pixels and are 11 frames long. Better results can be obtained by using a longer sequence, but we can better present the
visualization of the whole sequence using only 11 frames. The first simple synthetic sequence represents a shrinking octagon. For this sequence we present a screenshot from TarzaNN (fig. 2) in which can be seen, in the left, the input sequence, in the right, the output sequence, and in the middle the images of 9 feature planes corresponding to the outputs of 9 quadrature filters. In the output sequence it can be seen how the movement is coded by color. The direction of velocity is visualized as the hue of color using the color diagram from fig.3. Each point in the diagram represents a vector with the origin in the centre of the circle. Its color is mapped to a velocity vector which has the same direction and a proportional magnitude. The hue of color encodes the direction and the intensity the magnitude. Since the movement is uniform the intensity is the same. The first 4 frames and the last 4 frames from the output represent the transitory response.
Figure 2. Screenshot from TarzaNN representing motion estimation from shrinking octagon
Figure 3. Color coding diagram
The second, more complex, synthetic sequence is the Yosemite sequence (fig.4). The motion is divergent excepting the clouds in the upper right which translate to right with a speed of 2 pixels/frame. In the lower left corner the velocity is about 5 pixels/frame. In middleright part of the image the velocities are very low and the contrast very poor, causing the intensity of colors, which represents the magnitude of velocity, to fade to black. We present the correct flow field in the right image provided in [13] and the color coded velocity following the color coding diagram from fig. 3.
IEEE Workshop on Applications of Computer Vision (WACV'07) 0-7695-2794-9/07 $20.00 © 2007
Figure 4. Left: Color coded velocity field of the Yosemite sequence. Right: correct flow field
For the real scene experiment we used the Hamburg taxi sequence (fig.5). In this scene there are three noticeable moving objects: a taxi turning around the corner, a car moving to the right and a van moving to the left. The figure (2) shows the central frame of the sequence (frame 6) and the corresponding input frame.
Figure 5. Left: Central frame of the Hamburg taxi sequence. Right: Color coded motion estimation
The filters used have size 5x7x7 or 5x9x9 (or permutations) and have the origin in the middle of their support. This means that the value of the filtered signal at a point may depend on pixel values of the input that are up to 4 pixel away of that point. In particular, the frames may show a bigger "smearing" of the objects in the direction of their movement. As a consequence, the faster the object moves the greater is the color spot representing the object. To test the performance of our implementation for optical flow estimation we use a simple sinusoidal plaid pattern which consists of two superposed sinusoidal plane-waves both moving with speeds of 1 pixel/frame at 0 and 90 degrees orientation for a perceived velocity of (1,1) pixels/frame. The average angular error (AAE) obtained is 6.67 סat a standard deviation (Std) of 4.75 ס. Although the AAE is quite good it is outperformed by many methods for optical flow estimation for this simple synthetic pattern [13], [14]. Nevertheless, for the more complex Yosemite
sequence (fig 4.) the performance is among the best ones (AAE: 10.12, Std: 12.23). Unfortunately, for the taxi real scene sequence we do not have the ground truth motion field. Though there are many real scene test sequences available, determining the ground truth motion field for real scene test sequences is not possible. Due to space restriction we only presented an overall comparison with other algorithms. For a detailed comparison the reader is referred to the papers [13], [14]. For computing the optical flow we used thesholding when the minimum confidence level was less than a certain value. However, the confidence measure is embedded in the tensor field, from which we extracted the velocity flow field and thus the whole information is further passed to superior levels and not discarded by thresholding. As a consequence, we expect that for complex motion fields (involving occlusions, transparencies, illumination, variations, and multiple motions) the accuracy of velocity flow field extracted from tensor field to be better than other methods. In comparison to the method presented in [16] for motion estimation our implementation, based on tensor formalism, reveals its superiority by including a confidence measure that permits the system to isolate reliable input data and to discriminate 2-d velocity from normal velocity. Moreover, beside the lack of confidence measure in the former method the direction selectivity is restricted to 12 directions.
7. Conclusions and future work We presented the first stage, of a two-stage process of attending to complex motion patterns, in which we extracted the velocity field as orientation field in spatiotemporal domain and obtained a description of local structure in terms of the orientation tensor. In the second stage we will use the topology of the flow field to detect complex motion patterns as in [16]. Given the spatiotemporal tensor field which incorporates the patterns of motion and associated confidence, we can, at the top level, locate and identify different classes of motion to which to attend. Since we are interested in obtaining the topology of the flow field our implementation is not optimized for obtaining the minimum average angular error for the velocity field as the measure of performance of motion estimation. The final goal of the project i.e. detection of complex motion patterns based on the topology of the flow field is not necessarily achieved by individual optimization of the intermediate results.
IEEE Workshop on Applications of Computer Vision (WACV'07) 0-7695-2794-9/07 $20.00 © 2007
8. References [1] J. K. Tsotsos, M. Pomplun, Y. Liu, J. C. MartinezTrujillo, E. Simine “Attending to Motion: Localizing and Classifying Motion Patterns in Image Sequences.” Biologically Motivated Computer Vision, 2002, pp. 439-452. [2] G.H. Granlund, “The Complexity of Vision”, Signal Processing, Vol. 74, 1999 pp.101-146. [3] R.Wilson and H.Knutsson, “Uncertainty and Inference in the Visual System”, IEEE Trans. on Systems, Man and Cybernetics, 18(2), 1988, pp.305-312. [4] H.Knutsson, M.Andersson, and J.Wiklund. “Advanced filter design”. In Proc. of SCIA, Kangerlussuaq, Greenland, 1999. [5] G.H. Granlund, “In search of a general picture processing operator” Computer Graphics and Image Processing, 8:155(173), 1978. [6] H.Knutsson, “Representing local structure using tensors”, The 6th Scandinavian Conference on Image Analysis , Finland, 1989, pp. 244-251. [7] B.Jaehne, H.Haussecker, H.Scharr, H.Spies, D.Schmundt, and U.Schurr. “Study of dynamical processes with tensor-based spatiotemporal image processing techniques”, ECCV, 1998, pp. 322-336. [8] C.F. Westin, H, Knutsson, “Estimation of motion vector fields using tensor field filtering”, Proc. IEEE Int. Conf. on Image Processings, Austin, Texas, 1994, pp.237-242. [9] H.Baerman, L.Haglund,, H. Knutsson, G. Granlund,, “Estimation of velocity, acceleration and disparity in time sequences” Proc. IEEE Motion Workshop, Princeton, 1991, pp. 44-51. [10] M. Andersson, J Wiklund and H. Knutsson, “Sequential Filter Trees for Efficient 2D, 3D and 4D Orientation Estimation”, Report LiTH-ISY-R-2070, Linköping University, November 1998. [11] G. H. Granlund and H. Knutsson. Signal Processing for Computer Vision, Kluwer, Academic Publishers, 1995. [12] A.L. Rothenstein , A. Zaharescu, J.K. Tsotsos, “A General Purpose Neural Network Simulator for Visual Attention Modeling” Workshop on Attention and Performance in Computational Vision (WAPCV 2004), Prague, 2004, pp. 165-167. [13] L. Barron, D.J. Fleet, and S.S. Beauchemin. “Performance of Optical FlowTechniques”, Int. Journal of Computer Vision, 12(1): 1994, pp.43–77. [14] H.Haussecker, H. Spies, “Motion” in Handbook of Computer Vision and Applications, B. Jaehne, H. Haussecker and P. Geissler, pp. 309-96, Acad. Press 1999. [15] Spies and H. Scharr, “Accurate optical flow in noisy image sequences”, Proc. Int. Conf. Computer Vision, vol. 1, 2000, pp. 587–592. [16] J.K. Tsotsos, Y. Liu, J. Martinez-Trujilo, M. Pomplun, E. Simine. K. Zhou, “Attending to Motion”, Computer Vision and Image Understanding, vol. 100, 2005, pp 3-40.