© ACM 2015. This is the author's version of the work. It is posted here for your personal use. Not for redistribution. The definitive Version of Record was published in Proceedings of the 22nd European MPI Users' Group Meeting, http://dx.doi.org/10.1145/2802658.2802664
MPI-focused Tracing with OTFX: An MPI-aware In-memory Event Tracing Extension to the Open Trace Format 2 Michael Wagner
Jens Doleschal
Andreas Knüpfer
Center for Information Services and High Performance Computing (ZIH) Dresden, Germany
Center for Information Services and High Performance Computing (ZIH) Dresden, Germany
Center for Information Services and High Performance Computing (ZIH) Dresden, Germany
[email protected]
[email protected]
[email protected]
ABSTRACT
1.
Performance analysis tools are more than ever inevitable to develop applications that utilize the enormous computing resources of high performance computing (HPC) systems. In event-based performance analysis the amount of collected data is one of the most urgent challenges. The resulting measurement bias caused by uncoordinated intermediate memory buffer flushes in the monitoring tool can render a meaningful analysis of the parallel behavior impossible. In this paper we address the impact of intermediate memory buffer flushes and present a method to avoid file interaction in the monitoring tool entirely. We propose an MPI-focused tracing approach that provides the complete MPI communication behavior and adapts the remaining application events to an amount that fits into a single memory buffer. We demonstrate the capabilities of our method with an MPI-focused prototype implementation of OTFX, based on the Open Trace Format 2, a state-of-the-art Open Source event tracing library used by the performance analysis tools Vampir, Scalasca, and Tau. In a comparison to OTF2 based on seven applications from different scientific domains, our prototype introduces in average 5.1 % less overhead and reduces the trace size up to three orders of magnitude.
High performance computing (HPC) systems provide enormous computational resources. But the increasing performance includes an increasing complexity, as well. Current leading edge HPC systems consist of millions of heterogeneous processing elements [17]. They require consideration of parallel execution, network, system topology, and hardware accelerators. Building on top of these architectures there is a variety of different parallel programming models such as message passing (MPI), threading and tasking (OpenMP), one-sided communication (PGAS), and architecture specific models like interfaces to incorporate hardware accelerators such as GPUs. Appropriate support tools are inevitable to develop applications that utilize those highly parallel and complex systems. Performance analysis tools assist developers not only in identifying performance issues within their applications but also in understanding their behavior on complex heterogenous systems. The two main approaches in performance analysis are profiling and event tracing. While profiling gathers aggregated information about different performance metrics, event tracing records runtime events together with a precise time stamp and further event specific metrics. Profiling with its nature of summarization decreases the amount of data that needs to be stored during runtime. However, profiles may lack essential information and hide dynamically occurring effects. In contrast, event tracing records each event of a parallel application in detail. Thus, it allows capturing the dynamic interaction between concurrent processing elements and enables the identification of outliers from the regular behavior. In particular, event tracing records inter-process interaction, such as communication operations in MPI, individually and allows a detailed communication analysis. While single events are rather small, event-based tracing frequently results in huge data volumes. In fact, the large amount of collected data, in particular, for massively parallel or long running applications is one of the most urgent challenges for event-based monitoring tools. The large amount of collected data can massively slow down application execution and overwhelm the underlying file system. In the context of a correct analysis of the communication with the Message Passing Interface (MPI) [11] there is another critical impact of the large recorded data volumes.
CCS Concepts •Software and its engineering → Software performance; Software maintenance tools; •General and reference → Performance;
Keywords Performance analysis, Event tracing, Tools, MPI, Score-P, OTFX, OTF2, Gromacs Permission to make digital or hard copies of all or part of this work for personal or classroom use is granted without fee provided that copies are not made or distributed for profit or commercial advantage and that copies bear this notice and the full citation on the first page. Copyrights for components of this work owned by others than ACM must be honored. Abstracting with credit is permitted. To copy otherwise, or republish, to post on servers or to redistribute to lists, requires prior specific permission and/or a fee. Request permissions from
[email protected].
EuroMPI ’15, September 21-23, 2015, Bordeaux , France c 2015 ACM. ISBN 978-1-4503-3795-3/15/09. . . $15.00
DOI: http://dx.doi.org/10.1145/2802658.2802664
INTRODUCTION
For optimized file interaction in the event monitor, recorded event data is internally buffered [2]. Whenever such an internal memory buffer is exhausted the data is stored at the file system, which leads to a noticeable interrupt of application execution. Since each process collects different events or at least events with different parameters (e.g. time stamps), each memory buffer is exhausted at a different time and, therefore, the parallel processes are interrupted uncoordinatedly. With their disruptive character, uncoordinated intermediate memory buffer flushes can falsify the recorded program behavior and either create or conceal critical performance issues, in particular, in inter-process dependencies, such as MPI communication. Imagine a simple point-topoint communication where one partner is interrupted in between storing its memory buffer in a file. Consequently, the entire measurement starting from the first initiated memory buffer flush must be considered incorrect, which renders a feasible recording of many applications impossible. With this in mind, it becomes inevitable to reduce the number of recorded events during runtime. For a performance analysis that targets MPI communication, existing tools like Score-P allow to restrict the event recording to MPI events, which results in much smaller trace size and, therefore, drastically reduces measurement bias. Recording only MPI communication events can be a valuable method to study communication, for instance, communication patterns and communication inefficiencies. However, the recorded communication events lose their context within the application behavior, for instance, it can not be determined anymore, which application context triggered an inefficient communication pattern. Thus, the missing context of communication events makes it difficult or even impossible to infer information for performance optimization. As a result, users have to decide between either an MPI-only trace that allows a correct but context-free communication analysis or a complete trace that may contain falsified behavior. Our contribution in this paper is a new approach called MPI-focused tracing to circumvent those restrictions. MPIfocused tracing allows a compromise between both existing approaches by providing the complete MPI communication behavior and adapting the remaining application events to an amount that fits into a single memory buffer. This way, the context of the communication operations is still provided in a reduced form and at the same time the bias caused by uncoordinated intermediate memory buffer flushes is completely eliminated. Furthermore, this approach results in smaller trace sizes and, thus, reduces application slow down, measurement bias and file system stress related to the large data volumes of a complete trace. Our prototype implementation is based on OTFX, an inmemory event tracing extension to the Open Trace Format 2 (OTF2) [2], a state-of-the-art Open Source event trace library used by the performance monitor Score-P [8] and the analysis tools Vampir, Scalasca, and Tau [6, 3, 16]. For our prototype we build on existing capabilities of OTFX to support hierarchy based event reduction [22, 21] and extended it to support event filtering and event reduction that keep the complete communication information while the number of remaining application events is adapted to the leftover memory buffer space. In the following section we distinguish our work from other approaches. In Section 3, we discuss the impact of uncoordinated intermediate memory buffer flushes on the
recorded communication behavior and describe our extensions to OTFX to support MPI-focused tracing in Section 4. After that, in Section 5 we evaluate the overhead, trace size reduction, and trace analysis capabilities of our prototype. At the end, we summarize the presented work.
2.
RELATED WORK
The Open Trace Format 2 (OTF2) [2] is an event tracing format and access library used by the monitoring environment Score-P [8] and by the trace analyzers Vampir [6], Scalasca [3], and Tau [16]. It is the starting point for the OTFX in-memory extension to OTF2 and, therefore, has many similarities with our MPI-aware OTFX prototype, e.g., similar interfaces and event definitions. Today’s event tracing monitors provide different strategies to reduce the amount of collected data. Score-P can filter function calls based on their occurrence, i.e., the user can specify a value n so that all calls to a function are filtered after this function is called n times [8]. This approach, however, is less accurate than the duration filter presented in this paper, since it does not keep outliers that are particularly interesting for performance analysis. In addition, if the n is too small in long-running applications even main routines might get filtered. Score-P also supports a rewind feature that allows to statically or dynamically filter complete program phases, e.g., single iteration steps [8]. However, this approach eliminates all events of a program phase including all MPI events, which can lead to an mismatching of according MPI send and receive calls. While there exists an approach to avoid the mismatching with an unique sequential identifier [19], currently, none of the existing monitors or analyzers supports this approach. Scalasca offers a static code analysis prior source code instrumentation to exclude functions with a short source code length [13]. Paraver’s monitoring tool Extrae uses cluster and spectral analysis to reduce the number of events in traces and, thus, the traces sizes during runtime [10]. This approach forwards performance data and analyzes it on a front-end during runtime. The results are broadcasted back to the monitoring nodes, which use the information to selectively record further events. All of the above approaches differ in two ways from our proposed MPI-aware prototype. First, while all approaches can reduce the resulting trace size, they cannot adapt the trace size dynamically to fit into a single fixed-size memory buffer. As a result, for larger traces the internal measurement memory buffers get exhausted and trace data is stored at the file system, which leads to the above described bias on the recorded communication behavior. Second, none of the above approaches distinguishes MPI events for filtering; although, some have the potential to distinguish them. Consequently, MPI events are filtered just like all other events. Next to these filter methods, compressed complete call graphs (CCCG) [7] and a study of reduction techniques [12] use pattern recognition to accumulate recurring patterns to minimize trace data. While these techniques are capable of reducing the trace data to a nearly constant trace size (depending on the granularity of the aggregation), they may be very time consuming. Only [7] provides overhead results but for the other two similar overheads can be expected. In addition, ScalaTrace records only MPI communication, so no application context is provided.
Send
Receive Wait
Time
Send Receive
Processes
Receive
Flush
Processes
Processes
Processes
Send
Send Flush
Receive
Wait Time
Time
Time
Figure 1: Bias on the communication behavior due to intermediate memory buffer flushes. A typical performance issue such as the late sender can be created (left) or concealed (right) when an uncoordinated intermediate memory buffer flush occurs in between.
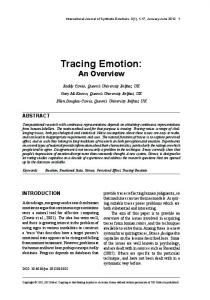
(a) 50 MiB memory buffer
(b) 1 GiB memory buffer
Figure 2: Vampir screenshot displaying the distribution of buffer flushes (violet) for (a) a 50 MiB memory buffer and (b) a 1 GiB memory buffer that also includes the resulting MPI wait times in red.
3.
DISTURBANCE OF COMMUNICATION CAUSED BY BUFFER FLUSHES
To optimize I/O interaction in the measurement infrastructure the recorded runtime events are typically stored in an internal memory buffer. Whenever such an internal memory buffer is exhausted, the data is stored at the file system. This causes a severe prolongation of the measurement activity of the last recorded event since it is stalled until the file interaction completes. While there are other methods to move the recorded data from the recording memory buffer, such as asynchronous file interaction or asynchronous network transport, all methods affect the application behavior. Out of those methods, an interrupt has the benefit of allowing to clearly identify impact on the application behavior and mark the time spent in the memory buffer flush. While the interrupt caused by such a memory buffer flush can be recorded itself and considered in the analysis of a single event stream [8], the parallel behavior is completely disturbed. Since each process collects different events or at least events with different parameters, e.g., time stamps, each memory buffer is exhausted at a different time and, therefore, the parallel processes are interrupted entirely uncoordinated. If a memory buffer flush is triggered during a communication operation, the resulting recorded behavior can differ greatly from the original uninterrupted behavior. Figure 1 demonstrates how an uncoordinated intermediate memory buffer flush can either create or conceal a communication issue with the help of the late-sender issue. The late-sender issue is a prominent example of wait times in point-to-point communication due to unsynchronized mes-
sages. As the name suggests the sender of the message sends a message after the receiver already started its receiving operation. The same effect can occur for other types of communication patterns and load imbalances. The internal memory buffers are usually rather small, e.g., 10 to 200 MiB per process [5], because most of the main memory is left to the application. Hence, unsynchronized intermediate memory buffer flushes can occur at high frequencies. For instance, a typical event frequency of one million events per second with a given event size of ten byte would cause a memory buffer of 50 MiB to flush every five seconds. For larger memory buffers the frequency of memory buffer flushes would decrease, however, the duration of the interrupt would increase. Figure 2 shows the distribution of memory buffer flushes (violet) during runtime for a typical 50 MiB and a large 1 GiB memory buffer within a measurement of the molecular dynamics package Gromacs [4] with 64 processes (for more detail see Section 5). Figure 2(b) also shows the time spent in MPI calls in red. For a bigger memory buffer size, the number of memory buffer flushes decreases but their duration increases. While for the 50 MiB memory buffer there are a total of 1985 buffer flushes with an average interrupt of 0.13 seconds, for the 1 GiB memory buffer 34 buffer flushes with an average interrupt of 8.4 seconds occur. For both memory buffer sizes the memory buffer flushes occur highly irregularly. Figure 2(b) demonstrates the resulting disruption of MPI communication. Up to the first buffer flush of process 25 at about 140 seconds the communication operations (red) require little time, as can be seen by the share of red within white, which contains everything
else within the application. However, during the first buffer flush all other processes wait for process 25 to finish its buffer flush and engage in the communication operation. After that, each buffer flush causes the same behavior, which can be seen by the red blocks on each process that have the same length as the buffer flush of one of the processes. Comparing the communication behavior before the first buffer flush and afterwards clearly shows the effect of uncoordinated buffer flushes on the recorded application behavior. MPI wait times due to buffer flushes Time spent in buffer flushes Runtime w/o buffer flushes and wait times
Runtime
500s 400s 300s 200s 100s
50MiB
100MiB
200MiB 500MiB Buffer Size
1GiB
2GiB
Figure 3: MPI wait times caused by intermediate memory buffer flushes. Figure 3 looks at the same issue from another angle. It shows the total runtime of Gromacs in comparison to the MPI wait times caused by memory buffer flushes for different memory buffer sizes. The blue share of each bar depicts the runtime of Gromacs excluding memory buffer flushes and the resulting MPI wait times. The orange share equals the time actually spent in memory buffer flushes while the red share shows MPI wait times caused by buffer flushes; mainly in MPI_SendRecv, MPI_Recv, and MPI_Waitall. For a memory buffer size of 2 GiB the trace fits into a single memory buffer, consequently, there are no intermediate buffer flushes for this size. Figure 3 shows that the MPI wait times due to memory buffer flushes are about 64 times higher than the time actually spent in buffer flushes and is about 55 % of the total runtime. It is obvious, that a communication analysis based on such a trace must lead to a misinterpretation of the communication behavior. In the above case, the trace shows the time spent in MPI calls averages at 287 seconds per process, while actually only about 63 seconds are spent in MPI communication (see also Figure 6).
4.
EXTENSIONS FOR MPI-FOCUSED INMEMORY TRACING
The only way to eliminate the bias of uncoordinated intermediate memory buffer flushes is by eliminating the memory buffer flushes themselves. In this sense, only a drastic reduction of memory requirements during runtime would avoid such bias. The OTFX tracing library is specifically designed to support in-memory event tracing by drastically reducing the amount of tracing data during runtime. OTFX is a prototype implementation based on the Open Trace Format 2 [2] and includes different filters, e.g., a filter based on runtime function duration [18], enhanced encoding techniques [20], and runtime event reduction [22] to dynamically adapt trace size during runtime to the given memory allocation.
OTFX accepts events in the same way as OTF2. In a first step these events are automatically filtered. For our setup, we only apply a filter that eliminates all function calls that are shorter than a minimum duration. This way, frequently used short-running functions that can easily overwhelm the recording memory buffer are effectively filtered while outliers that have an impact on the application behavior remain within the event trace data [18]. The remaining events are stored by applying the enhanced encoding techniques that allow a higher memory efficiency, which reduces the memory allocation during runtime up to an factor of 5.8 without increasing the overhead of the event tracing library [20]. The third step, called event reduction, dynamically adapts trace size during runtime to the given memory allocation by eliminating events already stored in the memory buffer. This way, OTFX guarantees that an event trace of arbitrary size fits into a single fixed-size memory buffer. Criteria for event reduction include a reduction by event class, e.g., functions, communication, or performance metrics; a reduction by the calling depth, i.e., start elimination with the events that have the highest calling depth; and a reduction by the duration of function calls. The different event reduction strategies are discussed in detail in [22]. We extended the existing OTFX prototype to support MPI-focused in-memory tracing. The extended prototype with MPI-focused tracing provides the complete MPI communication behavior and adapts the remaining application events to an amount that fits into a single memory buffer. This way, the communication behavior is kept entirely and the context of the communication operations is provided in a reduced form. Since OTFX applies the filtering and event reduction on all events equally, we extended the existing prototype with MPI-aware filters and reduction strategies. Figure 4 depicts the difference in the resulting trace file based on an exemplary trace. It contains a simplified timeline view of a single process with the current activity over time on the horizontal axis and the call stack on the vertical axis. Figure 4(b) shows the effect of the standard OTFX filtering and event reduction. In this hypothetical scenario all short function calls are filtered and the calling depth is reduced to two to adapt the trace size to fit into a single memory buffer. As a result all short function calls and all function calls at call stack level three are eliminated. This includes the intended removal of baz within foo_2 and the short calls of bar within foo_3. However, the send and receive call within foo_2 and the short send call within foo_3 are eliminated, as well. Figure 4(c) shows the resulting trace with the new MPIaware OTFX filtering and event reduction. Again, all short function calls are filtered and the calling depth is reduced to two to adapt the trace size to fit into a single memory buffer. But, the send and receive calls within function foo_2 and the short send call within foo_3 are kept. Only the nonMPI calls that match the filter and reduction criteria are eliminated: baz within foo_2 and the short calls of bar within foo_3. The MPI-aware extension utilizes OTFX’s underlying Hierarchical Memory Buffer [21]. The Hierarchical Memory Buffer is a new data structure that uses additional hierarchy information of events, such as calling depth or event class (enter/leave, communication, hardware performance counters etc.), to presort events according to these hierarchy attributes. It is organized as a multi-dimensional array,
Call Stack
0 1 2
main foo_1 Send
foo_2 Recv
Send
3
foo_3
bar
S Recv
Recv
b
b
baz Time
Call Stack
(a) Complete trace. 0 1 2
main foo_1 Send
foo_2 Recv
foo_3
bar
Recv
3 Time
Call Stack
(b) Trace with OTFX filtering and event reduction. In this hypothetical scenario all short functions are filtered and the calling depth is reduced to two. As a result, the send and receive calls within function foo_2 and the short send call within foo_3 next to the short calls of bar are eliminated. 0 1 2 3
main foo_1 Send
foo_2 Recv
foo_3
bar Send
S
Recv
Recv Time
(c) Trace with MPI-aware OTFX filtering and event reduction. Again, all short functions are filtered and the calling depth is reduced to two. But, the send and receive calls within function foo_2 and the short send call within foo_3 are kept while baz and the short calls of bar are eliminated. Figure 4: Resulting trace with and without MPIaware OTFX filtering and event reduction.
where each hierarchy dimension represents one possible hierarchical order with a flexible number of different values within that hierarchical order. For instance, one dimension can represent the calling depth and another the event class. Instead of one huge memory chunk, the total memory allocation for the according memory buffer is divided in many small memory sections, which are dynamically distributed to any level in each dimension. A detailed description of the Hierarchical Memory Buffer can be found in [21]. With the Hierarchical Memory Buffer, the MPI-aware extension to OTFX can apply the MPI-aware filtering and event reduction without introducing additional overhead because the hierarchical ordering of events, including MPI events, is already present. The general overhead of filtering and event reduction in OTFX is at maximum 5 %. Both are discussed in detail in [18] and [21].
5.
EVALUATION
We use our MPI-aware extension of OTFX described in Section 4 to demonstrate the resulting trace size reduction and to examine the introduced overhead for the event tracing library. In addition, we evaluate the usefulness of the resulting traces for performance analysis.
5.1
Methodology and Target Applications
Event tracing libraries are usually closely coupled with the monitoring tools who use them. The makes it is virtually impossible to distinguish effects caused by the monitoring tool from those caused by the event tracing library. In addi-
tion, many parameters, e.g., function durations, deviate in each measurement run. Therefore, we do not use the OTF2 and OTFX libraries directly for the measurement. Instead, we generate an OTF2 trace with Score-P [8] and use this trace as a baseline. For the comparison run with OTFX, we replay each application from its baseline trace. This method ensures, that both traces (OTF2 and OTFX) use exactly the same input data and, thus, eliminates the effect of runtime deviations. The evaluation is based on traces of the molecular dynamics package Gromacs [4], the cloud simulation model system COSMO-SPECS+FD4 [9], the computational fluid dynamics solver Nek5000 [1], and the molecular dynamics simulator LAMMPS [14, 15]. Gromacs is an open-source software package to perform molecular dynamics for biochemical molecules like proteins, lipids and nucleic acids. The recorded trace includes 10,000 iteration blocks and was recorded on an Cray XC system. In contrast to the other applications, functions that are automatically inlined by the compiler are not instrumented and, thus, not recorded. Otherwise, the application slow down due to the highly-frequent short running function calls would prevent a meaningful analysis. COSMO-SPECS+FD4 is a model system for detailed cloud simulations that consists of a regional atmospheric model (Cosmo), a detailed cloud microphysics model (Specs), and a scalable load balancing and coupling framework (FD4). The recorded trace includes 2 simulation iterations and was recorded on an Intel Xeon cluster. Nek5000 is an open-source solver for incompressible fluid dynamics based on the spectral element method (SEM). We use two examples from the source code, 3dbox that runs 600 iterations on a three-dimensional box with 262,144 grid points, and pipe that runs 400 iterations on a pipe with 86,400 grid points. LAMMPS is an open-source molecular dynamics simulator. We use two examples from the source code, colloid running for 50,000 time steps and simulating interactions between 90,000 atoms on a two-dimensional plane; and rigid running for 3,000 time steps and simulating interactions between 5,600 atoms in a three-dimensional orthogonal box. In addition, we evaluate the Lennard-Jones example used for official benchmarks. It runs 1,000 time steps for 32 million atoms on a two-dimensional plane.
5.2
Runtime Overhead
To determine the runtime overhead introduced by our MPI-aware prototype we applied the trace replay described above for all target applications. For the trace replay both tracing libraries were modified to use up to 2 GiB of memory to keep the entire trace data in main memory. This allows to eliminate all effects of file interaction in OTF2 and event reduction in OTFX and evaluate only the event writing and internal data management for both. Next to the benefits described above, the trace replay enables to measure only the overhead caused by the tracing library without the overhead introduced by a monitor like Score-P itself. Figure 5 shows the runtime of OTF2, Score-P’s standard tracing library, in comparison to our OTFX prototype for the target applications. As described above, our MPI-aware prototype utilizes features already in place within OTFX and, thus, does not introduce additional overhead. The measurements proved this assumption; within measurement
accuracy there have been no differences for the runtime of OTFX with and without the MPI-aware extension. In comparison to OTF2, our MPI-aware prototype was in average 5.1 % faster than OTF2. In total, the library times of OTFX account for 7.8 % of the overall runtime in average. This demonstrates that our MPI-aware prototype suffices our requirement to not introduce additional overhead in the measurement process. 10s
Library time
8s
OTF2 OTFX
6s 4s 2s 0s rig id
nn
le
s
s
ne
ec
jo
sp
s
d-
ar
id
llo
co
pe
pi x
bo
3d
osm
co
ac
om
gr
Figure 5: Runtime of OTF2 and OTFX.
5.3
of the complete trace and the size of the MPI-only trace set the boundaries for a trace size reduction with our MPIaware prototype, in particular, the resulting trace of our MPI-aware prototype can not by smaller than the MPI-only trace. Third, the memory allocation of our prototype without duration filtering and event reduction (OTFX) is already 2.8 to 3.5 times smaller than OTF2. Fourth, the duration filter eliminates short-running functions and reduces the trace size by additional 82 %, on average, which results in trace sizes of 0.2 to 12.6 % of the original trace size in OTF2. The duration filter is particularly effective on applications with highly-frequent short-running function calls, common in C++ applications, e.g., COSMO-SPECS+FD4 and the Lennard-Jones example from LAMMPS. Fifth, for all applications, except Gromacs and both examples from Nek5000, the duration filter suffices to keep the trace within a single memory buffer and avoid intermediate memory buffer flushes. For those, the event reduction is triggered whenever the internal memory buffer is exhausted. This leads to a reduction of the recorded calling depth from 14 to 8, 19 to 10, and 19 to 13 for Gromacs, 3dbox, and pipe, respectively. However, all MPI events that occur up to the original calling depth of 10 and 19 are kept. The resulting trace size is 30, 42, and 46 MiB for Gromacs, 3dbox, and pipe, respectively.
Trace Size Reduction
To evaluate the trace size reduction of our MPI-aware prototype we again applied the trace replay but this time with enabled duration filtering and event reduction. We choose a minimum duration of 1 µs for the duration filter, i.e., all function calls shorter than 1 µs are filtered. This way, all short-running functions are eliminated while important routines remain in the trace. Furthermore, we choose a memory buffer size of 50 MiB to trigger the MPI-aware event reduction. To produce the results without event reduction we use memory buffers up to 2 GiB for OTF2 and 1 GiB for OTFX. Table 1: Trace sizes of OTF2, OTFX with and without filter in comparison to MPI only traces. Application gromacs cosmo-specs 3dbox pipe colloid lennard-jones rigid
OTF2 1.7 GB 1.5 GB 919 MB 817 MB 900 MB 1.8 GB 709 MB
Trace size (per process) OTFX +Filter MPI-only 603 MB 514 MB 297 MB 267 MB 266 MB 546 MB 203 MB
127 MB 21 MB 116 MB 88 MB 40 MB 4.1 MB 23 MB
9.8 MB 80 kB 8.8 MB 8.5 MB 12 MB 690 kB 680 kB
Table 1 shows the results for the target applications. It contains the resulting trace sizes of OTF2, OTFX without duration filtering and event reduction (OTFX), OTFX with duration filtering (+FILTER), and the size of all MPI events (MPI-only). From Table 1 can be inferred, first, the traces of all applications are much larger than a normal-sized memory buffer of 10 to 200 MiB [5]. As a result, application execution would be frequently interrupted by intermediate buffer flushes and disturb the original application behavior. Second, an MPI-only trace would fit into our target buffer of 50 MiB for all applications. These two values, the size
5.4
Trace Analysis
To demonstrate the analysis on the traces with MPI-aware filtering and event reduction, Figures 6 and 7 show a screenshot of the visual analysis of Gromacs with Vampir [6]. Figure 6 shows the entire measurement and Figure 7 is zoomed in to a phase of about 1 second. A measurement with OTF2 can be seen on the upper half of each Figure (white background); the measurement with MPI-aware filtering and event reduction on the lower half (blue background). Both use a 50 MiB memory buffer. The timeline view with the application activity over time on the horizontal axis and the processes on the vertical axis is shown on the left side of each screenshot. Application activity is marked with green, MPI communication with red, and buffer flushes with blue. On the right side is a function summary showing the accumulated exclusive time over all processes for each function. Since these are two measurements, not trace replays as before, there may occur runtime deviations. Both figures demonstrate that the MPI-aware duration filtering and event reduction does not alter the general application behavior; except for the missing short-running functions and the six deepest call stack levels. The difference in the function summary in Figure 6 shows again the drastic impact of intermediate memory buffer flushes on the communication behavior. In the OTF2 measurement the application spends on average 276 seconds per process in MPI_Recv, MPI_Sendrecv, and MPI_Waitall; compared to only 60 seconds in the measurement with the MPI-aware prototype. Figure 7 shows this in detail with three successive buffer flushes that interrupt and prolong MPI communication. Both figures highlight that MPI-focused tracing provides essential benefits to both existing approaches: Tracing an application with full detail and tracing only the MPI events of an application. An MPI-focused measurement eliminates the disrupting effect of intermediate buffer flushes and allows a reliable communication analysis. In comparison to an MPI-only trace it still provides as much application context together with the complete MPI communication.
Figure 6: Event trace visualization with Vampir: Trace recorded with OTF2 (top, white background) and trace recorded with the MPI-aware OTFX extension (bottom, blue background) with an overview of the complete measurement runtime.
Figure 7: Event trace visualization with Vampir: Trace recorded with OTF2 (top, white background) and trace recorded with the MPI-aware OTFX extension (bottom, blue background) zoomed to a phase of approx. one second.
6.
CONCLUSION
In this paper we address the impact of uncoordinated intermediate memory buffer flushes in an event-tracing monitor due to the large amount of collected data. We show that those intermediate buffer flushes introduce a drastic bias on the measured application behavior and render a meaningful analysis of the communication behavior impossible. We propose an MPI-focused tracing approach that provides the complete MPI communication behavior and adapts the remaining application events to an amount that fits into a single memory buffer. This approach bridges the gap between an MPI-only trace that allows a correct but context-free communication analysis and a complete trace that contains falsified communication behavior. We evaluate the capabilities of our approach with an MPIfocused prototype implementation of OTFX on the basis of seven application traces from different scientific domains. In comparison to the state-of-the-art tracing library OTF2, our prototype introduces in average 5.1 % less overhead and reduces the trace size up to three orders of magnitude. Most importantly, with the MPI-focused tracing approach the bias caused by uncoordinated intermediate memory buffer flushes is completely eliminated. The resulting trace provides the complete and accurate communication behavior with the application context in a reduced form. This allows a meaningful, as well as correct, analysis of an application’s communication behavior.
7.
[9]
[10]
[11]
[12]
[13]
REFERENCES
[1] Argonne National Laboratories. Nek5000 website, http://nek5000.mcs.anl.gov. [2] D. Eschweiler, M. Wagner, M. Geimer, A. Kn¨ upfer, W. E. Nagel, and F. Wolf. Open Trace Format 2: The Next Generation of Scalable Trace Formats and Support Libraries. In Applications, Tools and Techniques on the Road to Exascale Computing, pages 481–490, 2012. ´ [3] M. Geimer, F. Wolf, B. J. Wylie, E. Abrah´ am, D. Becker, and B. Mohr. The Scalasca Performance Toolset Architecture. Concurrency and Computation: Practice and Experience, 22(6):702–719, 2010. [4] B. Hess, C. Kutzner, D. van der Spoel, and E. Lindahl. GROMACS 4: Algorithms for Highly Efficient, Load-Balanced, and Scalable Molecular Simulation. Journal of Chemical Theory and Computation, 4(3):435–447, 2008. [5] T. Ilsche, J. Schuchart, J. Cope, D. Kimpe, T. Jones, A. Kn¨ upfer, K. Iskra, R. Ross, W. E. Nagel, and S. Poole. Enabling Event Tracing at Leadership-Class Scale through I/O Forwarding Middleware. In Proc. of the 21th Intern. Symposium on High Performance Distributed Computing, pages 49–60, 2012. [6] A. Kn¨ upfer, H. Brunst, J. Doleschal, M. Jurenz, M. Lieber, H. Mickler, M. S. M¨ uller, and W. E. Nagel. The Vampir Performance Analysis Tool Set. In Tools for High Performance Computing, pp. 139–155, 2008. [7] A. Kn¨ upfer and W. E. Nagel. Compressible Memory Data Structures for Event-based Trace Analysis. Future Gener. Comput. Syst., 22(3):359–368, 2006. [8] A. Kn¨ upfer, C. R¨ ossel, D. Mey, S. Biersdorff, K. Diethelm, D. Eschweiler, M. Geimer, M. Gerndt, D. Lorenz, A. Malony, W. E. Nagel, Y. Oleynik,
[14]
[15] [16]
[17] [18]
[19]
[20]
[21]
[22]
P. Philippen, P. Saviankou, D. Schmidl, S. Shende, R. Tsch¨ uter, M. Wagner, B. Wesarg, and F. Wolf. Score-P: A Joint Performance Measurement Run-Time Infrastructure for Periscope, Scalasca, TAU, and Vampir. In Tools for High Performance Computing 2011, pages 79–91, 2012. M. Lieber, V. Gr¨ utzun, R. Wolke, M. S. M¨ uller, and W. E. Nagel. Highly Scalable Dynamic Load Balancing in the Atmospheric Modeling System COSMO-SPECS+FD4. In Applied Parallel and Scientific Computing, pages 131–141, 2012. G. Llort, J. Gonzalez, H. Servat, J. Gimenez, and J. Labarta. On-line Detection of Large-scale Parallel Application’s Structure. In Parallel Distributed Processing (IPDPS), 2010 IEEE International Symposium on, pages 1–10, 2010. Message Passing Interface Forum. MPI: A Message-Passing Interface Standard, Version 3.1, 2015. http://www.mpi-forum.org/docs/mpi-3.1/mpi31report.pdf. K. Mohror and K. L. Karavanic. Evaluating Similarity-based Trace Reduction Techniques for Scalable Performance Analysis. In Proceedings of the Conference on High Performance Computing Networking, Storage and Analysis, SC ’09, pages 55:1–55:12, 2009. J. Mußler, D. Lorenz, and F. Wolf. Reducing the Overhead of Direct Application Instrumentation Using Prior Static Analysis. In Proceedings of the 17th International Conference on Parallel Processing Volume Part I, Euro-Par’11, pages 65–76, Berlin, Heidelberg, 2011. Springer-Verlag. S. Plimpton. Fast Parallel Algorithms for Short-Range Molecular Dynamics. Journal of Computational Physics, 117(1):1–19, 1995. Sandia National Laboratories. Lammps website. http://lammps.sandia.gov. S. S. Shende and A. D. Malony. The Tau Parallel Performance System. Int. J. on High Performance Computing Applications, 20(2):287–311, 2006. Top 500 supercomputer sites, http://www.top500.org. M. Wagner, J. Doleschal, A. Kn¨ upfer, and W. E. Nagel. Selective Runtime Monitoring: Non-intrusive Elimination of High-frequency Functions. In Proc. of the International Conference on High Performance Computing & Simulation, pages 295–302, 2014. M. Wagner, J. Doleschal, W. E. Nagel, and A. Kn¨ upfer. Runtime Message Uniquification for Accurate Communication Analysis on Incomplete MPI Event Traces. In Proceedings of the 20th European MPI Users’ Group Meeting, pages 123–128, 2013. M. Wagner, A. Kn¨ upfer, and W. E. Nagel. Enhanced Encoding Techniques for the Open Trace Format 2. Procedia Computer Science, 9:1979–1987, 2012. M. Wagner, A. Kn¨ upfer, and W. E. Nagel. Hierarchical Memory Buffering Techniques for an In-Memory Event Tracing Extension to the Open Trace Format 2. In Parallel Processing (ICPP), 2013 42nd International Conference on, pages 970–976, 2013. M. Wagner and W. E. Nagel. Strategies for Real-Time Event Reduction. In Euro-Par 2012: Parallel Processing Workshops, pages 429–438, 2013.