ous works on transfer function design interfaces focus on 1D, 2D and 3D classification [4]. When it comes to multi-variate or multi- modal datasets, it is essential ...
Multi-Dimensional Transfer Function Design based on Combined Interface of Parallel Coordinates and Dimension Projection Hanqi Guo, Peihong Guo, He Xiao, and Xiaoru Yuan, Member, IEEE
∗
Key Laboratory of Machine Perception (Ministry of Education), and School of EECS, Peking University
(a)
(b)
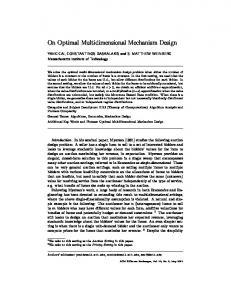
Figure 1: Volume visualization of multi-dimensional data with our proposed method. (a) Volume rendering results; (b) the user interface of our multi-dimensional transfer function design. In our design, a parallel coordinates plots (left) is combined with a dimension projection plot (right) to facilitate transfer function design.
A BSTRACT In this work, we present a user interface for multi-dimensional transfer function design, which takes advantages of the combination of parallel coordinates plot and dimensional projection. Users can select interested features and assign colors or opacities through the interface in our design. The features can be identified either directly by clustering in the dimensional projection or by tuning each individual dimensional in the parallel coordinates. Then a series of transfer functions are constructed by the user selection. Our method is effective for interactive multi-dimensional volume exploration. Keywords: Multi-dimensiontal Transfer Function, Volume Rendering, Parallel Coordinates, Multi-dimensional Scaling. 1
I NTRODUCTION AND R ELATED W ORKS
Transfer functions play central role in volume rendering. Traditional transfer functions map the voxel values (scalar or multi variables) to colors and opacities, thus classifying the volume data and obtaining the final volume rendered image through compositing. A common way of transfer function design is to assign colors and opacities on the feature space directly. However, due to the limitation of the available screen dimension and space, most previous works on transfer function design interfaces focus on 1D, 2D and 3D classification [4]. When it comes to multi-variate or multimodal datasets, it is essential to apply high-dimensional classifications to the data. To handle this problem, various methods have been proposed for multi-dimensional transfer function design, including dimension projection, clustering, parallel coordinates interfaces, etc. These techniques visualize the feature space in the screen space, and then users can assign transfer functions under the guidance of the visualized patterns. Cluster space based methods [6] and dimension projection [3] transforms the multi-dimensional feature space to 2D screen space in the forms of point clouds or histogram, which enables the brushing manipulations on the new feature space. How∗ E-mail:{hanqi.guo,peihong.guo,xiaohe.pku,xiaoru.yuan}@pku.edu.cn
ever, there is a problem that users are not aware of the numerical distributions of the features that are selected. Besides cluster and dimension reduction scheme, multi-dimensional feature space can also be presented in the form of parallel coordinates, which is a powerful tool for visualizing multi-dimensional data without loss of information. Blaas et al. [1] applied multi-dimensional classification by parallel coordinates interface, which enables interactive exploration for multi-modal volumetric datasets. It is convenient to identify the correlations between the neighborhood dimensions in parallel coordinates, as well as the numerical distributions on each dimension axis, but it is hard to tell the overall cluster patterns under certain conditions, especially for large data. Both dimension projection and parallel coordinates have advantage and disadvantages on being a transfer function design interface due to their capability of visualizing multi-dimensional feature space. In our work, we implement a novel transfer function design interface combining parallel coordinates and dimension projection, in order to take the advantages of both methods. This idea is inspired by SPPC [7] (scattering points in parallel coordinates), and the technique has been applied on colormap of multi-modal remote sensing data [8]. In this poster, we demonstrate the application of our method on multi-dimensional transfer function design in volume rendering. With our tool, users can assign color and opacity properties on the clusters shown in the projection plot, meanwhile maintain awareness of the numerical distributions by the parallel coordinates plot (PCP). Further tuning and exploration can be done on the PCP. Our tool is intuitive and effective for interactive exploration of multi-dimensional volumetric datasets. 2 O UR M ETHODS 2.1 User Interface Our multi-dimensional transfer function design interface consists of two components (Figure 1(b)), with the left side of PCP and the right side of projection plot. Every multi-variate voxel from the dataset are mapped onto the PCP as a polyline crossing the parallel axes. Meanwhile, the voxels are also projected as points on a 2D plane. In addition, the polylines in the PCP and the points in the projection plot are connected by smooth spline curves in order to provide continuous visual cues. When choosing features on the projection plot, the corresponding areas are highlighted and overlaid in both dimension projection plot and the PCP. In the bottom of each
acceleration or parallel computing techniques. To construct transfer functions, we use GMM (Gaussian Mixture Model) to fit the complex multi-dimensional space that users selected. A series of Gaussian transfer functions [5] are generated as the construction results. (a)
(b)
(c)
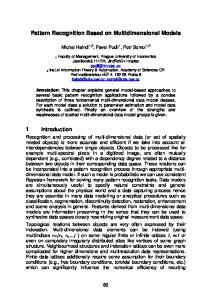
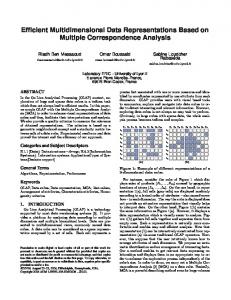
(d) Figure 2: The process of transfer function design: (a) the original data presentation in the form of PCP and MDS projection with uniform weights; (b) adjust the MDS projection weights to modify the projection layout; (c) select a region of interest, and corresponding transfer functions are figured out and visualized on the PCP; (d) the corresponding volume rendering result of transfer function in (c).
dimension axis, there is a small round widget which can adjust the projection weighting of the corresponding dimension. Users can also remove certain data dimension by zero weighting to the corresponding dimensions. There are two steps for designing multi-dimensional transfer function with our tool (Figure 2). First, users can get overall comprehension of the dataset by the density distribution on the PCP and the projection plot with uniform dimension weights (Figure 2 (a)). Users can adjust the dimension weights for the projection in order to better separated features in the projection plot (Figure 2 (b)). Secondly, users can brush a region of interest on the projection map with lasso tool to assign color and opacity properties. Further fine tuning can be done on the PCP if it needs. The volume rendered results are shown instantly, and the final results can be achieved by several trial steps. 2.2 Algorithms There are two major components in our method: the projection of multi-dimensional voxels to the 2D projection feature space, and the construction of transfer functions from the selected feature points in the projection plot. For the projection, we use multidimensional scaling (MDS) technique. The difference between each data item resembles their distance in the original high dimensional space. In practice, we use a low storage and computational complexity MDS algorithm called pivot MDS [2]. Pivot MDS is also well suited for data sets with large amount of homogeneous items, which is exactly the case in our problem. Currently the pivot MDS computation is performed purely by CPU. The performance and the quality of the projection can be boosted by exploiting GPU
3 C ASE S TUDY AND R ESULTS We apply our transfer function on an atmospheric data set from IEEE Visualization contest 20041 . Five dimensions are considered including pressure, temperature, water vapor mixing ratio (QVAPOR), cloud moisture mixing ratio (QCLOUD) and cloud ice mixing ratio (QICE). From the dimension projection plot, we can observe some interesting distributions. Color and opacity properties can be assigned to the desired volume data clusters through direct sketching on the projection plot to visualize the corresponding features and structures. Our system is capable of automatically generating Gaussian blobs to fit the corresponding feature space. After further tuning the Gaussian blobs on the parallel coordinates view, we obtained a fine result (Figure 1). 4 C ONCLUSIONS In this work, we presented a method for multi-dimensional transfer function design. it takes advantage of combining PCP and dimension projection. Users can specify interested regions on the projection plot. Our algorithm generates corresponding multidimensional transfer functions. Projection plot provides intuitive visualization of the feature clusters of multi-dimensional volume data, while the parallel coordinates enable direct value range selection in the process of transfer function design. Our method is flexible and effective for interactive exploration of multi-dimensional volumetric datasets. ACKNOWLEDGEMENTS This work is supported by National Natural Science Foundation of China Project No. 60903062, Beijing Natural Science Foundation Project No. 4092021, 973 Program Project No. 2009CB320903, 863 Program Project 2010AA012400, Chinese Ministry of Education Key Project No. 109001, and the startup funding from the National 985 Project Phase II at Peking University. R EFERENCES [1] J. Blaas, C. P. Botha, and F. H. Post. Extensions of parallel coordinates for interactive exploration of large multi-timepoint data sets. IEEE Trans. Vis. Comput. Graph., 14(6):1436–1451, 2008. [2] U. Brandes and C. Pich. Eigensolver methods for progressive multidimensional scaling of large data. In Graph Drawing, pages 42–53, 2006. [3] F. de Moura Pinto and C. M. D. S. Freitas. Design of multi-dimensional transfer functions using dimensional reduction. In EuroVis07: Proceedings of IEEE VGTC Symposium on Visualization 2007, pages 131–138, 2007. [4] J. Kniss, G. L. Kindlmann, and C. D. Hansen. Multidimensional transfer functions for interactive volume rendering. IEEE Trans. Vis. Comput. Graph., 8(3):270–285, 2002. [5] J. Kniss, S. Premoze, M. Ikits, A. E. Lefohn, C. D. Hansen, and E. Praun. Gaussian transfer functions for multi-field volume visualization. In Proceedings of IEEE Visualization 2003, pages 497–504, 2003. [6] F.-Y. Tzeng and K.-L. Ma. A cluster-space visual interface for arbitrary dimensional classification of volume data. In VisSym 2004: Proceedings on Symposium on Visualization 2004, pages 17–24, 338, 2004. [7] X. Yuan, P. Guo, H. Xiao, H. Zhou, and H. Qu. Scattering points in parallel coordinates. IEEE Trans. Vis. Comput. Graph., 15(6):1001– 1008, 2009. [8] X. Yuan, H. Xiao, H. Guo, P. Guo, W. Kendall, J. Huang, and Y. Zhang. Scalable multi-variate analytics of seismic and satellite-based observational data. IEEE Trans. Vis. Comput. Graph. (Vis’ 10), 16(3):–, 2010. 1 http://vis.computer.org/vis2004contest