Recently, classifiers for multi-class data have been evolved directly. [12, 16, 15]. ..... front, ahead of that at (0, 5) which classifies the second class slightly worse.
1141
Multi-objective Techniques in Genetic Programming for Evolving Classifiers Daniel Parrott, Xiaodong Li and Vic Ciesielski School of Computer Science and Information Technology RMIT University, Melbourne, Vic 3001, Australia { dparrot, xiaodong, vc} @cs.rmit.edu.au
Abstract- The application of multi-objective evolutionary computation techniques to the genetic programming of classifiers has the potential to both improve the accuracy and decrease the training time of the classifiers. The performance of two such algorithms are investigated on the even 6-parity problem and the Wisconsin Breast Cancer, Iris and Wine data sets from the UCI repository. The first method explores the addition of an explicit size objective as a parsimony enforcement technique. The second represents a program's classification accuracy on each class as a separate objective. Both techniques give a lower error rate with less computational cost than was achieved using a standard GP with the same parameters.
1 Introduction Genetic Programming (GP) [9] has successfully evolved data classifiers. Early work developed approaches for binary classifiers [6], with multi-class data sets classified using multiple binary classifiers in series [7]. Recently, classifiers for multi-class data have been evolved directly [12, 16, 15]. Evolutionary multi-objective (EMO) techniques have been applied to genetic programming for parsimony enforcement [3, 4] in order to overcome 'bloat', the tendency of genetic programs to develop unnecessary code or 'introns' [1, 10], and evolve programs for less computational cost. Diversity maintenance measures used in these EMO techniques also contribute to avoiding convergence to local minima. Combining multi-objective techniques with the genetic programming of classifiers thus presents opportunities for evolving smaller classifiers that should generalize better [14] while searching the solution space more effectively. This would lead to classifiers that attain lower errors and are evolved for less computational cost than would be the case using the standard GP algorithm. In this paper we investigate evolving GP classifiers using techniques derived from the NSGA-IJ multi-objective algorithm [5]. The parsimony enforcement technique of POPE-GP [2] is developed further and analyzed. A novel approach of decomposing a classification problem so that classification accuracy on each class is represented as a distinct objective is also explored. In addition to maintaining diversity, it is intended that by crossing-over partial solutions, each capable of classifying one class well, programs that can classify both or several classes well will be produced. The performance of these approaches is evaluated on the even-6 parity problem and several classification tasks from the UCI database. Both POPE-GP and decomposed
multi-objective GP (DecMO-GP) provide promising results compared to those given by the standard GP algorithm.
2 Related Work Genetic programming of classifiers is a well established field of research but still suffers from several difficulties, such as bloat leading to ineffective crossover and mutation, long training times and error rates greater than those achieved by other classification methods on some tasks [6]. Multi-objective techniques for evolutionary computation have also received much attention. However, the combination of the two is not as well studied, although there has been interest in the use of EMO for parsimony enforcement [2, 3, 4]. The relevant bodies of work are generally distinct and will be treated as such here. 2.1 Genetic programming of classifiers The application of genetic programming to binary classification problems has been demonstrated with reasonable success [6, 7, 12]. The evolved classifiers generally give numeric output, with a value below zero indicating membership of one class and a value greater than zero indicating membership of the other. Multi-class classification problems can then be approached by decomposition into a set of binary classification problems [7]. This entails training each binary classifier independently and thus increases the effort required for training. Recent research has also examined the evolution of a set of binary classifiers from a single run [13]. A GP-evolved program can be trained to classify data into multiple classes using by dividing the output into multiple ranges, each corresponding to a different class. In static range selection (SRS), the ranges are specified beforehand, introducing the difficulty of determining the appropriate range boundaries ahead of time. Dynamic range selection (DRS) attempts to overcome this by evolving the range boundaries along with the programs [12, 16, 15]. 2.2 Pareto-based Multi-objective algorithms Early evolutionary approaches to multi-objective problems used fixed weights to determine the relative importance of different objectives and hence required a priori knowledge of the solutions possible. These have given way to Paretobased approaches that give a partial ordering of solutions based on Pareto dominance, relieving users of the need to predict the solutions possible. A solution is said to Paretodominate another if it is no worse than the other on any objective and better than the other on at least one objective. Formally, for a minimization problem, u dominates v
0-7803-9363-5/05/$20.00 ©2005 IEEE.
Authorized licensed use limited to: RMIT University. Downloaded on January 3, 2010 at 23:13 from IEEE Xplore. Restrictions apply.
1142
(U >d v) over the set of objectives 9 iff
1 is hardened so that a solution u e-dominates another v
(1) VO E E(uo < vo) A ]0 E E8(uo d V)}
(2) Note that the true Pareto front is the first front of the set of 1 = {V:,u E
all possible solutions. The second front 2 of the set (1 is then the first front of the set of remaining solutions {4 - 1 } and generally: i-1
t={v :,uE {4-
U n}(U >d V)},
n=O
(3)
where 0 0. In prominent Pareto-based multi-objective evolutionary algorithms such as NSGA-I1 [5], SPEA-2 [17] and PAES [8], the members of fronts closer to the Pareto front have a greater chance of being selected for mutation, crossover or inclusion in the next generation. Within a front, solutions from less crowded areas are selected in preference to those from more crowded areas to maintain diversity and front coverage. The methods of selecting and maintaining diverse, low-front solutions are the key differences between the algorithms. The Strength Pareto Evolutionary Algorithm 2 (SPEA2) [17] maintains an archive of all non-dominated solutions found so far. The solutions are assigned a fitness based on the number of solutions they dominate and are dominated by. Solutions with low distances to other individuals are eliminated when the archive exceeds a predefined size. The Pareto Archive Evolutionary Strategy (PAES) [8] in its simplest form uses a (1+1) evolution strategy to generate a non-dominated front. A single randomly generated solution is used as a starting point and mutated to generate new solutions. New non-dominated solutions are added to the archive. Solutions from uncrowded areas are selected to mutate and generate new solutions from. Where the archive exceeds a specified limit, archive members are replaced by new members if the new members are from a less crowded area of the front. NSGA-II (the Non-Dominated Sorting Genetic Algorithm-II) [5] uses tournament selection to choose solutions for mutation or crossover, with the solution from the lowest front in the tournament being selected. Where more than one solution belongs to the lowest front present in a tournament, the solution with the lowest 'crowding distance' (the sum of distances between a solution and its nearest neighbours in the same front) is selected. The algorithm is fully elitist - every iteration the child and parent populations are merged and the combined population Pareto-sorted into fronts. The combined population is then culled to half its size to create the new parent population. The use of e-approximate Pareto sets has been suggested as a possible improvement to the Pareto-based EMO paradigm [11]. The Pareto-dominance criterion of equation
(U >d, V) iff: yO EE((l + e) . uo < vo) A ]0 e 19((1 + e) uo(j) arg2 >arg3 I___________ I___ Name +
Table 4: Terminal set for the database classification problems. Description Name Return Type B The value of attribute X for the instance. AttrX A random number in range (0,100). B RandX well may result in functional blocks of code capable of classifying a single class. These individuals will be kept by the elitism of the NSGA-II algorithm. By crossing-over individuals with complementary classification abilities, i.e. that correctly classify different classes, it is hoped that child individuals that can correctly classify both classes will be produced. Such an effect should lead to faster evolution of good individuals. Third, where no single best solution is available, having several individuals each optimised for classification of a different class could give rise to systems utilising multiple programs to classify new data. Such systems could be similar to the hierarchical application of binary classifiers for multiclass systems (e.g. [13]) but could use multiple 'good' but different classifiers in conjunction to classify new data instances. While an interesting concept, this is not explored in the current paper. 3.3 DecMOP-GP algorithm
Keeping only a single individual at each point in phenotypic solution space gives the opportunity to choose which individual to keep. Strong selection pressure against size is introduced by keeping the smallest individual at each point. The algorithm created by applying this modification to the DecMO-GP algorithm is referred to as the Decomposed Multi Objective-Parsimony Genetic Programming, or DecMOP-GP. The modification is intended to promote the elimination of introns but could result in the premature elimination of promising but large arrangements of genetic program nodes, a risk common to all parsimony enforcement techniques.
4 Methodology To determine the efficacy of the above algorithms each was run on several well known classification tasks: * the even-6 parity problem;
the Wisconsin Breast Cancer Database from the UCI repository; * the Iris Database from the UCI repository; * the Wine Database from the UCI repository; The treatment of the data sets, function and terminal sets used for each classification task and the parameters used for the runs are given below. *
4.1 Data
The task for the even 6-parity problem was to evolve a classifier that returns true when given a string of 6 bits with an even number of ones and returns false when given a bit string with an odd number of ones. Performance is analyzed over the set of 64 bit strings of length six. The Wisconsin Breast Cancer database consistg of 699 cases of breast cancer to be classified as benign or malignant based on nine numerical attributes. After removing 16 cases with missing attributes the data was split into a training set of 477 instances (70%) and a testing set of 206 (30%) instances with proportional representation of benign and malignant classes in the two sets. Attributes were not normalised. The Iris database consists of three classes of iris with 50 instances of each. There are four numeric attributes with no missing data. Data was split 70/30 into a training set of 105 instances and a testing set of 45 instances with proportional representation of each class. Attributes were not normalised. The Wine database consists of a chemical analysis of 178 wines from three different cultivars in the same Italian region. Wines are to be classified to a cultivar according to thirteen numerical attributes representing the results of the chemical analysis. The data set was again split 70/30 into a training set of 124 instances and a testing set of 54 instances with proportional representation of each class. Attributes were not normalised. 1144
Authorized licensed use limited to: RMIT University. Downloaded on January 3, 2010 at 23:13 from IEEE Xplore. Restrictions apply.
1145
4.2 Function and Terminal Sets For the even-6 parity problem the simple logical function
set shown in Table I was used. The only terminal for the problem is a boolean operator assigned the value of one of the 6 positions on the bit string as shown in Table 2. The function set for the Wisconsin Breast Cancer, Iris and Wine databases is shown in Table 3. The terminals are a random number and a randomly assigned attribute as shown in Table 4.
4.3 Parameters Each algorithm was trained and tested on each data set over 30 runs. Parameters for these runs are shown in Table 5. Initial populations were generated using the ramped half-andhalf method [9]. Tournament selection with a tournament size of two was used. Runs were stopped if an individual capable of correctly classifying the entire training set or all 6-bit strings was found. For the three-class Iris and Wine classification tasks, classes were differentiated using static range selection with boundaries at -15.0 and 15.0. Table 5: Parameters for the GP runs. Value Parameter 300 Population size 200 Max Generations Crossover probability 90% Mutation probability 10% 10 Max Depth
was smallest when using the POPE-GP algorithm, while the average size for individuals evolved by the DecMOP-GP slightly larger and that of DecMO-GP evolved individuals larger again. The standard GP had the largest average size of individuals by a significant margin. The relatively small average size of DecMO-GP individuals is surprising as no parsimony technique is used. Other characteristics of the results are pointed out in the following sections.
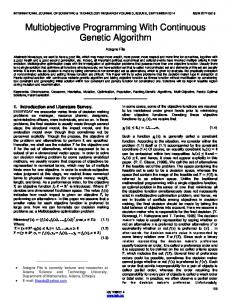
5.1 Even 6-parity Results are shown in Figure 2 and Table 6. The POPE-GP algorithm clearly performed best on this problem (highest proportion of successful runs and lowest node evaluations) followed by the DecMOP-GP algorithm. The standard and DecMO-GP algorithms performed poorly.
Table 6: Summary of performance results on even 6-parity problem. Standard deviations are given in brackets. Percent runs Average size Algorithm finding solution of solution 36.7% 455 Standard GP POPE-GP
93.3%
DecMO-GP
43.3%
DecMOP-GP
80.0%
~~~(324) 36.3 ~~~~(36.4) 328
(311) 78.8
~~~~(65.5)
4.4 Performance measurement
5.2 Wisconsin Breast Cancer Database
The main performance measures of interest for these algorithms are the computational effort needed to evolve a classifier and the classification error of the evolved classifier. Also of interest for the data classification problems are the success of the algorithms in evolving solutions to the training data and the generalizability of the solutions. For the even-6 parity problem the percentage of runs that found a solution within the maximum number of generations, the average number of node evaluations (i.e. sum of the number of functions and terminals evaluated over the course of the run) to a solution and the average size of the final solution were all recorded. These metrics indicate the probability of success and the computational effort needed to achieve it. For the three data classification problems the training error, testing error, average size of the best individual and the average number of node evaluations per run (i.e. the number of node evaluations until a solution to the training data set was found or, if no solution found, the number of node evaluations over the course of the run) were recorded.
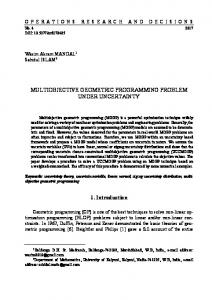
Results are shown in Figure 3 and Table 7. DecMOP-GP achieved the lowest error on the test data while DecMOGP trained slightly better and tested slightly worse. However, the differences in both the testing and training errors were slight between the three algorithms developed here and all significantly outperformed the standard GP. The average size of solution is smallest for the POPE-GP and then for the DecMOP-GP algorithm (excluding two large outliers created in the zeroth and sixth generations). The size of the DecMO-GP solutions, although roughly four times that of the two parsimony enforcement techniques, is only a quarter that of the standard GP.
5 Results The POPE-GP, DecMO-GP and DecMOP-GP outperformed the standard GP on all problems with the parameter settings used. In general, the average size of individuals
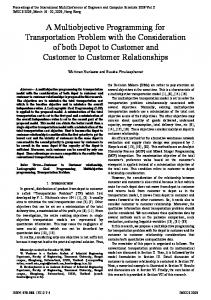
5.3 Wine Database Results are shown in Figure 4 and Table 8. The DecMO-GP trains and tests the best but it and the DecMOP-GP generalize poorly, with excellent training results relative to the other algorithms giving way to test results only slightly better than that of POPE-GP. Relative sizes follow the pattern described for the WBC data sets. Standard GP is again the worst performer. 5.4 Iris Database Results are shown in Figure 5 and Table 9. The POPE-UP algorithm achieves the lowest error rate on test data; surpris-
1145
Authorized licensed use limited to: RMIT University. Downloaded on January 3, 2010 at 23:13 from IEEE Xplore. Restrictions apply.
1146
Table 7: Summary of results on Wisconsin Breast Cancer Database classification. Standard deviations are given in brackets. *Without two outliers with over 2000 nodes each average size drops to 37.1 and SD to 60.6. Algorithm Training Testing Average size of solution Error Error 476 Standard GP 0.0102 0.0618 (0.0034) (0.0113) (301) 25.6 POPE-GP 0.0076 0.0492 (0.0026) (0.0154) (12.9) DecMO-GP 0.0060 0.0481 120 (0.0024) (0.0148) (45.9) DecMOP-GP 0.0073 0.0440 148.3* (0.0036) (0.0194) (429.49) Table 8: Summary of results on Wine Database classificati' on. Algorithm Training Testing Average size Error of solution Error Standard GP 0.0341 0.1451 593 (0.0257) (0.0598) (620) 31.3 POPE-GP 0.0191 0.1179 (0.0209) (0.0480) (26.0) 172 DecMO-GP 0.0013 0.0912 (134) (0.0030) (0.0351) 0.1006 61.9 DecMOP-GP 0.0021 (0.0042) (0.0352) (42.3) ingly it is much less than the training error rate achieved. The DecMO-GP algorithm performed better on training than the DecMOP-GP algorithm but worse on test data. These results may be a result of the data partitioning. Standard GP performed worst of all with training and test error rates two to four times those achieved by the other algorithms. Size followed the pattern described for the WBC data. Table 9: Summary of results on Iris Database classification. Algorithm Training Testing Average size of solution Error Error Standard GP 0.0454 0.0393 563 (0.0584) (0.0749) (478) 0.0238 22.5 POPE-GP 0.0119 (0.0074) (0.0140) (21.4) 0.0207 113 DecMO-GP 0.0089 (0.0056) (0.0164) (58.3) 0.0193 DecMOP-GP 0.0143 33.5 (0.0055) (0.0224) (24.6)
6 Discussion The three multi-objective variants of GP explored here all achieve lower error rates with less node evaluations than the standard GP over the data sets classified for the parameters used, as shown in Figures 2 through 4.
The low average sizes achieved by the DecMO-GP are surprising as no parsimony enforcement technique is used. With only one individual at a point there is less rationale for the development of introns to protect against the disruptive effect of mutation and crossover and less opportunity for swapping useless code between similar solutions. By thus decreasing the opportunity for intron development, individuals' size appears to have been reduced without explicit parsimony enforcement techniques. More research on this and the resulting diversity could give a better understanding of the development of introns. Experimenting with a single-point standard GP or n-point (n=1, 2, 3, ...) standard, DecMO- or POPE-GP could be of interest to investigate the diffusion of introns among similar individuals and its effects on bloat and diversity. The results gained suggest a weak relationship between the size and generalizability of solutions generated by the DecMO-GP and DecMOP-GP algorithms, with the smaller solutions from the latter generalizing better. The DecMOGP and DecMOP-GP algorithms are particularly at risk of overtraining as highlighted by the Wine data classification results, although all overtrain on this data set. Understanding of the multi-objective algorithms could be increased by applying them to data sets with more classes. Combination with more advanced classification techniques such as dynamic range selection rather than static range selection could also provide a superior classifier and should be attempted. Algorithm modifications may also lead to a better classifier than those explored here. Adaptations may include the use of multiple classifiers from a single run as suggested in Section 4; use of a steady state rather than generational algorithm as demonstrated by FOCUS; or intra-front selection based on minimum total error rather than crowding to focus the front on the area of interest. While the intent of this research was to investigate the performance of the multi-objective classifier algorithms relative to standard GP, future work should compare the algorithms or improved versions thereof to classifiers derived using other techniques such as decision trees, logistic regression, neural nets or Bayesian classifiers.
7 Conclusions The paper has investigated the use of multi-objective genetic programming techniques for application to classification problems. The performance of a recent algorithm, POPEGP, and a novel algorithm utilising an error-minimisation objective for each class, the DecMO-GP and its parsimonyenforcing derivative DecMOP-GP, have been investigated on several well known problems - the even-6 parity problem and the Wisconsin Breast Cancer, Iris and Wine databases from the UCI repository. All three of the new algorithms were superior to a standard implementation of the Genetic Programming algorithm on these problems with the data set partitioning and parameter sets as described. The new algorithms achieved lower error rates while utilising less computational effort. It is apparent that the addition of a parsimony enforce1146
Authorized licensed use limited to: RMIT University. Downloaded on January 3, 2010 at 23:13 from IEEE Xplore. Restrictions apply.
1147 ment technique to the DecMO-GP algorithm evolves classifiers with comparable classification error on test data sets for less computational effort. This is despite the original DecMO-GP training better. However, as indicated by the Wine data classification results, both algorithms are susceptible to overtraining. Overall, these results show that multi-objective techniques can be applied to the genetic programming of classifiers to decrease both error rates and the computational effort needed to evolve GP classifiers. With a range of avenues open for investigation in this area, it is hoped that these techniques can be developed to be a useful addition to the evolutionary computation practitioner's toolbox.
Acknowledgements This work was sponsored by a grant from the Victorian Partnership for Advanced Computing.
Bibliography [1] Nordin, P. Banzhaf, W.: Complexity Compression and Evolution. In Genetic Algorithms: Proceedings of the Sixth International Conference (ICGA95). Morgan Kauffmann (1995) 310-317
[2] Bernstein, Y, Li, X., Ciesielski, V., Song, A.: Multiobjective Parsimony Enforcement for Superior Generalisation Performance. In Proceedings of the 2004 IEEE Congress on Evolutionary Computation, IEEE Press (2004) 83-89
[3] Bleuler, S., Brack, M., Thiele, L. and Zitzler, E.: Multiobjecive Genetic Programming: Reducing Bloat using SPEA2. In Proceedings of the 2001 Congress on Evolutionary Computation CEC2001. IEEE Press (2001) 536-543 [4] De Jong, E., Pollack, J. B.: Multi-Objective Methods for Tree Size Control. Genetic Programming and Evolvable Machines 4(3) 211-233. Kluwer Academic Publishers (2003) [5] Deb, K., Agrawal, S., Pratap, A., Meyarivan, T.: A Fast Elitist Non-Dominated Sorting Genetic Algorithm for Multi-Objective Optimization: NSGA-II. IEEE Transactions on Evolutionary Computation 6(2) 182-197. IEEE Press (2002). [6] Eggermont, J., Eiben, A.E., van Hemert, J.I.: A comparison of genetic programming variants for data classification. In Proceedings of the Third Symposium on Intelligent Data Analysis (IDA-99) LNCS 1642. Springer-Verlag (1999) 281-290 [7] Freitas, A.A.: A Genetic Programming Framework for Two Data Mining Tasks: Classification and Generalized Rule Induction. In Genetic Programming 1997: Proceedings of the Second Annual Conference. Morgan Kauffmann (1997) 96101
[8] Knowles, J., Come, D.: Approximating the Nondominated Front Using the Pareto Archived Evolutionary Strategy. Evolutionary Computation 8(2) 149-172. MIT Press (2000) [9] Koza, R. Genetic Programming: On the programming of computers by means ofnatural selection. MIT Press, 1992. [10] Langdon, W.B., Poli, R.: Fitness Causes Bloat. In Second Online World Conference on Soft Copmuting in Engineering Design and Manufacture. Springer-Verlag (1997) 13-22 [11] Laumanns, M., Thiele, L., Deb, K., Zitzler, E.: Combining convergence and diversity in evolutionary multiobjective optimization. Evolutionary Computation 10(3) 263-282. MIT Press (2002)
[12] Loveard, T. and Cieisielski, V.: Representing Classification Problems in Genetic Programming. In Proceedings of the 2001 Congress on Evolutionary Computation, IEEE Press (2001), 10701077 [13] McIntyre, A., Heywood, M.: On Multi-class Classification by Way of Niching. In Proceedings of the Genetic and Evolutionary Computation Conference, GECCO 2004. Springer-Verlag (2004) 581-592
[14] Rosca, J.: Generality versus Size in Genetic Programming. In Proceedings of the Genetic Programming Conference 1996 (GP-96). MIT Press (1996) 381-387
[15] Smart, W.R., Zhang, M.: Classification Strategies for Image CLassification in Genetic Programming. In Proceedings of Image and Vision Computing New Zealand 2003 402-407 [16] Song, A., Loveard, C., Ciesielski, V.: Towards Genetic Programming for Texture Classification. In Proceedings of the 14th Australian Joint Conference on Artificial Intelligence. Springer-Verlag (2001) 461-472 [17] Zitzler, E., Laumanns, M., Thiele, L.: SPEA2: Improving the Strenth Pareto Evolutionary Algorithm. Technical Report 103, Copmuter Engineering and Networks Laboratory (TIK), ETH Zurich, Switzerland, 2001.
1147
Authorized licensed use limited to: RMIT University. Downloaded on January 3, 2010 at 23:13 from IEEE Xplore. Restrictions apply.
1148
30
500 450 400 350 300 250 200
POPE-GP DecMO-GP DecMOP-GP Standard ----..--
25
20 15
10 -
5
~
K
0
~
~
~
~
50
~
~
.''. ........
150
100
200
POPE-GP DecMO-GP DecMOP-GP Standard
20
1............................
-.
---
15 10
150 100 50
-
25
POPE-GP DecMO-GP .D. ecM.. OP-GP Staidard ----------
\\~~~~~~~~~~~~~~~~~~....... ....,...
k---
0
0
50
5
--
100
200
1 150
0
5e+06
(b) Size vs Generation
(a) Error vs Generati(on
1 e+07 1.5e+07 2e+07 2.5e+07
(c) Error vs Node evaluations
Figure 2: Results for the even 6 parity problem.
0.08 0.07 t 0.06 -, 0.05 0.04 0.03 0.02 0.01 0
700
POPE-GP DecMO-GP DecMOP-GP Standard
-
-----..
POPE-GP DecMO-GP DecMOP-GP Standard
600
500
.....................
400
0.08 0.07
-
..
0.06
......
0.05 0.04 0.03 0.02 0.01
300 200 _.................
0
100
100
50
150
200
n v
--
0
50
100
- - - - -~~.......................
0
200
150
POPE-GP DecMO-GP DecMOP-GP Standard
0
(b) Size vs Generation
(a) Error vs Generation
5e+06 1 e+071.5e+072e+072.5e+073e+07
(c) Error vs Node evaluations
Figure 3: Results for Wisconsin Breast Cancer database classification.
0.4 0.35 0.3
'.
~~~~~~~~Standard
t.
0.25 0.2 ~ ^\~ ~
0.15 0.1 0.05
900 800 700 600 500
POPE-GP DecMO-GP ~~DecMOP-GP---............
0.4I
0
GP GP GP---------ard .25.......
100
100
50
0
1i 50
200
DecMO-GP------DecMOP-GP------Standard -----
0.3 0.25 0.2 0.15 0.1
400 300 200
~~~~~~~~~.............
0.0
0
50
(a) Error vs Generation
100
150
POPE-GP
0.35
.0
-
;-.......... ..................
0 5e+061 e+0'1.5e+0!e+02.5e+02e+03.5e+07
200
(c) Error vs Node evaluations
(b) Size vs Generatioin
Figure 4: Results for Wine database classification.
0.35 -
0.3
~~~~uecmu-(i
7 -
i
0.25
100
POPE-GP
n --^ RA n_t D
>
~~DecMOP-GP ~~~~~~~~ ~~~~~~Standard
.........
p
0.050
0
i1~
~ ~ ~~~~
--
50
100
150
(a) Error vs Generation
200
POPE-GP DecMO-GP ------DecMOP-GP -------Standard
0.25
)0° . ' . . . . . .
0.2 0.15
0.1
20)O 10)O
------
0.35 0.3
Standard ----.----
5c 40hO 30)o
0.15 0.1
DecMO-GP DecMOP-GP
ho
0.2
_
POPE-GP
90)o -' 80 70)O 60
_ -
~
_0.05
---------------
...........
..........
0.0
n
0
50
100
150
200
0 5e+061 e+07.5e+02e+02.5e+0Be+03.5e+07
(b) Size vs Generation
(c) Error vs Node evaluations
Figure 5: Results for Iris database classification.
1148
Authorized licensed use limited to: RMIT University. Downloaded on January 3, 2010 at 23:13 from IEEE Xplore. Restrictions apply.