Polynomial Neural Network for Linear and Non-linear Model Selection in Quantitative-Structure Activity Relationship Studies on the Internet 1,2
3
1
1
Igor V. Tetko , Tetyana I. Aksenova , Vladimir V. Volkovich , Tamara N. Kasheva , Dmitry 1,3 4 5 2 V. Filipov , William J. Welsh, David J. Livingstone , Alessandro E. P. Villa
1 - Department of Biomedical Applications, Institute of Bioorganic and Petroleum Chemistry, Murmanskaya, 1, Kyiv-660, 253660, Ukraine,
[email protected] 2 - Laboratoire de Neuro-heuristique, Institut de Physiologie, Université de Lausanne, Rue du Bugnon 7, Lausanne, CH-1005, Switzerland, http://www.lnh.unil.ch 3 - Institute of Applied System Analysis, prospekt Peremogy, 37, 252056, Kyiv, Ukraine 4 - Department of Chemistry and Center for Molecular Electronics, University of Missouri-St. Louis, St. Louis, MO 63121 5 - ChemQuest, Delamere House, 1, Royal Crescent, Sandown, Isle of Wight, PO36 8LZ and Centre for Molecular design, University of Portsmouth, Portsmouth, Hants, PO1 2EG, U.K.
Address for correspondence: Igor V. Tetko Institut de Physiologie, Université de Lausanne, Rue du Bugnon 7, CH-1005 Lausanne, Switzerland FAX: ++41-21-692x5505 Tel.: x5534 e-mail:
[email protected] http://www.lnh.unil.ch
This manuscript contains: 26 pages, including References, 2 Tables and 5 Figures
Abstract This article presents a self-organising multilayered iterative algorithm that provides linear and non-linear polynomial regression models thus allowing the user to control the number and the power of the terms in the models. The accuracy of the algorithm is compared to the partial least squares (PLS) algorithm using fourteen data sets in quantitative-structure activity relationship studies. The calculated data shows that the proposed method is able to select simple models characterized by a high prediction ability and thus provide a considerable interest in quantitative - structure activity relationship studies. The software is developed using client-server protocol (Java and C++ languages) and is available for world-wide users on the Web site of the authors.
KEYWORDS: polynomial neural networks, non-linear model selection, Internet, PLS, cross-validation
Introduction One task of knowledge extraction from experimental data is to determine its best mathematical description. Many methods can be used to do and the most simple is represented by multiple linear regression. This method is widely used in quantitative structure relationship-studies (QSAR) mainly because of the rather simple way to interpret the results. The power of this method can be significantly increased if it is combined with evolutionary algorithm (1,2). However, variable selection with evolutionary method has a danger of chance correlation effect (3). The partial least squares (PLS) method was shown to be a promising tool to analyze large data sets with highly collinear variables (4,5). However, the application of this method is basically limited to linear regression application. Although a non-linear variant of PLS modeling has been reported, (6) its manner for incorporating non-linear dependency is artificial and lacks generality. This PLS algorithm is also very sensitive to outliers or irrelevant variables. The Artificial Neural Networks (ANN) provide a universal approximator and can be used to model complex non-linear relationship (7-11). However, a serious disadvantage of this method is that the dependencies detected between parameters and responses remain hidden inside of the “black box”, i.e. weight matrixes of the neural networks. Despite the fact that some methods were recently developed (12,13) to assess a rank of importance of input parameters and to optimize their number in ANN studies, the interpretation of calculated results remains quit difficult. Group Method of Data Handling (GMDH) algorithms represents a sorting-out methods that can be used for analysis of complex objects having no definite theory (14,15). There 2
is a large spectrum of GMDH-like algorithms. It includes supervised (combinatorial algorithm, iterational algorithm, objective system analysis, harmonical, etc.), and unsupervised (objective computer clusterization, analogues complexing) methods (see for review (16,17)). The Iterational Algorithm is also known as Polynomial Neural Network (PNN) algorithm and is supported in commercial software systems, such as “SelfOrganize” of DeltaDesign Software (18), "NeuroShell2" of Ward Systems Group, Inc., "ModelQuest" of AbTech Corp., "ASPN" of Barron Associates Co., "KnowledgeMiner" of DeltaDesign Berlin Software. The choice of the appropriate GMDH algorithm depends on the specificity of the problem to be solved. The specificity of the QSAR tasks can be summarized as follows: there is a large number of input variables, some of these variables are irrelevant and highly correlated, and only restricted input data set is available. The PNN approach is well suited to solve such problems. Unfortunately, the results of this method cannot be easily interpreted. In this article we describe PNN algorithm with Gedelev’s coding of structures that allow the user to control the number and the maximal power of terms in the models. The performance of the new approach is compared with PLS algorithm that is widely used in QSAR studies. A short description of the software available at the WWW page of the authors is provided.
Data sets Fifteen QSAR data sets analyzed in (2) were selected to compare the performance of the analyzed algorithms. These data were downloaded from the WWW page of the QSAR society (http://www.pharma.ethz.ch/qsar/). The Hald set I (19) describes the quantitative influence of different constituents on the heat of formation of concrete (number of objects, n=13; number of variables, k=4). The Marengo set II (20) was generated from a linear model Y=1.3X1-0.8X2+1.2. Random noise and three further random variables (X3-X5) were added (n=10; k=5). The Leardi set III (21) is an artificial data set that was used to compare systematic search and genetic algorithms for variable selection (n=16; k=11). The Kubinyi set IV (22) is an artificial data set (n=8; k=5) developed to demonstrate some problems in PLS analysis due to scaling of variables. The Pietrogrande set V (23) was used to correlate binding affinities of 13 benzodiazepines with the chromatographic parameters (n=13; k=6).
3
The Hasegawa sets VI and VII (24) describes relationships between ETA (VI) and ETB (VII) receptor affinities of 16 endothelin analogues and different physicochemical and steric parameters (n=16; k=7). The Dunn set VIII (25) was used to study E-receptor-agonistic binding activities of phenethylamines and phenylethanolamines (n=15; k=8).
The Hansch sets IXa and IXb (26) describe dihydrofolate reductase (DHFR) inhibition by pyrimidines. Six compounds (2, 20, 22, 23, 25, 108) in the original set IXa (n=111; k=13) were characterized as outliers in a Free-Wilson analysis and were removed (set IXb, n=105; k=13). The Kelder sets Xa and Xb (27) describe behaviour modifying activities of ACTH-related peptides. Three compounds (10, 41, 55) in the original data set Xa (n=55, k=24) were considered to be outliers and were removed (set Xb, n=52, k=24). The Selwood set XIa and XIb (28) describe antifilarial activity of 31 antimycin analogues. The PNN algorithm was applied to set XIa with all variables (n=31; k=53) and also to the subset (XIb, n=31; k=11) of 11 variables (4, 5, 11, 17, 35, 36, 38-40, 50, 52) that were identified as relevant by the evolutionary algorithm studies (29).
Method The important feature of the PNN Iterational GMDH algorithm is its ability to identify both linear and non-linear polynomial models using the same approach. The algorithm can be described as following. Let us designate X={x1, x2, ..., xn} the number of input variables and determine the class of models G that is characterized by the next properties: 1) Class G contains structures that are linear according to the parameters. For example, . 2 . . . 3 model y = a x + b z and y = a z + b sin(x ) are non-linear according to variable x and linear according to variable z and parameters a and b. Under “structure” we assume any model with unidentified parameters (i.e., a and b can be any non-zero coefficients in the aforementioned examples). 2) There is (and it is known) a transform g() such as g(fi, fj) G, if fi, fj G;
3) Any element of class G is either constant or one of initial input variables, or it is calculated using transform g() applied to other elements of the class, maybe, several times. In the simplest case, the class G consists of linear functions only. The transformation g() can be defined as g(fi, fj) = afi+bfj in this case. Such class contains only limited number of k+1 structures, that is equal to 2 -1, where k is number of the input variables. If class G
4
contains polynomes of arbitrary degree, the transformation g() can be defined as g(fi, fj, fk) = afi + bfj fk. Such class contains an infinite number of structures. The purpose of the general regression algorithm is to find a subset of variables {xi1, xi2, ..., xik} and a model y = ui (xi1, xi2, ..., xik) that minimize some criterion value. The examples of criterion are 2
AR= SUM(Ycalc-Yexp) /n
(1)
and 2
FPE=SUM(Ycalc-Yexp) (N+n)/(n-N)
(2)
where Ycalc and Yexp are calculated and target values, n is the number of molecules in the considered set and N is number of terms in the model. The first criterion AR is known as regularity criterion and it is traditionally used in GMDH approaches. This criterion should be calculated using the validation data set. This provides regularization of the model and prevents its overfitting (14). However, the selection of the representative validation set by itself is a complex problem for small data sets. The second one is known as Mellows (30) or Akaike Final Prediction Error (FPE) criterion (31) and it is used to select regression and 2 autoregression models with high prediction ability. The SUM(Ycalc-Yexp) /(n-N) estimates the dispersion of the error while the multiplier N+n prevents overfitting and provides the regularization of the models. The PNN models selected according to this criterion can be more simple than the correct underlining physical model that can increase the prediction ability of the method (15). The optimal complexity of such models depend on the level of the noise in the analyzed data. Therefore and because of its simplicity the criterion FPE was used in the current study. It should be noted, that other more complex criteria such as Akaike information criterion (AIC) (32) or Schwarz information criterion (SIC) (33,34) can be used to select the unbiased models. The algorithms realizing traditional PNN are implemented as iteration procedures. On the first step of the iterational algorithm a set of considered models W is equal to the number of input variables, i.e. W1 = X. All possible models of form f = g(w1i, w1j) = g(xi, xj) are analyzed and some number F of the stored models with minimum criterion values are selected. On the second step, the input variables are extended by including F best models selected on the first step, i.e. W2 = X U F1. The search of the best models is provided using set W2 and new set of best models F2 is selected. The search procedure is repeated and on each step t, a new set Wt=X U Ft-1 is analyzed. The iteration process quickly converges to the least square solutions under very general assumption on properties of the analyzed input data. Since the number of iterations can be large, the application of the algorithm generates very complex models that cannot be easily interpreted except in the linear case. It is possible to incorporate in the class G of models some preliminary information or desired properties of the expected solution. These limitations can specify, for example, 5
the number of terms and the maximal degree of polynoms in calculated regression equation. This requirement is important for finding models that can be easily interpreted by the user. We elaborated PNN with control of the complexity of the model. In this algorithm the coding of the structures of polynomial models is done using simple q1 q2 numbers. Each term xi ·xj in the equation is coded as a multiplication of simple numbers a iq1·iq2 (Gedel’s number). The polynom is coded using vector of Gedel’s numbers (35,36). Thus, the number of terms in equation is simply given by the number of non-zero elements in the vector. The degree of new model is controlled taking into account that if g(wi, wj, wl)=a wi+b wj wl, than power(g(wi,wj,wl)) = max(power(wi), power(wj) + power(wl)),
(3)
where power() designates the power of the polynom. The restriction power(wi) < p makes it possible to search models in class of polynomes with degree less than p. This coding also allows to easily detect and to exclude models that are repeated several times. The result of calculations is a regression equation, that is linear, if class G of models is linear, and non-linear in all other cases. The power and number of terms in equations are defined by the user or can be automatically selected using full cross-validation method, by the same way used to optimize the number of latent variables in PLS method. WWW implementation software The most critical part of the user-friendly graphical software is closely dependent of specific computer platforms and, sometimes, even to specific release of the system software (i.e., visualization programs developed using DOS or different version of Windows software are very often incompatible). This situation changed dramatically since the appearance of the Java language (37). From the beginning, inspired by the first steps in development of the World Wide Web (WWW) browsers, the Java creators envisioned the same Java program running on different types of computer chips and in many different operating environments. The Java interpreter is the key to run the same Java program working on different computers. The Java compiler does not convert a program to a machine language specific to the computer on which it will run. Instead, the compiler converts the program to machine language that runs on a theoretical machine, so called Java Virtual Machine (JVM). The JVM is implemented in software and represents the Java interpreter. The JVM are developed for most computer platforms and computer systems. The different Java interpreters allow the same Java program to run on different machines efficiently. Another important feature of this software is that Java programs, so called applets, can be easily accessible over the Internet using WWW browsers. Thus, we selected this language for the development of the graphical interface for our program. The interpreter programs are significantly slower than programs operating in native mode. This makes unreasonable to use Java programs for time consuming calculations, like 6
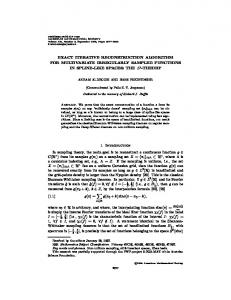
those required for data analysis. To overcome these principal restrictions of Java, the computational part of the program was written exclusively in C++ language. The C++ compilers are also available for most computer platforms. The combination of both languages, Java and C++, allowed us to create a software package with a comprehensive graphical interface that can be efficiently used to perform PNN calculations using WWW browsers. We have used version Java 1.1 that is currently supported by the popular WWW browsers, such as Netscape 4.6 and Internet Explorer 5. The detailed description of the client-server interactions implemented in our approach will be described in a specialized journal (38). Here, we briefly summarize the client interface that is available for a user. The client applet is available from http://www.lnh.unil.ch. It consists of several panels, that can be selected using the choice field at the upper-left corner of the applet. The lowest part of the applet contains status bar and it used to notify the user about some important events, such as availability of calculated results, syntax errors in data for keywords, etc. “Data parameters” (Figure 1). This panel contains the keywords that specify the characteristics of the input data, such as the number of input variables (INPUTS), whether the input data contains labels (NAMES), the order of dependent and independent variables, etc. A click on each underlined keyword, provides hyperlink with detailed information or opens a text area with a data field. The keywords INCLUDE and AVOID specify input variables should be included or excluded from the analysis (the default option is to use all parameters). Keyword MODELS makes it possible to save the calculated models and to use them afterwards with new unseen sets of data. The calculated models should be copied (using copy-paste command) in the area below the keyword SAVED MODELS. In the same way the input data should be provided in the area below the keyword DATA. The security reasons forbid untrusted Java program to directly access files on the client part. Currently we are working on integration of Java and Java-Script languages, that will allow the user to download data files directly from the client disk. “PNN parameters”. This panel contains keywords with description of PNN parameters. The user can specify the maximal DEGREE of the model, the NUMBER of terms in the final equations, the CRITERION according to which the best models (specified by the keyword STORED) are selected. The RR criterion requires the user to specify the VALIDATION set. The LOO option makes possible to perform the leave-one-out calculations using the selected model parameters. The number of ITERATIONS of the algorithm is usually set to 15. The keyword ANALYSIS specify if PNN parameters will be optimized according to the minimum LOO error, i.e. option “select params”, or no optimization will be performed, “fit data”. The output information is controlled using the PRINT keyword. If some combinations of parameters are not allowed, the corresponding 7
field of the keyword changes its default color and appearance and the user is notified by a message in the status line at the botton of the applet window. “Input Data & Results”. This panel contains the information that is sent to the C++ server for calculations and the calculated results. Initially, this panel does not contain any data. It is filled-in after the user clicks on the “Create Request=>“ button. The configuration file (“cfg file”) is created according to the specified keywords and in the syntax supported by the C++ program. The data and the “cfg file” are sent to the server for calculations after the user clicks on the “Press to send request” button. The user is notified by the status bar when the results are calculated by the program. The button “Download calculated results” display the results in text mode in this panel and as graphics at the fourth “Calculated graphics” panel. The user can register by filling-in a simple form available through the “Registration” button. The registered users can quit the browsers after the submission of their tasks. They will be notified about completition of their tasks by e-mail. All tasks of non-registered users will be automatically deleted after quitting the browser. “Results graphics”. This panel displays experimental versus calculated values and becomes available after user download some calculated results. The user can select graphics using double mouse click and, in addition, it can enlarge the data region by pressing the mouse and selection any area of the graphic. A click at the graphic provides name of the data point in the file (if it is available) or coordinate of the point. “Examples”. This panel contains examples of parameters and data results files for all tasks of this article. The results files of tasks analyzed in this article are provided in here for the convenience of the users. The calculations of some tasks requires significant time (in order of several hours). Results The PNN method presented in this study offers to the user possibilities to control explicitly the complexity (number of terms in equation and maximal power of the terms) of the model equations. This option provides a flexible way to incorporate some preliminary information into the desired models. The specified parameters should be used with the “fit data” option of the ANALYSIS keyword. In case, the user has no preliminary information about the complexity of the models an automatic selection according to the full cross-validation results can be done using the “select params” option of the ANALYSIS keyword. In this approach, each compound of the training set is moved to a test data set. The remaining compounds are used to calculate the best models according to the remaining training set. The selected models predict activity of the test compound. This procedure is repeated for all compounds from the training set and the summed PRESS values are calculated. The minimum PRESS value determines the optimum complexity of the model that is applied to fit the data. This 8
method corresponds to the use of the regularity criterion AR, applied to optimize the complexity of the models, while selection of each particular model with fixed complexity is done according to the FPE criterion. Let us note, that similar approach is applied to select the number of the latent variables in the PLS method. Thus fitting and cross-validation by PNN and PLS methods can be directly compared. In order to have easy interpretable models, we have fixed the maximal number of terms in the equation to be equal to 8 and the maximum degree of polynoms to be equal to 3. The calculations performed using the “select params” option of the ANALYSIS are summarized in Table 1. The number of stored models was 3. The PNN method tended to select models with small number of terms in equations (Table 1,2). The models with minimum criterion values (Table 2) as a rule included a subset of variables that were also detected as relevant using the MUSEUM approach (2). It was shown that the use of significant variables, as detected by MUSEUM, = improved PLS results (compare data in column 7 vs. column 6 in Table 1). The similar tendency was also observed if only variables found to be relevant by the PNN algorithm were used in the cross-validation calculations (compare the last and 7 columns of Table 1). The PNN calculated linear model for the first two data sets. If results for the concrete formation (set I) are difficult to interpret, the PNN model Y = 1.43X1-0.74X2+1.32 is very similar to Y = 1.3X1-0.8X2+1.2, used to generate the Marengo data set. The coefficients in the equation fitted by PNN could not be exactly the same as in the original equation because of the random noise that corrupted original data and because of limited number of samples (n=10) available for the study. The PNN method, as well as the MUSEUM approach, correctly identified the relevant variables for this data. 2
2
Two exact solutions, Y=X2 and Y=X8 with PRESS=0 were calculated for the Leardi data set. One more exact solution Y=X2*X8 was detected if maximal degree of polynoms included cross-terms. The PLS method tried to fit these data using linear combinations of other parameters, but it calculated significantly worse statistical coefficients. The PNN method model contained a quadratic term for the variable X2 of the Kybinyi data set. The results of this method were considerably better than those obtained by PLS using all variables in the LOO study. The optimization of variable using MUSEUM approach significantly improved cross-validation results of the PLS method. The same improvement was observed for the PNN method, if only two parameters X1 and X2 were used for the LOO study. A very simple model for the Pietrogrande data set indicated a quadratic relationship between single parameter X6, that is the chromatographic retention index measured for
9
the normal-phase silica column, and binding affinities of benzodiazepines. This model calculated much better validation results compared to the PLS method. The second order equation was selected by PNN method to describe ETA receptor affinities of the endothelin analogues (set VI). This equation contained only three parameters (X1, X2, X5), while all seven parameters were found to be relevant in the MUSEUM approach and were used in the PLS method. The affinity of the same set of compounds to the ETB receptor (set VII) was described by the linear equation. The models calculated by PNN algorithm provided lower statistical coefficients compared to PLS for Hansch data sets (IXa and IXb). On the contrary, the PNN results were better for the Kelder data sets (Xa and Xb). Both original, Hansch and Kelder data sets (IXa and Xa), contained some molecules that were excluded as outliers by the Free-Wilson analysis. The PNN method applied to the data sets with outlier molecules tended to select more complex models, that included the high-order terms. The analysis of the refined data sets (IXb and Xb), i.e. the data sets with excluded outliers, calculated the linear models by the PNN method. The PNN method was applied to the Selwood data set with original 53 parameters (XIa) and 11 parameters pre-selected using MUSEUM approach (XIb). This method in both cases selected approximately the same model. The only difference was that the model selected using all available parameters contained a second order term 0.000944*X11*X51 instead of the linear term 0.13*X11 selected for the optimized set of parameters. It should be noted, that variable X51 was not selected by MUSEUM. Thus, despite a 5-fold decrease of the number of input parameters, the best model found by PNN method practically did not change. The cross-validation results calculated by the PNN for this set are higher than previously reported results using several types of artificial neural networks (13) and Genetic Partial Least Squares (39). However, a direct comparison of all these results can be subjective because of differences in the used input variable selection procedures. Discussion This study shows that performance of the PNN method is usually comparable to that of PLS and even better if non-linear models were selected. However, in all cases PNN results were obtained with a smaller set of variables. In general, the variables selected by the PNN were a subset of the variables detected by MUSEUM. Let us notice that in the cross-validation study we performed a comparison of the both methods using the parameters that provided the best LOO results. Another comparison, for example, can include cross-validation study with selection of the parameters of the PLS and PNN method on the basis of the training data set only. The development of software on the Internet is a new field that is developing quickly. Other packages, including software for calculation of partition indices (CLOGP program 10
http://www.daylight.com), multiple sequence alignment (40), groundwater modeling (41), computer-assisted software for neuroscience data analysis (42,43) are also available on the Internet. On-line access to Chemfinder databases (http://www.chemfinder.com) provide a chemist with a possibility to retrieve the chemical formula of more than 75,000 compounds. The programs to calculate different chemical parameters, such as logP (http://esc-plaza.syrres.com/interkow/kowdemo.htm, http://www.daylight.com/daycgi/clogp), molar refractivity (http://www.daylight.com//daycgi/cmr), etc. are also available to any Internet user. This field is very attractive because it provides an easy access to the developed software, makes it publicly available worldwide. The user feed-back can be used to improve the program interface, to add new features and to correct the unavoidable bugs in developing complex software products. Packages that include adequately tested algorithms, documentation, example data sets and technically contacts may be a cost effective and flexible alternative to commercial equivalents. Such packages can be easily used both in education and commercial application and will provide equal opportunities for scientific research in developed and in developing countries.
ACKNOWLEDGMENTS This study was partially supported by INTAS-Ukraine 95-0060, INTAS-OPEN 97-168, NATO HTECH.LG 972304 and the Swiss National Science Foundation FNRS 2150045689.95 grants.
11
Table 1. The Calculated Results for Analyzed Data-Set
Data
PLS
numbe
PNN
r of a
b
2
q
2,c
set
objects
k
c
R
q
I II III IV V VI VII VIII
13 10 16 8 13 16 16 15
4 (3) 5 (2) 11 (4) 5 (4) 6 (2) 7 (7) 7 (5) 8 (3)
3 (2) 2 (1) 1 (1) 3 (4) 2 (1) 2 (2) 4 (4) 2 (2)
0.99 0.92 0.85 0.95 0.91 0.91 0.95 0.96
0.97 0.38 0.46 -2.40 0.59 0.62 0.73 0.85
0.97 0.74 0.62 0.99 0.59 0.62 0.81 0.90
IXa IXb Xa Xb XIa XIb
111 105 55 52 31 31
13 (10) 13 (10) 24 (12) 24 (10) h 53 11 (10)
6 (6) 6 (6) 6 (3) 6 (3) 5 5 (3)
0.89 0.93 0.97 0.99 0.93 f 0.89
0.73 0.82 0.82 0.90 0.20 g 0.66
0.74 0.82 0.84 0.93 0.70
n
d
2
q
2,e
R
q
3 2 1* 2* 1* 3* 3 2*
0.99 0.92 1 1 0.87 0.89 0.95 0.94
0.95 0.58 1 0.55 0.69 0.59 0.78 0.85
0.97 0.58 1 0.99 0.69 0.69 0.83 0.85
7* 7 9* 7 6* 5*
0.86 0.90 0.98 0.98 0.92 0.90
0.71 0.78 0.85 0.92 0.74 0.71
0.71 0.78 0.88 0.93 0.81 0.75
*The stars indicate non-linear PNN models. a
The initial numbers of input variables. The numbers following optimization of input b variables with MUSEUM approach are shown in parentheses. Number of significant PLS c 2 components. The cross-validated q calculated using input variables optimized by MUSEUM approach (unless not stated otherwise the PLS results are from Table 1 and 15 d e 2 of (2)). Number of input variables selected by PNN. The cross-validated q calculated g using input variables selected by PNN method. The MUSEUM approach was not applied f to the whole set of variables. The data are from Table 15 of (29).
12
Table 2. The optimized variables and the best equations calculated using the PNN method.
Data set
MUSEUM
PNN
PNN equations
I
1,2,4
1,2
0.66*X2+1.47*X1+52.6
II
1,2
1,2
1.43*X1-0.74*X2+1.32
III
1,7,10,11
2 or 8
X2 or X8
IV
1-4
2,4
0.18*X2+X4-0.16*X2
V
5,6
6
-4.26*X6
VI
All variables (1-7)
1,2,5
0.34*X1*X5-0.00227*X2 +7.26
VII
1-3,5,6
1,2,6
1.19*X1-0.05*X2-0.18*X6+8.86
VIII
1,4,7
1,2
0.1*X1*X2
IXa
1,4-6,8-13
1,5-6,8-9,11-12
-0.17*X9+0.47*X8-0.99*X5 +0.72*X12 +
2
2
2
2
2
2
2
2
2
2
0.40*X1 -0.64*X6 +0.45*X11 +7.10 IXb
1,4-6,8-13
1,5-6,8-9,11-12
-0.22*X9+0.45*X11-0.68*(X6+X12)X5+0.37*X1+0.43*X8+7.16
Xa
1-3,8,11,14,18,19,21-24
1-3,11,19,21-24
1.98*X19*X21+2.95*X21*X24-2.44*X11*X222
0.98*X1 +1.63*X2*X23+ 2
2
1.09*X3 +0.98*X2+0.67*X23 Xb
1-3,5,8,11,14,19,23,24
1-3,14,19,23-24
-0.97*X1+1.19*X23+1.13*X3+1.96*X19 +1.24*X2+2.90*X24-1.56*X14
XIa
-
4-5,11,40,50-51
2.69*X5*X50+0.39*X4*X40-0.000944*X11*X51
XIb
4,5,11,17,36,38-40, 50,52
4-5,11,40,50
2.63*X5*X50+0.38*X4*X40-0.13*X11
13
Figure 1. The front panel of the PNN program with parameters for specification of data. A click on the underlined keyword provides help. The user should copy-paste the input data and saved models to the corresponding input fields of the applet. The detailed descriptions of format of input and output files are provided through HTML links.
Figure 2. The second panel of the program with parameters of the PNN algorithm.
14
Figure 3. The panel with input data and calculated results. A click on the window button will open a new HTML link with the content of the corresponding result window. This option provides a simple way to save the calculated results. The registered user can submit long tasks and will be notified about the results by e-mail.
Figure 4. The window with graphical display of the calculated results. A double click on a graphic extends it for the whole window. 15
Figure 5. The panel that contains results of all examples analyzed in the article. The user can download parameters and data for each task, modify them and perform customized calculations.
16
References 1. Tetko, I.V., Tanchuk V., Vasil'ev S.A., Khilia V.P., Poda G.I. and Luik A.I. (1995) [Evolutionary programming for finding "structure-activity" relationships in a series of 3phenoxychromone and 3-phenoxy-4-hydroxycoumarin derivatives]. Bioorganicheskaia Khimiia, 21, 809-15. 2. Kubinyi, H. (1996) Evolutionary Variable Selection in Regression and PLS Analyses. Journal of Chemometrics, 10, 119-133. 3. Tetko, I.V., Tanchuk V.Y. and Luik A.I. (1994) Application of an Evolutionary Algorithm to the Structure-Activity Relationship. In Sebald, A.V. and Fogel, L.J. (eds), Proceedings 3rd Annual Conference on Evolutionary Programming. World Scientific, River Edge, NJ, pp. 109-119. 4. Rannar, S., Geladi P., Lindgren F. and Wold S. (1995) A PLS Kernel Algorithm For Data Sets With Many Variables and Few Objects. 2. Cross-Validation, Missing Data and Examples. Journal of Chemometrics, 9, 459-470. 5. Rannar, S., Lindgren F., Geladi P. and Wold S. (1994) A PLS Kernel Algorithm For Data Sets With Many Variables and Fewer Objects. 1. Theory and Algorithm. Journal of Chemometrics, 8, 111-125. 6. Berglund, A. and Wold S. (1997) INLR, Implicit Non-Linear Latent Variable Regression. Journal of Chemometrics, 11, 141-156. 7. Tetko, I.V., Livingstone D.J. and Luik A.I. (1995) Neural network studies. 1. Comparison of overfitting and overtraining. Journal of Chemical Information & Computer Sciences, 35, 826-833. 8. Livingstone, D.J., Manallack D.T. and Tetko I.V. (1997) Data modelling with neural networks: advantages and limitations. Journal of Computer-Aided Molecular Design, 11, 135-42. 9. Baskin, II, Palyulin V.A. and Zefirov N.S. (1997) A neural device for searching direct correlations between structures and properties of chemical compounds. Journal of Chemical Information & Computer Sciences, 37, 715-721. 10. Huuskonen, J.J., Villa A.E.P. and Tetko I.V. (1999) Prediction of partition coefficient based on atom-type electrotopological state indices. Journal of Pharmaceutical Sciences, 88, 229-33. 11. Devillers, J., Domine D. and Guillon C. (1998) Autocorrelation modeling of lipophilicity with a back-propagation neural network. European Journal of Medicinal Chemistry, 33, 659-664. 12. Tetko, I.V., Villa A.E. and Livingstone D.J. (1996) Neural network studies. 2. Variable selection. Journal of Chemical Information & Computer Sciences, 36, 794-803. 13. Kovalishyn, V.V., Tetko I.V., Luik A.I., Kholodovych V.V., Villa A.E.P. and Livingstone D.J. (1998) Neural network studies. 3. Variable selection in the cascade-
17
correlation learning architecture. Journal of Chemical Information & Computer Sciences, 38, 651-659. 14. Madala, H.R. and Ivakhnenko A.G. (1994) Inductive Learning Algorithms for Complex Systems Modeling. CRC Press Inc., Boca Raton. 15. Aksenova, T.I. and Yurachkovsky Y.P. (1988) Characterization of Unbiased Structure and Condition of its J- Optimality. Soviet Journal of Automation and Information Science, 21, 24-32. 16. Maddalena, D.J. and Johnston G.A. (1995) Prediction of receptor properties and binding affinity of ligands to benzodiazepine/GABAA receptors using artificial neural networks. Journal of Medicinal Chemistry, 38, 715-24. 17. Ivakhnenko, A.G. and Ivakhnenko G.A. (1998) Inductive Methods of Prediction and Analysis of Complex Systems in Economics. Economist, 88-97. 18. Lemke, F. (1995) SelfOrganize! - software tool for modelling and prediction of complex systems. SAMS, 20, 17-28. 19. Hald, A. (1952) Statistical Theory with Engineering Applications. Wiley, New York. 20. Marengo, E. and Todeschini R. (1991) Chemometrics Intell. Lab. Systs., 12, 117120. 21. Leardi, R., Boggia R. and Terrile M. (1992) Genetic algorithms as a strategy for feature selection. Journal of Chemometrics, 6, 267-281. 22. Kubinyi, H. and Abraham U. (1993) Practical Problems in PLS Analysis. In Kubinyi, H. (ed.), 3D QSAR in Drug Design. Theory, Methods and Applications. ESCOM, Leiden, pp. 717-728. 23. Pietrogrande, M.C., Dondi F., Borea P.A. and Bighi C. (1989) Principal Component Analysis in Structure-Retention and Retention-Activity Studies of Benzodiazepines. Chemometrics Intell. Lab. Systs., 5, 257-262. 24. Hasegawa, K., Hirata M., Koshi T., Ohshima T., Miyashita Y., Sasaki S. and Okabe T. (1994) Quantitative Structure-Activity Relationships Study Of Endothelin-1 Analogs. Bioorganic & Medicinal Chemistry Letters, 4, 1157-1160. 25. Dunn, W.J.d. and Wold S. (1978) Structure-activity study of beta-adrenergic agents using the SIMCA method of pattern recognition. Journal of Medicinal Chemistry, 21, 92230. 26. Hansch, C., Silipo C. and Steller E.E. (1975) Formulation of de novo substituent constants in correlation analysis: inhibition of dihydrofolate reductase by 2,4-diamino-5(3,4-dichlorophenyl)-6-substituted pyrimidines. Journal of Pharmaceutical Sciences, 64, 1186-91. 27. Kelder, J. and Greven H.M. (1979) A Quantitative Study on the Relationship between Structure and Behavioural Activity of Peptides Related to ACTH. Journal of the Royal Netherlands Chemical Society, 98, 168-172. 28. Selwood, D.L., Livingstone D.J., Comley J.C., O'Dowd A.B., Hudson A.T., Jackson P., Jandu K.S., Rose V.S. and Stables J.N. (1990) Structure-activity relationships of 18
antifilarial antimycin analogues: a multivariate pattern recognition study. Journal of Medicinal Chemistry, 33, 136-42. 29. Kubinyi, H. (1994) Variable Selection in QSAR Studies. II. A Highly Efficient Combination of Systematic Search and Evolution. Quantitative Structure-Activity Relationships, 13, 393-401. 30. Rothman, D. (1968) Letter to the editor. Technometrics, 10, 661-667. 31. Akaike, H. (1969) Fitting Autoregressive Models for Prediction. Ann. Inst. Statist. Math., 21, 243-247. 32. Akaike, H. (1974) A New Look at the Statistical Model Identification. IEEE Trans. Automatic Control, AC-19, 716-723. 33. Schwarz, G. (1978) Estimating the Dimension of a Model. The Annals of Statistics, 6, 461-464. 34. Neath, A.A. and Cavanaugh J.E. (1997) Regression and time series model selection using variants of the Schwarz information criterion. Communications in Statistics - Theory and Methods, 26, 559-580. 35. Yurachkovsky, Y.P. (1981) Convergence of Multilayer Algorithms of the Group Method of Data Handling. Soviet Automatic Control, 14, 29-35. 36. Yurachkovsky, Y.P. (1981) Restoration of Polynomial Dependencies Using SelfOrganization. Soviet Automatic Control, 14, 17-22. 37. Simkin, S., Bartlet N. and Leslie A. (1996) Java Programming Explorer. The Coriolis Group, Inc., Scottsdale, Arizona. 38. Tetko, I.V. and Villa A.E.P. (in preparation) Design of Client-Server Software for Multi-Purpose Scientific Data Analysis on Web using JAVA and C++. Computers & Biomedical Research. 39. Dunn, W.J. and Rogers D. (1996) Genetic Partial Least Squares in QSAR. In Devillers, J. (ed.), Genetic Algorithms in Molecular Modeling. Academic Press, London, pp. 109-30. 40. Southern, M.R. and Lewis A.P. (1998) JavaShade: multiple sequence alignment box-and-shading on the World Wide Web. Bioinformatics, 14, 821-822. 41. Piggott, A.R. (1999) Publicly accessible software for groundwater modelling and analysis. Computers & Geosciences, 25, 341-346. 42. Jeandenans, L., Gautero M., Grize F., Tetko I.V. and Villa A.E. (1998) Computer assisted neurophysiology by a distributed Java program. Computers & Biomedical Research, 31, 465-75. 43. Filipov, D.V., Iglesias J., Jeandenans L., Tetko I.V. and Villa A.E.P. (1999) Neurophysiological Data Analysis on the Web. Neural Plasticity (suppl), 1, 85.
19