Hindawi Publishing Corporation Mathematical Problems in Engineering Volume 2015, Article ID 265723, 14 pages http://dx.doi.org/10.1155/2015/265723
Research Article Multipeak Mean Based Optimized Histogram Modification Framework Using Swarm Intelligence for Image Contrast Enhancement P. Babu,1 V. Rajamani,2 and K. Balasubramanian1 1 2
Department of MCA, PSNA College of Engineering and Technology, Dindigul 624622, India Vel Tech Multitech Dr. Rangarajan Dr. Sakunthala Engg. College, Vel Tech, Avadi, Chennai 600001, India
Correspondence should be addressed to P. Babu;
[email protected] Received 6 June 2014; Revised 28 July 2014; Accepted 11 August 2014 Academic Editor: Fang Zong Copyright © 2015 P. Babu et al. This is an open access article distributed under the Creative Commons Attribution License, which permits unrestricted use, distribution, and reproduction in any medium, provided the original work is properly cited. A novel approach, Multipeak mean based optimized histogram modification framework (MMOHM) is introduced for the purpose of enhancing the contrast as well as preserving essential details for any given gray scale and colour images. The basic idea of this technique is the calculation of multiple peaks (local maxima) from the original histogram. The mean value of multiple peaks is computed and the input image’s histogram is segmented into two subhistograms based on this multipeak mean (𝑚𝑚𝑒𝑎𝑛) value. Then, a bicriteria optimization problem is formulated and the subhistograms are modified by selecting optimal contrast enhancement parameters. While formulating the enhancement parameters, particle swarm optimization is employed to find optimal values of them. Finally, the union of the modified subhistograms produces a contrast enhanced and details preserved output image. This mechanism enhances the contrast of the input image better than the existing contemporary HE methods. The performance of the proposed method is well supported by the contrast enhancement quantitative metrics such as discrete entropy, natural image quality evaluator, and absolute mean brightness error.
1. Introduction Contrast enhancement plays an important role in the improvement of visual quality for computer vision, pattern recognition, and the processing of digital images. Poor contrast in digital video or images can result from many circumstances, including lack of operator expertise and inadequacy of the image capture device [1]. Contrast enhancement of an image is achieved through redistribution of intensity values. The resultant contrast enhanced image provides feature extraction in computer vision system. Histogram equalization (HE) is one of the commonly used algorithms for contrast enhancement due to its simplicity and effectiveness. It remaps the gray levels based on the probability distribution of the input gray levels. It flattens and stretches the dynamic range of the images histogram which results in overall contrast improvement [2]. HE methods can be categorized into two methods: improved global HE methods (GHE) and adaptive HE (AHE)
methods. The GHE methods improve image quality by extending the dynamic range of intensity using the histogram of the whole image. Since GHE is based on the intensity distribution of the whole image, it causes washed out effect and changes average intensity to middle level [3]. In AHE methods, the equalization is based on the histogram and statistics obtained from neighbourhood around each pixel. These methods can usually provide stronger enhancement effects than global methods. They divide the original image into several nonoverlapped subblocks and perform HE on individual subblocks. The resultant image is produced by merging the subblocks using bilinear interpolation method. However, due to their high computational load, AHE methods are not well suited for real time video applications [4]. The objective of an image enhancement technique is to bring out hidden image details or to increase the contrast of an image with the low dynamic range. Such a technique produces an output image that subjectively looks better than the
2 original image by increasing the gray-level differences among objects and background. Numerous enhancement techniques have been introduced and can be divided into three groups: (1) techniques that decompose an image into high and low frequency signals for manipulation, (2) transform based techniques, and (3) histogram modification techniques. Among the three groups, the third group received the most attention due to their straightforward and intuitive implementation qualities [5]. Some research works have focused on improving HE based contrast enhancement such as brightness preserving bihistogram equalization (BBHE), equal area dualistic subimage histogram equalization (DSIHE), recursive mean separate histogram equalization (RMSHE), weighted thresholded histogram equalization (WTHE), range limited bihistogram equalization (RLBHE), efficient contrast enhancement using adaptive gamma correction with weighting distribution (AGCWD), and contrast enhancement based on layered difference representation of 2D histograms (LDR). Efficient histogram modification using bilateral Bezier curve for the contrast enhancement (BBC) has been proposed in the past years. The aforementioned techniques may create problems when the histogram has spikes or when a natural looking enhanced image is required. The detailed literature of these techniques was given in next section. This paper uses the particle swarm optimization (PSO) and multipeak mean (𝑚𝑚𝑒𝑎𝑛) value for the segmentation of histogram and hence trying to improve the contrast enhancement with the help of optimal threshold value as the enhancement parameters. The technique, multipeak mean based optimized histogram modification framework using particle swarm optimization (MMOHM) is proposed for the purpose of enhancing the contrast as well as preserving essential details for any given input image. Multiple peaks (local maxima) are identified from the input histogram. Then, the mean value of multipeaks is computed and the input image’s histogram is segmented into two subhistograms based on this multipeak mean value. Then, a bicriteria optimization problem is formulated to satisfy aforementioned requirements and the subhistograms are modified by selecting the optimal contrast enhancement parameters. Finally, the union of the modified subhistograms produces a contrast enhanced and details preserved output image. While formulating the optimization problem, PSO is employed to find the optimal values of contrast enhancement parameters. The traditional HE and several HE based methods are analyzed in Section 2. Section 3 presents the proposed MMOHM method along with the statistical measurements to measure the image quality. The results are discussed in Section 4. The conclusion is given in Section 5.
2. Review of Histogram Equalization Methods Consider the input image 𝑋 = {𝑋(𝑖, 𝑗)}, where 𝑋(𝑖, 𝑗) denotes the gray-level of a pixel at (𝑖, 𝑗). The total number of pixels in the image is 𝑁 and the image intensity is digitized into 𝐿 gray levels that are [𝑋0 , 𝑋1 , . . . , 𝑋𝐿−1 ]. If 𝑛𝑘 represents the number of times that the level 𝑋𝑘 appears in the input image 𝑋, then
Mathematical Problems in Engineering the probability density function (PDF) 𝑃(𝑋𝑘 ) for the level 𝑋𝑘 is defined as 𝑃 (𝑋𝑘 ) =
𝑛𝑘 , 𝑁
𝑘 = 0, 1, . . . , 𝐿 − 1.
(1)
Based on (1), the cumulative density function (CDF) is defined as 𝑘
𝑐 (𝑋) = ∑ 𝑃 (𝑋𝑗 ) .
(2)
𝑗=0
HE maps the input image into the entire dynamic range, (𝑋0 , 𝑋𝐿−1 ), by using the CDF as a transform function. The transform function 𝑓(𝑋) based on the CDF is defined as 𝑓 (𝑋) = 𝑋0 + (𝑋𝐿−1 − 𝑋0 ) 𝑐 (𝑋) .
(3)
HE technique is rarely used because it flattens the histogram of an image which results in bringing significant change in brightness and causes undesirable artifacts. Kim has proposed a method known as brightness preserving bihistogram equalization (BBHE) to preserve the brightness [6]. BBHE decomposes the input histogram into two subhistograms based on its input mean 𝑋𝑚 . It is clearly proved that BBHE can preserve the original brightness to a certain extent. Wang et al. proposed a method called equal area dualistic subimage histogram equalization (DSIHE) which is an extension of BBHE [7]. DSIHE differs from BBHE only in the segmentation process. The input image is segmented into two subimages based on median rather than mean. This method is well suited for some images but fails to preserve original brightness for most of the images. Chen and Ramli proposed a method called minimum mean brightness error bihistogram equalization (MMBEBHE) which is an extension of BBHE [8]. It performs the separation process based on the threshold level and it preserves the original brightness of the image. Chen and Ramli proposed a method called recursive mean separate histogram equalization (RMSHE) in which histogram of the given image is partitioned recursively [9]. Unlike BBHE which decomposes the input histogram only once, RMSHE decomposes it recursively up to a recursion level 𝑟 and thereby generating 2𝑟 subhistograms. The resultant subhistograms are then equalized individually to get the contrast enhanced image. Sim et al. proposed a similar method called recursive subimage histogram equalization (RSIHE) [10]. It shares similar recursive framework with RMSHE except that for histogram segmentation, RSIHE uses the median of subhistograms instead of the mean of subhistograms in RMSHE. But, the fact is that as the recursion level increases, the computational complexity also increases and finding an optimal recursion level is a difficult task for all such methods. A detailed study of various bilevel and multilevel partitioning methods are analyzed in [11]. A fast and effective method for video and image contrast enhancement known as weighted thresholded histogram equalization (WTHE) was presented in [4]. WTHE provides a good tradeoff between the two features, adaptively to different images and ease of control, which is difficult to achieve through GHE based enhancement methods. In recursively separated and
Mathematical Problems in Engineering weighted HE (RSWHE) and weight clustering HE (WCHE), different weighing principles are applied successfully [12, 13]. But these methods fail to preserve the spatial relationship among the pixels and their surroundings. Ibrahim and Pik Kong proposed subregions histogram equalization (SRHE) for sharpening the images [14]. Zuo et al. developed the range limited bihistogram equalization (RLBHE) for image contrast enhancement in which the input image’s histogram is divided into two independent subhistograms through a threshold that minimizes the intraclass variance [15]. Then the range of the equalized image is calculated to yield minimum absolute mean brightness error between the original and equalized image. Sundaram et al. proposed a method called histogram modified local contrast enhancement for mammogram images in which the contrast enhancement of the mammogram image can be achieved by histogram modification and local contrast enhancement [16]. BBHE is combined with local enhancement to preserve the brightness and improve performance of detail preservation. It combines spatial edge information with gray information to enhance the local details [17]. In thresholded and optimized histogram equalisation (TOHE), histogram modification was carried out based on otsu’s optimality principle. Then, weighing constraints are applied; mean errors are calculated and the error values were added to the original probability density values for contrast enhancement [18]. Lee and Kim proposed a novel contrast enhancement technique based on layered difference representation (LDR) of 2D histograms [19]. They attempt to enhance the contrast by amplifying the graylevel differences between the adjacent pixels. A constrained optimization problem is formulated based on the observation that the gray-level differences, occurring more frequently in the input image, should be more emphasized in the output image. The optimization problem is solved to derive the transformation function at each layer and then combine the transformation functions at all layers to map input gray levels to output gray levels. Huang et al. proposed an automatic histogram transformation technique called efficient contrast enhancement using adaptive gamma correction with weighting distribution (AGCWD) that improves the brightness of dimmed images via gamma correction and probability distribution of luminance pixels [1]. To enhance the video, AGCWD uses temporal information regarding the differences between the discrete entropy values of each frame to reduce the computational complexity. Efficient histogram modification using bilateral Bezier curve for the contrast enhancement (BBC) is proposed to enhance the quality of the input image and reduce the processing time [20]. The control points of the mapping curve are automatically calculated by Bezier curve which performs in dark and bright regions separately. Using the fast and accurate histogram modification allows this method to transform the intensity for both image and video. Ghita et al. introduced a new variational approach for HE which involves the application of the total variation minimization with a L1 fidelity (TVL1 ) model to achieve cartoon-texture decomposition [21]. The texture information is also employed along with the intensity information to emphasize the contribution of local textural features in the contrast enhancement process. This is achieved
3 by implementing a nonlinear histogram warping strategy that will maximize the information content in the transformed image. Celik and Tjahjadi proposed an algorithm for contrast enhancement which is free from parameter setting [5]. In this method, the pixel values of an input image are modeled using Gaussian mixture model. The intersection points of the Gaussian components are used in partitioning the dynamic range of the image into input gray-level intervals. The gray levels in each input interval are transformed according to the dominant Gaussian component and the CDF of the interval to obtain the contrast equalized image.
3. Multipeak Mean Based Optimized Histogram Modification (MMOHM) HE is the simple and straightforward method for image contrast enhancement. Several HE based techniques were proposed in the past years and a detailed discussion on it is given in the literature. Most of the contemporary HE based techniques have the common drawback of mean shift, which results in brightness degradation, lack of details preservation, and overenhancement. In addition, computational complexity and controllable contrast enhancement become an important issue when the goal is to design a contrast enhancement algorithm for gray scale and color images. The main objective of this paper is to obtain a visually pleasing brightness preserved enhancement method, which incorporates a provision to have a control over the level of contrast enhancement and works well for all types of images. The proposed MMOHM method is an effective technique to combat with the aforementioned pitfalls. MMOHM produces contrast enhanced as well as details preserved output image with the help of the following steps. 3.1. Identification of Peaks and Mean Computation. The first step of the proposed method finds the local maximum points of the histogram by tracing the histogram of the given input image. Generally, peak in the histogram specifies the highest occurrence of some specific gray valued pixel. The histograms of consumer electronics images in general consist of many peaks and, hence, it is desirable to enhance the image around its peaks, which is of prime importance in order to have controlled contrast enhancement and brightness preservation. A point on the histogram is a peak value (local maximum) if its amplitude is more than its neighbors. In order to obtain the peak point, the signs of the difference between two successive probabilities in the histogram are calculated. Let 𝑟 denote a random variable representing discrete gray levels in the range [0, 𝐿 − 1] and let 𝑃(𝑟𝑖 ) denote the peak value corresponding to the 𝑖th value of 𝑟. Then, the 𝑚𝑚𝑒𝑎𝑛 value is calculated as 𝑚𝑚𝑒𝑎𝑛 =
∑𝑁𝑃 𝑖=0 𝑃 (𝑟𝑖 ) , 𝑁𝑃
(4)
where 𝑁𝑃 represents the total number of peaks in the input image histogram. While doing this, if the histogram value is found lower than the 𝑚𝑚𝑒𝑎𝑛 value, then it is made to reach the 𝑚𝑚𝑒𝑎𝑛 value by increasing it or if the histogram value is higher than the 𝑚𝑚𝑒𝑎𝑛 value, it is made to decrease its
4
Mathematical Problems in Engineering
value to reach the 𝑚𝑚𝑒𝑎𝑛 value. Based on 𝑚𝑚𝑒𝑎𝑛 value, the input histogram 𝐻(𝑋) is segmented into two subhistograms, namely, 𝐻𝐿 (𝑋) and 𝐻𝑈(𝑋), where the lower subhistogram 𝐻𝐿 (𝑋) is associated with gray levels ranging from minimum to 𝑚𝑚𝑒𝑎𝑛, that is, {𝑋0 , 𝑋1 , . . . , 𝑚𝑚𝑒𝑎𝑛} and the upper subhistogram 𝐻𝑈(𝑋) is associated with 𝑚𝑚𝑒𝑎𝑛 gray-level to maximum gray-level, that is, {𝑚𝑚𝑒𝑎𝑛 + 1, . . . , 𝑋𝐿−1 }. This type of histogram partitioning helps to avoid some portions of the histogram from being dominated by other portions. The motivation of computing 𝑚𝑚𝑒𝑎𝑛 value is to improve the mean image brightness preserving capability. 3.2. Lower Subhistogram Modification. HE often produces overenhanced, unnatural looking in the output image which leads to loss of information in the original image. Another problem with HE is its large backward difference values of mapping functions. When the input histogram distribution is already uniform, the mapping obtained from cumulative distribution is 𝐶(𝑋𝑘 ) = 𝑋𝑘 , which identically maps input to output. In order to find the level of contrast enhancement, the input histogram 𝐻𝑖𝐿 can be altered so that the modified histogram 𝐻𝑚𝐿 is closer to uniform histogram 𝑈𝑖𝐿 of the lower subimage. It also aims to make the difference between the histograms of modified and input image (𝐻𝑚𝐿 − 𝐻𝑖𝐿 ) small, resulting in the increased potentiality of image contrast enhancement. This is a bicriteria optimization problem since the optimization enhances the contrast of the input image while preserving the details of the original image. So, the output image would be more relevant to the input image. The optimization problem for lower subimage can be defined as min 𝐻𝑚𝐿 − 𝐻𝑖𝐿 + 𝜑1 𝐻𝑚𝐿 − 𝑢𝑖𝐿 . (5) The modified histogram for lower subimage can be obtained by finding an analytical solution for (5) as follows: (𝐻𝑚𝐿 − 𝐻𝑖𝐿 ) + 𝜑1 (𝐻𝑚𝐿 − 𝑢𝑖𝐿 ) = 0 That is, 𝐻𝑚𝐿 − 𝐻𝑖𝐿 + 𝜑1 𝐻𝑚𝐿 − 𝜑1 𝑢𝑖𝐿 = 0.
(6)
Equation (6) can be rewritten as 𝐻𝑚𝐿 (1 + 𝜑1 ) = 𝐻𝑖𝐿 + 𝜑1 𝑢𝑖𝐿 , 𝐻𝑚𝐿 =
(7) 𝐻𝑖𝐿 + 𝜑1 𝑢𝑖𝐿 𝜑 1 =( ) 𝐻𝑖𝐿 + ( 1 ) 𝑢𝑖𝐿 , 1 + 𝜑1 1 + 𝜑1 1 + 𝜑1
where 𝐻𝑚𝐿 , 𝐻𝑖𝐿 , 𝑢𝑖𝐿 , and 𝜑1 are the modified histogram, input histogram, uniform histogram, and the contrast enhancement parameter for lower subhistogram, respectively. 3.3. Upper Subhistogram Modification. The main objective of this method is to find a modified histogram for upper subhistogram that is closer to uniform histogram and to make the difference between histograms of modified image and original image (𝐻𝑚𝑈 − 𝐻𝑖𝑈) small, which results in increasing the potentiality of image contrast enhancement. Then, the bicriteria optimization problem for upper subimage can be written as min 𝐻𝑚𝑈 − 𝐻𝑖𝑈 + 𝜑2 𝐻𝑚𝑈 − 𝑢𝑖𝑈 . (8)
The modified histogram for upper subimage can be obtained by finding an analytical solution for (8) as follows: (𝐻𝑚𝑈 − 𝐻𝑖𝑈) + 𝜑2 𝐻𝑚𝑈 − 𝜑2 𝑢𝑖𝑈 = 0.
(9)
Equation (9) can be rewritten as 𝐻𝑚𝑈 =
𝐻𝑖𝑈 + 𝜑2 𝑢𝑖𝑈 𝜑 1 =( ) 𝐻𝑖𝑈 + ( 2 ) 𝑢𝑖𝑈, 1 + 𝜑2 1 + 𝜑2 1 + 𝜑2 (10)
where 𝐻𝑚𝑈, 𝐻𝑖𝑈, 𝑢𝑖𝑈, and 𝜑2 are the modified histogram, input histogram, uniform histogram, and the contrast enhancement parameter for upper subhistogram, respectively. The value of the contrast enhancement parameters, 𝜑1 and 𝜑2 , is in the range from 0.0 to 1.0 practically in order to avoid overenhancement. For very low value of these parameters, the mapping function gets saturated leading to overenhancement in the output image. When the value of enhancement parameters is zero, this method tends to behave like a traditional HE. When it is nearer to 1.0, the mapping gradually reaches a maximum value, which preserves the naturalness of the image with increased image quality. When these values are greater than 1.0, the mapping function closely reaches identity mapping which means there is no difference between the original image and output image, resulting in no contrast enhancement. The various changes in the levels of contrast enhancement can be achieved by changing the values of these parameters. The optimal value of 𝜑1 and 𝜑2 for both subhistograms can be obtained by using PSO. The MMOHM procedure is given in Algorithm 1. The flowchart representation of MMOHM process is given in Figure 1 3.4. Optimizing the Contrast Enhancement Parameters Using PSO. In the proposed technique, the parameters identified to be optimized are 𝜑1 and 𝜑2 , as these parameters play an important role in controlling the degree of enhancement. PSO is used to find the optimal value of these parameters, since PSO takes lesser time to converge into better optima than the other evolutionary soft computing techniques [18]. PSO is one of the evolutionary computational techniques based on movement and intelligence of swarms looking for most fertile feeding location. A “swarm” is a disorganized collection (population) of moving individuals that tend to cluster together while each individual seems to be moving in a random direction. It uses a number of agents (particles) that constitute swarm moving around in search space looking for the best solution. Each particle is treated as a point in a two-dimensional space which adjusts its “flying” according to its own flying experience as well as the flying experience of other particles. Each particle keeps track of its coordinates in the problem space which are associated with best solution (fitness) that has been achieved so far. This value is called 𝑝𝑏𝑒𝑠𝑡 . Another best value that is tracked by the PSO is the maximum value obtained so far by any particle among the neighboring particle. This value is called 𝑔𝑏𝑒𝑠𝑡 . The PSO concept consists of changing the velocity of each particle
Mathematical Problems in Engineering
5
Input: An image with a total number of 𝑁 pixels in the gray-level range [𝑋0 , 𝑋𝐿−1 ], 𝜑1 , 𝜑2 . Output: The contrast enhanced, details preserved image BEGIN Step 1. Segment the input image into two sub-images (lower and upper sub-histogram of the object) based on multi-peak mean value. Step 2. Generate the input histograms 𝐻𝑖𝐿 and 𝐻𝑖𝑈 for lower and upper sub-images separately. Step 3. Find an uniform histogram 𝑢𝑖𝐿 for lower sub-image using (1), (2) and (3). Step 4. Obtain an optimal value of the contrast enhancement parameters 𝜑1 and 𝜑2 for lower and upper sub-images using optimization PSO procedure. Step 5. Compute the modified histogram 𝐻𝑚𝐿 using the analytical solution of (7) Step 6. For upper sub-image image, obtain an uniform histogram 𝑢𝑖𝑈 using (1), (2) and (3). Step 7. Compute the modified histogram for upper sub-image 𝐻𝑚𝑈 using (10) Step 8. Merge the two modified sub-histograms into a single histogram and display the final contrast enhanced and details preserved output image 𝐻𝑜 is given as. 𝐻𝑜 = 𝐻𝑚𝐿 𝑈 𝐻𝑚𝑈 END Algorithm 1: MMOHM procedure.
Input image
Multipeak mean based segmentation
Choose optimal contract enhancement parameter using PSO for lower subimage
PSO block
Choose optimal contract enhancement parameter using PSO for upper subimage
Apply histogram modification procedure for upper subimage
Apply histogram modification procedure for lower subimage
Merge the lower and upper subimages and display the final contrast enhanced output image
Figure 1: Flow chart for MMOHM.
toward its 𝑝𝑏𝑒𝑠𝑡 and the 𝑔𝑏𝑒𝑠𝑡 position at each time step. The velocity of each particle is modified by using the following equation: V𝑛+1 = V𝑛 + 𝑐1 rand1 ( ) × (𝑝𝑏𝑒𝑠𝑡,𝑛 − 𝑐𝑢𝑟𝑟𝑒𝑛𝑡𝑝𝑜𝑠𝑛 ) + 𝑐2 rand2 ( ) × (𝑔𝑏𝑒𝑠𝑡,𝑛 − 𝑐𝑢𝑟𝑟𝑒𝑛𝑡𝑝𝑜𝑠𝑛 ) ,
(11)
where V𝑛+1 is the velocity of particle at 𝑛 + 1th iteration; 𝑉𝑛 is the velocity of particle at 𝑛th iteration; 𝑐1 and 𝑐2 are the acceleration factors related to 𝑔𝑏𝑒𝑠𝑡 and 𝑝𝑏𝑒𝑠𝑡 ; rand1( ) and rand2( ) are the random numbers between 0 and 1; 𝑔𝑏𝑒𝑠𝑡 is the 𝑔𝑏𝑒𝑠𝑡 position of swarm; 𝑝𝑏𝑒𝑠𝑡 is the 𝑝𝑏𝑒𝑠𝑡 position of particle.
Using the modified velocity, the particle’s position is updated as 𝑐𝑢𝑟𝑟𝑒𝑛𝑡𝑝𝑜𝑠𝑛+1 = 𝑐𝑢𝑟𝑟𝑒𝑛𝑡𝑝𝑜𝑠𝑛 + V𝑛+1 ,
(12)
where 𝑐𝑢𝑟𝑟𝑒𝑛𝑡𝑝𝑜𝑠𝑛+1 is the position of particle at 𝑛 + 1th iteration; 𝑐𝑢𝑟𝑟𝑒𝑛𝑡𝑝𝑜𝑠𝑛 is the position of particle at 𝑛th iteration; V𝑛+1 is the particle velocity at 𝑛 + 1th iteration. The optimized values of 𝜑1 and 𝜑2 are found using Algorithm 2. Two iterations are concerned with PSO algorithm in which the former is involved in processing the number of generations and the latter is used for processing the size of the particles. The performance of this proposed method is
6
Mathematical Problems in Engineering
INPUT: Image with a total number of 𝑁 pixels in the gray-level range [𝑋0 , 𝑋𝐿−1 ] Output: Optimal value of 𝜑1 and 𝜑2 BEGIN Step 1. For each particle (a) Initialize particle with feasible random number End Step 2. Do (a) For each particle (i) Calculate the fitness value (i.e) find the difference between Discrete Entropy values of original and enhanced image. (ii) If the fitness value is better than the best fitness value (pbest) in history then Set current value as the new pbest End (b) Choose the particle with the best fitness value of all the particles as the gbest (c) For each particle (i) Calculate particle velocity according to velocity update (11) (ii) Update particle position according to position update (12) End While (maximum iterations are not attained); Step 3. Output the new population with the optimal values of enhancement parameters 𝜑1 and 𝜑2 Step 4. Stop END. Algorithm 2: Optimization PSO procedure.
decided by number of generations and size of the particles. So, the computational complexity of the proposed method is 𝑂(𝑛2 ). This process is repeated until a predefined termination condition is satisfied, such as the expiration of a maximum number of iterations. Even though the time complexity is more, the selection of PSO is done because of its incredible performance for finding the optimal values of the enhancement parameters for better contrast enhancement. The PSO algorithm is renowned for its implementation simplicity as there is no need to simulate evolutionary operations such as selection, crossover, and mutation. Another salient feature of the PSO is that the best solution is always maintained without explicitly applying elitism; thus a higher diversification can be applied during the search. This algorithm returns the optimal value of the enhancement parameters once it is terminated. 3.5. Image Quality Assessment. The image quality assessment (IQA) aims to use computational models so as to measure the image quality consistently with subjective evaluations. An IQA index used in the evaluation includes discrete entropy (DE) [22], absolute mean brightness error (AMBE) [16], and natural image quality evaluator (NIQE) [23]. Among these measures, the DE can be considered to be an objective function since it provides better tradeoff than the other measures. NIQE and AMBE can be used as supportive measures to evaluate the degree of enhancement and brightness preservation. A detailed discussion of IQA metrics used in the proposed method is given in the following subsections. 3.5.1. Discrete Entropy (DE). DE is used to measure the richness of details in the image after enhancement, where
an original DE value is obtained in an enhanced image. It indicates that more information is brought out from the images. It is defined as 𝐿− ̀1
𝐻 = − ∑ 𝑝 (𝑘) log2 (𝑝 (𝑘)) ,
(13)
𝑘=0
where 𝑝(𝑘) is the probability density function of the 𝑘th graylevel. When the entropy value of an enhanced image is closer to that of the original image, it is considered that the details of the input image are preserved in the enhanced image. The performance of the HE based methods are evaluated by using 80 test images. 3.5.2. Natural Image Quality Evaluator (NIQE). NIQE is used for measuring image quality. It is mainly based on the construction of a “quality aware” collection of statistical features which are again based on simple and successful space domain natural scene statistic (NSS) model. These features are derived from a corpus of natural, undistorted images. The quality of a given test image is expressed as the distance between a multivariate Gaussian (MVG) fit of the NSS features extracted from the test image and a MVG model of the quality aware features extracted from the corpus of natural images and it is given by 𝜀1 + 𝜀2 −1 ) (V1 − V2 ) , (14) 2 where V1 , V2 and 𝜀1 , 𝜀2 are the mean vectors and covariance matrices of the natural MVG model and the distorted image’s MVG model. When the NIQE value of an enhanced image is smaller than that of the original image, it is considered as better image quality [23]. 𝑇
𝐷 (V1 , V2 , 𝜀1 , 𝜀2 ) = √(V1 − V2 ) (
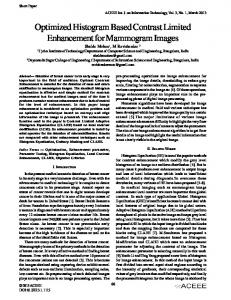
Mathematical Problems in Engineering Convergence graph of the PSO algorithm
0.02 0.018
0.009
0.016
0.008
0.014
0.007
0.012
0.006
0.01
0.005
0.008
0.004
0.006
0.003
0.004
0.002
0.002
0.001
0
0
5
10
15 20 25 30 Number of iterations
Convergence graph of the PSO algorithm
0.01
c
c
7
35
40
0
0
5
10
15
20
25
30
35
40
Number of iterations
c value at iteration
c value at iteration (a)
(b)
Figure 2: Convergence graph for (a) Einstein image and (b) truck image.
3.5.3. Absolute Mean Brightness Error (AMBE). AMBE is used to measure whether the proposed method preserves the original brightness in the enhanced image and it is defined as AMBE (𝑋, 𝑌) = 𝐸𝑛 (𝑋) − 𝐸𝑛 (𝑌) ,
(15)
where 𝐸𝑛 (𝑋) is the average intensity of input image and 𝐸𝑛 (𝑌) is the average intensity of the corresponding enhanced output image. AMBE provides a sense of how the image global appearance gets changed. A median value of AMBE indicates better brightness preservation. Either a very low or a high AMBE value indicates poor performance in the case of contrast enhancement [16]. 3.6. Extending the Proposed Method to Colour Images. The similar approach extending to the coloured images uses their luminance component only and preserves the chrominance components. Another approach for color image enhancement is to multiply the chrominance values with the ratio of their input and output luminance values to preserve the hue. The former approach is employed in this paper, where RGB image is transformed to the CIE 𝐿∗ 𝑎∗ 𝑏∗ color space and the luminance component 𝐿∗ is processed for contrast enhancement. The inverse transformation is then applied to obtain the contrast enhanced RGB image. Hence, the proposed method produces better contrast enhancement for color images also.
4. Results and Discussion The results obtained from existing contemporary methods and the proposed method are simulated on various standard gray scale images like truck, Einstein, aircraft, cameraman, airport, Elaine, bottle, circuit, F16, girl, peppers, pirate, putrajaya, village, house, Jet, and so forth and are compared
with the enhancement quality of the proposed algorithm. 80 test images are used to evaluate the performance and are subjected to PSO based MMOHM process with 40 iterations. The proposed system has been implemented and evaluated on MATLAB. Figure 2 shows PSO based minimum entropy search (convergence graph) for truck and Einstein images. The graphs clearly show the successful implementation of optimal search mechanism. The optimal value of enhancement parameters are obtained in 9th iteration for truck image, since the objective function (difference between DE value of original and enhanced image) reaches minimal value (i.e., zero). The corresponding optimal values for 𝜑1 and 𝜑2 are substituted in (7) and (10) to get the modified histogram for lower and upper subimage. Finally, merge the two subhistograms and display the contrast enhanced details preserved output image. Similarly, the optimal value of enhancement parameters are obtained in 11th iteration for Einstein image since the objective function reaches minimal value in 11th iteration. The convergence graph clearly shows the difference between DE values of original and enhanced image for each iteration. To compare the performance of the proposed method, the same images are enhanced by using the existing contrast enhancement techniques such as GHE, BBHE, DSIHE, WTHE, RMSHE (with recursion level = 2), and RLBHE. In all of these methods, the performance is measured qualitatively by using human visual perception and quantitatively by using three widely used metrics such as DE, AMBE, and NIQE index. The qualitative performance of MMOHM and the contemporary methods are illustrated using Einstein and truck image, which are given in Figures 3 and 5. The original images are given in Figures 3(a) and 5(a). The enhanced images using contemporary enhancement techniques are also shown from Figures 3(b) to 3(g) and Figures 5(b) to 5(g). The encircled portions (Face) in these images clearly
8
Mathematical Problems in Engineering
(a) Original
(e) WTHE
(b) GHE
(c) BBHE
(f) RMSHE (𝑟 = 2)
(g) RLBHE
(d) DSIHE
(h) Proposed MMOHM
Figure 3: (a) Einstein Image; results by various HE techniques (b)–(g), and (h) the proposed MMOHM.
show brightness degradation and over enhancement. HEed image in Figure 3(b) shows that the average brightness is increased instead of increasing the contrast. Though there is not much change in brightness in BBHE, DSIHE, and WTHE, these images are almost similar to each other (Figures 3(c)–3(e)) and the marked portions of them are found to be overenhanced. The same abrupt brightness change and overenhancement can also be noticed in truck image also (Figures 5(c)–5(e)). Figure 3(f) is the results of RMSHE in which the output images are almost similar to original image even for the recursion level = 2. The visual results of RLBHE are shown in Figures 3(g) and 5(g). This method exhibits better results when compared with other contemporary methods. But, this method does not guarantee that it preserves the original image details in the enhanced image. The contrast of the enhanced image is found to increase progressively. Also, the subsequent increase in the contrast has not introduced any unwanted artifacts in the enhanced image. The encircled portions in Figures 3(g) and 5(g) clearly show that RLBHE fails to preserve the original details. Figures 3(h) and 5(h) are the output of the proposed MMOHM. It can be clearly noted that MMOHM exhibits better results in terms of visual perception when compared to the contemporary methods. The contrast of the enhanced image is found to increase progressively noting that the subsequent increase in the contrast has not introduced any unwanted artifacts in the enhanced image. The histogram patterns of original Einstein image, proposed, and existing contemporary methods are shown in Figure 4. In Figure 4(b), the abrupt change in brightness can well be notified due to uncontrolled distribution of histograms. The encircled portions in Figures 4(c)–4(e)
shows overenhancement. Figure 4(f) looks almost similar to original histogram as in Figure 4(a). The marked portion in the histogram of RLBHE (Figure 4(g)) shows that this method fails to preserve the original details whereas Figure 4(h) exhibits the controlled distribution, which results in the expected contrast enhancement. The proposed MMOHM method can be extended for color images also. The original fireworks and light house images are shown in Figures 6(a) and 6(b). The resulting images obtained by the various existing methods and proposed method are also given from Figures 6(c) to 6(f). Figures 6(c) and 6(d) show that GHE provides a significant improvement in image contrast. However, it also amplifies the noise level of the images along with some artifacts and undesirable side effects such as washed-out appearance. The enhancement result of RLBHE is visually unpleasing (Figures 6(e) and 6(f)) and some portions are found to be overenhanced. The results of GHE and RLBHE show that they do not prevent the washed-out appearance in overall image due to significant change in brightness. The visual appearance result shows that the proposed method preserves the naturalness of image and also prevents the side effect due to the significant change in brightness effectively (Figures 6(g) and 6(h)). By visually inspecting the images on these figures, it can clearly be noted that only the proposed method is able to generate natural looking image and still offer contrast enhancement. Hence, MMOHM works well for the color images too. 4.1. Experimental Analysis. Initially, the input image gray-level ranging from (𝑋0 , 𝑋𝐿−1 ) is partitioned into 3 equal subsections. These subsections are ranging between (𝑋0 , . . . , 𝑋𝑚1 ), (𝑋𝑚1 + 1, . . . , 𝑋𝑚2 ), and (𝑋𝑚2 + 1, . . . , 𝑋𝐿−1 ).
Mathematical Problems in Engineering
9
(a)
(b)
(c)
(e)
(f)
(g)
(d)
(h)
Figure 4: Histogram patterns of Einstein image; (a) original; results of (b) GHE, (c) BBHE, (d) DSIHE, (e) WTHE, (f) RMSHE (𝑟 = 2), (g) RLBHE, and (h) MMOHM.
(a) Original
(b) GHE
(c) BBHE
(d) DSIHE
(e) WTHE
(f) RMSHE (𝑟 = 2)
(g) RLBHE
(h) Proposed MMOHM
Figure 5: (a) Truck Image; results by various HE techniques (b)–(g) and (h) the proposed MMOHM.
Then, peak value is found for each subsection. Finally, 𝑚𝑚𝑒𝑎𝑛 of these peak values is computed. The same procedure is to be followed for partitioning the gray-level range into 10 equal subsections and 20 equal subsections of entire gray-level. The decision is to use any of these three cases (3 subsections,
10 subsections, or 20 subsections) which depend on the nature of the input image. This procedure is experimented on three different images, namely, aircraft, u2, and circuit. The aircraft image and the corresponding histogram are shown in Figures 7(a) and 7(b). This image is dominated
10
Mathematical Problems in Engineering
(a) Original
(c) GHE
(e) RLBHE
(g) Proposed MMOHM
(b) Original
(d) GHE
(f) RLBHE
(h) Proposed MMOHM
Figure 6: (a) Fireworks image and (b) light house image. Results by various HE techniques (b)–(f), (g), and (h) the proposed MMOHM.
(a)
(b)
(c)
(d)
(e)
(f)
(g)
(h)
Figure 7: (a)-(b) Original aircraft image and the histogram; (c)–(h) MMOHM enhanced images and their histograms based on the peak values are identified from 3, 10, and 20 subsections.
by high frequency components (light image); MMOHM with 3 subsections cannot give better image quality. But, MMOHM with 10 subsections can produce better contrast enhancement. Similarly, MMOHM with 20 subsections can produce slightly better contrast enhancement than MMOHM with 10 subsections. The enhanced images using MMOHM with 3 subsections, 10 subsections, and 20 subsections and their corresponding histograms are shown from Figures 7(c) to 7(h). From the enhanced images and their histograms, it is observed that whenever the number of
subsections increased, we get a more enhanced image in the event of the input image being a light image. The u2 image and the corresponding histogram are shown in Figures 8(a) and 8(b). Since the image is dominated by low frequency components (darkened image), MMOHM with 3 subsections can give better image quality than the original image. But, MMOHM with 10 subsections can still produce better enhancement than MMHE with 3 subsections. Similarly, MMOHM with 20 subsections can also produce slightly better contrast enhancement than MMOHM with
Mathematical Problems in Engineering
11
(a)
(b)
(c)
(d)
(e)
(f)
(g)
(h)
Figure 8: (a)-(b) Original U2 image and the histogram; (c)–(h) MMOHM enhanced images and their histograms based on the peak values are identified from 3, 10, and 20 subsections.
(a)
(e)
(b)
(f)
(c)
(g)
(d)
(h)
Figure 9: (a)-(b) Original circuit image and the histogram; (c)–(h) MMOHM enhanced images and their histograms based on the peak values are identified from 3, 10, and 20 subsections.
10 subsections. The enhanced images using MMOHM with 3 subsections, 10 subsections, and 20 subsections and their corresponding histograms are shown from Figures 8(c) to 8(h). From the enhanced images and their histograms, it is observed that whenever the number of subsections increased, we get a more enhanced image provided the input image is a dark one. The circuit image and the corresponding histogram are shown in Figures 9(a) and 9(b). Since the images of the histograms are evenly distributed, MMOHM with 3 subsections itself can give better image contrast enhancement. MMOHM
with 10 subsections can also produce more or less similar enhancement like MMOHM with 3 subsections. But, MMOHM with 20 subsections tends to decrease the quality slightly. If the number of subsections is further increased, the enhanced image looks quite similar to the original image. The encircled portion in the circuit image histogram (Figure 9(h)) clearly shows diminution of the gray-level range in the enhanced image. The enhanced images using MMOHM with 3 subsections, 10 subsections, and 20 subsections and their corresponding histograms are shown from Figures 9(c) to 9(h). From the enhanced images and their
12
Mathematical Problems in Engineering Table 1: Comparison of DE values.
IMAGE
Original
HE
BBHE
DSIHE
WTHE
RMSHE
RLBHE
BBC
LDR
AGCWD
MMOHM
Truck Einstein
6.5461 6.8841
5.8041 5.9436
6.4362 6.7379
6.4251 6.7251
6.4693 6.7695
6.3312 6.7208
6.4948 6.8479
6.5121 6.8788
6.6223 6.9211
6.5356 6.8789
6.547 6.882
Aircraft Cameraman Airport
5.4316 7.0097 6.7337
5.0356 5.9106 5.8853
5.2968 6.8081 6.6365
5.2766 6.7792 6.624
5.286 6.7614 6.6286
5.0716 6.9259 6.6217
5.3822 6.9117 6.3464
5.3912 6.9211 6.7141
5.2294 6.9412 6.6926
5.2478 6.9478 6.6923
5.2561 6.9533 6.7581
Elaine Bottle
6.5734 7.4472
5.9397 5.9776
6.4607 7.2744
6.4591 7.2818
6.5513 7.2463
6.2439 7.3624
6.4852 7.2614
6.5421 7.3214
6.5455 7.3763
6.5547 7.4022
6.5608 7.4021
Circuit F16 Girl
6.9439 6.6744 7.2421
5.9354 5.7103 5.9594
6.9194 6.5877 7.0295
6.9316 6.5601 7.0352
6.926 6.4533 7.051
6.8395 6.4677 7.114
6.6416 6.2236 6.2508
6.8786 6.4326 7.3428
6.9211 6.3678 7.1123
6.9023 6.4281 7.2322
6.9311 6.4545 7.2175
Peppers Pirate
7.641 7.3118
5.9815 5.9842
7.473 7.2276
7.4665 7.2276
7.475 7.2473
7.5017 7.1627
7.5913 6.9915
7.5313 6.9821
7.5345 6.9996
7.6101 7.2114
7.6211 7.262
Putrajaya Village House
6.8116 7.4505 6.9166
5.7758 5.9769 5.8
6.6754 7.2994 6.6808
6.6497 7.2911 6.6824
6.6594 7.3165 6.7963
6.6347 7.3001 6.8534
6.7857 7.3393 6.5985
6.9845 7.3992 6.5623
6.9347 7.4091 6.6825
6.8546 7.4193 6.7235
6.6565 7.4272 6.7991
Jet Average
6.552 6.8856
5.8116 5.8395
6.3681 6.7445
6.3296 6.734
6.3299 6.7479
6.3865 6.7211
6.4938 6.6654
6.5433 6.8086
6.5537 6.8027
6.4692 6.8194
6.4664 6.8247
histograms, it is observed that whenever the number of subsections increased, the enhanced image tends to be original, if the image histogram is evenly distributed. From the above observations, it is understood that the input image is dominated by high frequency or low frequency components as given in Figures 7(a) and 8(a). One should identify the peaks from large number of subsections and 𝑚𝑚𝑒𝑎𝑛 value is found based on the peaks identified. This will improve the contrast effectively. When the input image has its histogram components evenly distributed like circuit image (Figure 9(a)), it is better to identify the peaks from smaller number of subsections. The 𝑚𝑚𝑒𝑎𝑛 value is computed and it is enough to obtain better contrast enhancement. Further, the qualities of 80 test images which are enhanced using the above mentioned techniques are measured in terms of DE, NIQE, and AMBE. The DE values obtained from some of the test images are given in Table 1. Table 1 enables us to understand that the proposed method proves to produce better entropy values which are closer to the original image. This signifies that the proposed method is found to preserve the details of the original image in the enhanced image also. In Table 2, the NIQE values of the test images for various HE methods along with the proposed method are given. For most of the test images, NIQE is found to have lower values than other methods for corresponding images. This authenticates that the proposed method is found to increase the quality of the output image. Table 3 shows average AMBE measure for all methods obtained from 80 test images. It shows that, the proposed method can preserve the mean brightness better than the existing HE based enhancement techniques since the average AMBE value for all these enhanced test images as 17.6737 and the average
AMBE for original test images as 34.1451. A median AMBE value indicates better brightness preservation. Most of the HE based enhancement techniques, invariably, attribute to mean shift in output image. This is due to redistribution of intensity values during intensity normalization. However, the proposed technique preserves the mean of the input image. Figure 10(a) shows the comparison of the average DE values of the original, HE, BBHE, RMSHE, WTHE, RLBHE, BBC, LDR, and AGCWD methods along with the proposed method. It is observed that HE drastically changes the original mean of the input image which results in degradation of brightness. But the controlled procedure adopted by MMOHM gives average DE values which are closer to that of original ones. This shows that MMOHM preserves the details of the original image in the enhanced image. The same observation is endorsed from Figure 10(b) by the average NIQE values which make it evident that the MMOHM improves the contrast better than the rest. Figure 10(c) shows the comparison of the average AMBE values of the HE, BBHE, RMSHE, WTHE, RLBHE, BBC, LDR, and AGCWD methods along with the proposed method. From the above results, it is inferred that the proposed method MMOHM produces and preserves brightness along with controlled contrast enhanced output image. The computation of algorithm was implemented using the MATLAB version 6.0. In a personal computer with 3 GHz Processor, most HE based methods required about less than one minute to process one full HD 256 × 256 pixels image. The discussion of time complexity provides only rough comparison as the procedure depends upon many factors such as the choice of the hardware platform and the level of the software optimization.
Mathematical Problems in Engineering
13
Table 2: Comparison of NIQE values.
7.77
7.72
7.67
7.65
7.63
RLBHE
BBC
LDR
AGCWD
MMOHM
HE methods (b)
19.83
AGCWD
15
17.67
19.10
LDR
11.37
20
20.89
25
24.87
19.32
30
26.08
34.15
35
34.67
(a)
40
10 5
MMOHM
BBC
RLBHE
RMSHE
WTHE
DSIHE
BBHE
0
HE
MMOHM 7.5093 7.1709 10.9741 7.9686 8.2654 5.8519 7.1281 8.3758 7.8531 5.7459 6.3625 6.6795 5.768 6.4429 9.3659 10.5586 7.6263
8.22
8.43
HE methods
Average AMBE values
AGCWD 7.9125 7.2456 10.1902 7.7823 8.4569 5.9099 7.6721 8.5637 7.8924 5.9854 6.5537 6.8957 5.7831 6.921 9.2341 9.4532 7.6532
8.92
8.78
9.02
Original
RLBHE
HE
5.5
LDR 7.8823 7.367 8.5632 8.5679 8.5634 5.8992 7.4562 8.6578 7.9971 6.9725 6.392 8.7327 5.2341 6.5602 8.2395 9.6672 7.672
RMSHE
5.7
WTHE
5.9
DSIHE
5.840
6.1
BBC 7.9321 7.3675 9.9765 7.1021 8.2909 5.9026 7.4189 8.6912 7.6117 6.9927 6.4568 8.7671 5.8623 6.6508 8.9023 9.5826 7.7193
BBHE
6.3
HE
6.825 MMOHM
6.5
9.1 8.9 8.7 8.5 8.3 8.1 7.9 7.7 7.5
RLBHE 7.4289 7.2105 8.4665 8.4614 8.2903 5.6807 7.6944 8.4122 7.8178 7.9211 6.6507 8.6744 6.8472 6.6283 8.7654 9.3526 7.7689
7.79
6.819 AGCWD
Average NIQE values
6.803 LDR
RMSHE 9.0152 8.0784 9.1834 7.5214 9.8319 7.9715 7.4663 9.6849 8.5381 5.9396 6.83 7.1687 6.6505 8.1163 9.5735 9.918 8.218
6.809
WTHE 9.2633 8.6024 13.8421 8.6863 9.1243 5.7728 8.1654 7.9532 7.6373 6.8583 6.3459 6.2363 5.7253 7.4104 12.6046 10.7 8.433
BBC
6.721 RMSHE
DSIHE 10.6911 8.9838 15.0399 9.0664 9.2956 6.0677 8.5837 8.313 8.9568 7.1086 6.377 6.6785 5.9769 7.6354 13.0355 10.8457 8.916
6.665
6.748
6.734 DSIHE
BBHE 9.9531 8.8564 15.1879 9.1239 9.5014 5.929 8.6762 7.5192 8.0583 6.9261 6.7949 6.6451 5.669 7.8077 13.2168 10.6305 8.781
WTHE
6.745
HE 10.5953 8.9804 14.5758 9.6771 9.1694 5.5701 8.156 8.6751 8.0299 7.1748 6.7126 6.8432 6.832 8.6245 13.541 11.157 9.0196
BBHE
6.7
Original
Average DE values
6.9
6.886
IMAGE Original Truck 7.9686 Einstein 7.2088 Aircraft 10.4572 Cameraman 7.4073 Airport 8.6812 Elaine 6.4449 Bottle 7.6794 Circuit 8.591 F16 8.2282 Girl 5.6609 Peppers 6.7165 Pirate 6.717 Putrajaya 6.4962 Village 6.4567 House 9.2706 Jet 10.6356 Average 7.7888
HE methods (c)
Figure 10: Comparison of (a) average DE values, (b) average NIQE values, and (c) average AMBE values.
14
Mathematical Problems in Engineering Table 3: Average AMBE values for 80 test images.
Methods HE AMBE values 34.14506
BBHE 19.31967
DSIHE 26.07905
WTHE 34.66607
5. Conclusion This paper uses multipeak mean value to partition the input image into two subimages. Then the particle swarm optimization is used to find optimal contrast enhancement parameters to modify the subhistograms. Finally, the union of the two modified subhistograms produces a contrast enhanced and details preserved output image. It is apparent from the experiments that the proposed MMOHM method creates visually pleasant enhancement effects. This method also eliminates the problems of over enhancement and white saturation which may cause degradation in brightness in the input images. Also, MMOHM accomplishes two major desired objectives of brightness preservation and contrast enhancement for any colored or gray scale images without eliminating the original characteristics of the input image. Moreover, it is not recursive in nature like RMSHE, RSWHE, or RSIHE. This is substantially proved with well known metrics such as DE, NIQE, and AMBE. Hence, this method is more suitable to be employed in consumer electronics for enhancing the contrast of the image without compromising on its visual quality.
Conflict of Interests The authors declare that there is no conflict of interests regarding the publication of this paper.
References [1] S.-C. Huang, F.-C. Cheng, and Y.-S. Chiu, “Efficient contrast enhancement using adaptive gamma correction with weighting distribution,” IEEE Transactions on Image Processing, vol. 22, no. 3, pp. 1032–1041, 2013. [2] Y. Yang, J. Zhang, and X. Huang, “Adaptive image enhancement algorithm combining kernel regression and local homogeneity,” Mathematical Problems in Engineering, vol. 2010, Article ID 693532, 14 pages, 2010. [3] R. C. Gonzalez and R. E. Woods, Digital Image Processing, Prentice Hall, New York, NY, USA, 2nd edition, 2002. [4] Q. Wang and R. K. Ward, “Fast image/video contrast enhancement based on weighted thresholded histogram equalization,” IEEE Transactions on Consumer Electronics, vol. 53, no. 2, pp. 757–764, 2007. [5] T. Celik and T. Tjahjadi, “Automatic image equalization and contrast enhancement using Gaussian mixture modeling,” IEEE Transactions on Image Processing, vol. 21, no. 1, pp. 145–156, 2012. [6] Y.-T. Kim, “Contrast enhancement using brightness preserving bi-histogram equalization,” IEEE Transactions on Consumer Electronics, vol. 43, no. 1, pp. 1–8, 1997. [7] Y. Wang, Q. Chen, and B. Zhang, “Image enhancement based on equal area dualistic sub-image histogram equalization method,” IEEE Transactions on Consumer Electronics, vol. 45, no. 1, pp. 68–75, 1999.
RMSHE 11.36573
RLBHE 24.87203
BBC 20.8934
LDR 19.1032
AGCWD 19.8263
MMOHM 17.67375
[8] S.-D. Chen and A. R. Ramli, “Minimum mean brightness error bi-histogram equalization in contrast enhancement,” IEEE Transactions on Consumer Electronics, vol. 49, no. 4, pp. 1310– 1319, 2003. [9] S.-D. Chen and A. R. Ramli, “Contrast enhancement using recursive mean-separate histogram equalization for scalable brightness preservation,” IEEE Transactions on Consumer Electronics, vol. 49, no. 4, pp. 1301–1309, 2003. [10] K. S. Sim, C. P. Tso, and Y. Y. Tan, “Recursive sub-image histogram equalization applied to gray scale images,” Pattern Recognition Letters, vol. 28, no. 10, pp. 1209–1221, 2007. [11] S.-D. Chen and A. R. Ramli, “Preserving brightness in histogram equalization based contrast enhancement techniques,” Digital Signal Processing: A Review Journal, vol. 14, no. 5, pp. 413–428, 2004. [12] M. Kim and M. G. Chung, “Recursively separated and weighted histogram equalization for brightness preservation and contrast enhancement,” IEEE Transactions on Consumer Electronics, vol. 54, no. 3, pp. 1389–1397, 2008. [13] N. Sengee and H. K. Choi, “Brightness preserving weight clustering histogram equalization,” IEEE Transactions on Consumer Electronics, vol. 54, no. 3, pp. 1329–1337, 2008. [14] H. Ibrahim and N. S. Pik Kong, “Image sharpening using subregions histogram equalization,” IEEE Transactions on Consumer Electronics, vol. 55, no. 2, pp. 891–895, 2009. [15] C. Zuo, Q. Chen, and X. Sui, “Range Limited Bi-Histogram Equalization for image contrast enhancement,” Optik, vol. 124, no. 5, pp. 425–431, 2013. [16] M. Sundaram, K. Ramar, N. Arumugam, and G. Prabin, “Histogram modified local contrast enhancement for mammogram images,” Applied Soft Computing Journal, vol. 11, no. 8, pp. 5809– 5816, 2011. [17] L. Leng, M. Li, and J. S. Zhang, “Histogram equalization algorithm with local adaptive enhancement based on edge details,” Microelectronics and Computer, vol. 27, pp. 38–41, 2010. [18] P. Shanmugavadivu and K. Balasubramanian, “Thresholded and optimized histogram equalization for contrast enhancement of images,” International Journal of Computers and Electrical Engineering, vol. 40, no. 3, pp. 757–768, 2014. [19] C. Lee and C.-S. Kim, “Contrast enhancement based on layered difference representation of 2D histograms,” IEEE Transactions on Image Processing, vol. 22, no. 12, pp. 5372–5384, 2013. [20] F.-C. Cheng and S.-C. Huang, “Efficient histogram modification using bilateral bezier curve for the contrast enhancement,” Journal of Display Technology, vol. 9, no. 1, pp. 44–50, 2013. [21] O. Ghita, D. E. Ilea, and P. F. Whelan, “Texture enhanced histogram equalization using TV-L1 image decomposition,” IEEE Transactions on Image Processing, vol. 22, no. 8, pp. 3133– 3144, 2013. [22] C. Wang and Z. Ye, “Brightness preserving histogram equalization with maximum entropy: a variational perspective,” IEEE Transactions on Consumer Electronics, vol. 51, no. 4, pp. 1326– 1334, 2005. [23] A. Mittal, R. Soundararajan, and A. C. Bovik, “Making a “completely blind” image quality analyzer,” IEEE Signal Processing Letters, vol. 20, no. 3, pp. 209–212, 2013.
Advances in
Operations Research Hindawi Publishing Corporation http://www.hindawi.com
Volume 2014
Advances in
Decision Sciences Hindawi Publishing Corporation http://www.hindawi.com
Volume 2014
Journal of
Applied Mathematics
Algebra
Hindawi Publishing Corporation http://www.hindawi.com
Hindawi Publishing Corporation http://www.hindawi.com
Volume 2014
Journal of
Probability and Statistics Volume 2014
The Scientific World Journal Hindawi Publishing Corporation http://www.hindawi.com
Hindawi Publishing Corporation http://www.hindawi.com
Volume 2014
International Journal of
Differential Equations Hindawi Publishing Corporation http://www.hindawi.com
Volume 2014
Volume 2014
Submit your manuscripts at http://www.hindawi.com International Journal of
Advances in
Combinatorics Hindawi Publishing Corporation http://www.hindawi.com
Mathematical Physics Hindawi Publishing Corporation http://www.hindawi.com
Volume 2014
Journal of
Complex Analysis Hindawi Publishing Corporation http://www.hindawi.com
Volume 2014
International Journal of Mathematics and Mathematical Sciences
Mathematical Problems in Engineering
Journal of
Mathematics Hindawi Publishing Corporation http://www.hindawi.com
Volume 2014
Hindawi Publishing Corporation http://www.hindawi.com
Volume 2014
Volume 2014
Hindawi Publishing Corporation http://www.hindawi.com
Volume 2014
Discrete Mathematics
Journal of
Volume 2014
Hindawi Publishing Corporation http://www.hindawi.com
Discrete Dynamics in Nature and Society
Journal of
Function Spaces Hindawi Publishing Corporation http://www.hindawi.com
Abstract and Applied Analysis
Volume 2014
Hindawi Publishing Corporation http://www.hindawi.com
Volume 2014
Hindawi Publishing Corporation http://www.hindawi.com
Volume 2014
International Journal of
Journal of
Stochastic Analysis
Optimization
Hindawi Publishing Corporation http://www.hindawi.com
Hindawi Publishing Corporation http://www.hindawi.com
Volume 2014
Volume 2014