British Journal of Applied Science & Technology 5(1): XX-XX, 2015, Article no.BJAST.2015.002 ISSN: 2231-0843
SCIENCEDOMAIN international www.sciencedomain.org
Multiple Criteria Decision Making Approach for Evaluating Management Options: A Case of New Zealand Dairy Farming R. Singh1,2*, Arun Kumar2 and Debbie Care1 1
.
School of Engineering, Science and Primary Industries, Waikato Institute of Technology, Private Bag 3036, Waikato Mail Centre, Hamilton 3240, New Zealand. 2 Department of Agricultural and Food Engineering, Indian Institute of Technology Kharagpur, Kharagpur 721 302, India. Authors’ contributions
This work was carried out in collaboration between all authors. Author RS managed the literature searches, conceptualized and formulated the problem performed the analysis and wrote the first draft of the manuscript. Author AK managed the analyses of the study. Author DC managed the data collection. All authors read and approved the final manuscript. Article Information DOI: 10.9734/BJAST/2015/13562 Editor(s): 1. Reviewers: (1) (2) (3) Complete Peer review History:
nd
Original Research Article
Received 22 August 2014 Accepted 19th September 2014 th Published 8 October 2014
ABSTRACT The continuous evolvement of dairy industry in countries like New Zealand, with increased dairy conversions and intensification, has resulted in remarkable economic development, though at the cost of environmental degradation. The increasing use of nitrogen fertilizers to sustain increasing number of cows has increased the risk of enhanced nitrate leaching and methane and nitrous oxide emissions. In this study, Compromise Programming (CP) and Weighted Goal Programming (WGP) have been applied to a Waikato dairy farm to reconcile economic goals with environmental and resources management goals. The models are based on Tier 2 methodology, developed specifically for New Zealand, for determining the energy requirements of cattle. The models are first applied with the current farm management practices to analyse the performance of the farm in meeting the two specific objectives of: (i) Attaining the production target of 1320kg MS ha-1 year-1, _____________________________________________________________________________________________________ *Corresponding author: E-mail:
[email protected];
Singh et al.; BJAST, 5(1): xxx-xxx, 2015; Article no.BJAST.2015.002
set by the farm management for maximizing profit and (ii) Keeping the nitrogen leaching limit to -1 -1 26kg N ha year , as calculated by the agricultural management model OVERSEER nutrient budget. Model results show that with the existing management practices, it is not possible to meet the MS production and nitrogen leaching targets simultaneously. The production target of 1320kg -1 -1 -1 -1 MS ha year results in nitrogen leaching loss of 29kg N ha year whereas the nitrogen leaching -1 -1 target limits the production to 1195kg MS ha year . The results further shows that by keeping the number of cows calving in autumn within 150–200, and by putting an optimum area under the maize crop, it is possible to meet the twin objectives of minimizing the nitrogen leaching and maximizing the profit margins, though the production target has to be lowered significantly.
Keywords: Dairy farming; multiple criteria decision making; Nitrogen leaching; tier 2 methodology; waikato.
1. INTRODUCTION Dairy farming systems throughout the world are facing numerous environmental, technical and economic challenges. This is especially true for countries like New Zealand (NZ) whose export economy depends on dairying. The dairy industry in the country is continuously evolving with increased dairy conversions and intensification. In the last ten years (2001-02 to 2010-11), the total effective dairy farming area has increased by 16.6% whilst the number of cows has gone up by 22.6%, with a corresponding 27.4% increase in the total processed milk [1]. This remarkable economic development, however, has been achieved at an environmental cost as increasing use of nitrogen fertilizers has given rise to nitrate leaching [2]. The increased number of cows and increasing use of nitrogen fertilizers have also raised the risk of increased methane and nitrous oxide emissions, thus compromising New Zealand’s commitment under the Kyoto protocol [3]. The NZ dairy industry, therefore, has to make trade-off among the potentially conflicting economic and environmental goals, and tackle them simultaneously. In this context, multiple criteria decision making (MCDM) models are most appropriate and may play a useful role in decision making. MCDM models have been widely used for strategic planning purposes in agricultural systems [4,5], dairy farming systems [6,7], regional farm level modelling [8], livestock feed blend optimization [9] and in environmental sciences [10]. MCDM models have also been applied to dairy farming systems in conjunction with bio-economic or simulation models [11-13). Though several simulation models have been developed for pasture-based dairy farming systems in NZ [14-17], the application of optimization techniques has mostly remained limited to Linear Programming (LP) models [18-
21] with the exception of the Integrated Dairy Enterprise Analysis (IDEA) framework which is based on nonlinear programming [22]. However, simulation models are usually complex and require detailed information that may not be readily available whereas LP models can only deal with a single objective. In this study, two MCDM techniques, Compromise Programming (CP) and Weighted Goal Programming (WGP) have been applied to a Waikato dairy farm to reconcile economic goals (maximizing milksolids (MS; fat+protein) production per ha; maximizing profit margin over purchased feed cost (MoFC); maximizing metabolizable energy (ME) for milk production) with environmental (minimizing nitrogen leaching per ha) and resources management (minimizing water use) goals. The developed models are based on NZ-specific Tier 2 methodology for determining the energy requirements of cattle, and estimation of the methane and nitrous oxide emissions from the agricultural sector [23] and may be categorized as a ‘support modelling’ tool for making ‘tactical/strategic’ decisions at the farm level [24]. The models are first applied with the current farm management practices, and subsequently the management options of: (i) Deciding the number of cows calving in two seasons, i.e., spring and autumn; (ii) Selecting the most appropriate forage/crop production and feed purchase strategy to meet the cattle needs, and (iii) Combining (i) And (ii) Together, are evaluated. The paper is structured as follows: in Section 2 we present the methodology including the details of the case study farm. In Section 3, the results of the optimization are presented. This is followed by a discussion (Section 4) and conclusions (Section 5).
Singh et al.; BJAST, 5(1): xxx-xxx, 2015; Article no.BJAST.2015.002
2. METHODOLOGY 2.1 Case Study Farm A 345 ha pasture-based dairy farm located in the prime dairying area of the Waikato region is selected for the case study. The Waikato region has fertile volcanic ash derived soils, and it contributes about 30% to the NZ milk production. In the selected farm, perennial pastures and annual crops are grown over 296ha. The perennial pastures include mixed pasture (85% perennial ryegrass+15% white clover), tall fescue, chicory and ryegrass, whereas annual crops include maize and turnip. Maize is grown during October - March and fed during April– September, while turnip is grown during October - December and fed during January–February. The farm database, maintained at a monthly time step, shows that mixed pasture accounts for a minimum of 190 ha whereas annual crops are limited to a maximum of 50ha. The area under maize is further limited to 21ha. The home-grown feed is supplemented by purchased feeds like meal concentrate, palm kernel extracts (PKE), molasses and kibbled maize to meet the animal nutritional requirements. The farm has a maximum annual budget of NZ $ 500000 for purchasing feed. The animal herd at the farm includes milking and dry cows of Friesian-Jersey breed. The cows milk over 305 days and dry-off for two months. Two categories of calves, less than one year old and in between one and two year old, are maintained at the farm, and their number is kept at about 50% of the cows. Bulls (limited to one bull for eighty cows) are typically brought to the farm for a three-month period during November– January. In the Waikato region, cows are generally calved in early spring (late July-August) to match the high feed demand near the beginning of lactation with the period of greatest pasture growth, however, a few farms are now adopting a new management practice of calving a small number of cows in the autumn (March– April) [14]. The case study farm adopts this new management practice and has cows calving in both seasons, with autumn calving maintained at around 150. The farm has a bore well to meet the water requirements. The upper limit on the 3 groundwater use from this well is 250 m during 3 a day and 40000 m during a year (1 June-31 May). Surface water, however, is available to supplement the groundwater supply. Though
water supply is free now, it is expected to be levied soon as several district/regional councils in the neighborhood have already started the practice. The farm management has set a production -1 -1 target of 1320kg MS ha year while demonstrating the industrial responsibility of keeping the nitrogen leaching losses within the desirable limit of 26 kg N ha-1 year-1. The desirable limit on the nitrogen leaching is estimated by the OVERSEER nutrient budget model [25,26], which is the standard tool adopted by NZ agricultural industry for estimating the nutrient losses. 2.2 Technical Coefficients The monthly data related to number and category of animals maintained, milk and MS production, pasture and crop production, water use, and fertilizer application were taken from the farm database for the 2010-11 season. The available information, however, was further supplemented using the existing literature, especially for the average pasture production in the study region, crop yield, feed requirement of animals, and ME content of various feeds [27−1 29]. The milk price for 2010-11 ($7360 t MS) was taken from DairyNZ [30]. All monetary values, throughout the paper, are stated in New Zealand dollars. The energy requirements and dry matter intake (DMI) of cattle, and subsequently the methane (CH4) and nitrous oxide (N2O) emissions were calculated using the Tier 2 methodology developed specifically for New Zealand [23]. This Inventory model [31] uses the Australian Feeding Standards algorithms for freely grazing ruminants [32] and calculates ME requirement for animal weight maintenance, milk production, conception/gestation, live weight gain and grazing. The amount of CH4 released includes methane from dairy cattle and from manure management (both pasture and storage), whereas N2O emission includes N2O from direct sources (fertiliser, animal waste, nitrogen fixing crops, and urine and faeces deposited during grazing) and indirect sources (nitrogen volatilisation from soils and nitrogen leached from soils). The methane and nitrous oxide emission are converted into the carbon dioxide equivalents (CO2-e) by using the conversion factors of 25 for CH4, and 298 for N2O [33]. The CO2 emission is neglected here due to nonavailability of relevant information. The N-
Singh et al.; BJAST, 5(1): xxx-xxx, 2015; Article no.BJAST.2015.002
leaching estimation depends on the amount of nitrogen fertiliser applied to soils, nitrogen excreted by animals and nitrogen from atmospheric deposition (assumed here as 2kg N ha-1 year-1 [34]. A value of 0.07 is used to represent the fraction of nitrogen input to soils that is lost through leaching and runoff [35].
2.3 Mathematical Model The mathematical model is developed based on the basic information described above. The model involves five animal categories, and ten home-grown pasture/crop and purchased feeds. A monthly time step is used with June representing the beginning of the annual farming cycle. The decision variables include tactical choices of the areas under different pastures/crops, quantities of purchased feeds, and number of cows calving in spring and autumn. A total of five objectives are considered: Maximization of milksolids production (Max_MSP), minimization of nitrogen leaching (Min_N_leach), maximization of metabolizable energy for milk production (Max_MEP), maximization of margin over purchased feed cost (Max_MoFC), and minimization of annual water use (Min_AWU). The constraints represent ME and DM requirements of animals and their availability through home-grown and purchased feeds, area available for cultivation, maximum and minimum limits on land allocation to individual pasture or crops, budget available for purchasing feed and daily limits on the water use. Appendix A presents the model description.
2.4 MCDM Techniques There are numerous techniques that are available for handling MCDM problems, with varying suitability in different decision situations. Multi-Objective Programming (MOP) and Compromise Programming (CP) are suitable when only the direction of improvement of the decision attributes relevant to the decision situation at hand is known, whereas Weighted Goal programming (WGP) is recommended when the target values for the relevant decision attributes are known a priori. Further, when the number of objectives considered is more than two, CP is preferred over MOP [36]. Both CP and WGP are considered to be robust methods of analysing decision-making problems in complex environments such as agricultural systems [37].
2.4.1 Compromise Programming (CP) Compromise programming seeks to obtain a solution representing the best compromise amongst the different objectives rather than optimizing only one of them. It seeks a solution as close as possible to the ideal point (vector) comprising of the ideal values for all the relevant objectives. A distance function, minimizing the distance between the solutions and the ideal point, is introduced into the analysis. Two metrics are usually considered: L1 representing the longest distance geometrically, and L∞, the largest deviation from among the individual deviations [38]. The first metric, L1 is minimized by solving the following LP problem [39]:
Minimize
n Z * − Z (x ) L1 = ∑ Wg g * g (1) Z g − Z *g g =1
x∈F
Subject to:
x≥ 0 Where F is the feasible set, x is the vector of decision variables,
Z g* and Z *g are the ideal
and anti-ideal values for objective g,
Z g ( x ) is the
gth objective function, and Wg(>0) is the weight attached to objective g. The second metric, L∞ is minimized by solving the following LP problem [39]:
Minimize
L∞ = d ∞
(2) Subject to:
Z g* − Z g ( x ) ≤ d∞ Wg Z* − Z g *g
for all g
(3)
x∈F x, d ∞ ≥ 0 Where d∞ is the largest deviation. In this study, Wg is taken as one for both metrics. 2.4.2 Weighted Goal Programming (WGP) WGP considers all the goals simultaneously by using a composite objective function. The objectives are converted into goals and incorporated into the model in the form of
Singh et al.; BJAST, 5(1): xxx-xxx, 2015; Article no.BJAST.2015.002
approximate equalities. Positive (pg) and negative (ng) deviational variables, indicating over-achievement or under-achievement, are introduced in the objectives, with the right hand side values representing the targets set by planner that may or may not be satisfied. The composite objective function minimizes the deviations between achievement of the goals and their targets [4]. In WGP, goal satisfaction may be traded-off using relative weights on deviations from the targets in the objective function. Mathematically, the WGP problem is expressed as follows:
ng + p g
n
Minimize
∑W g
g =1
Gg
100
(4)
Subject to:
Z g ( x ) + n g − p g = Gg
for all g ,
x∈F x, ng , pg ≥ 0 Where Ggis the objective target for the goal g. If all the goals have the same importance, then Wg is taken as one, which is the case here. The objective function includes ng or pg depending on whether the Gg is to be underachieved or overachieved. A normalization constant, Gg/100, is used here to overcome the incommensurability [40].
2.4 Pay-off Matrix The application of CP involves definition of *
ideal ( Z g ) and anti-ideal
( Z*g ) values, and WGP
definition of target (Gg) values, for each objective. These values were obtained by solving the conventional LP problems for each objective [38]. A pay-off matrix was prepared by maximizing or minimizing the five objectives defined by (A1) – (A5) (Appendix A). However, to reflect the existing farm management practice of maintaining 150 milking cows during the winter season, an additional constraint was included in the model to keep the number of cows calving in March-April fixed at 150.
2.5 Modelling Scenarios and Management Options The CP and WGP models are first applied to the case study with the existing farm management
practices. Based on the results, the WGP model is then applied to evaluate the performance of the farm with the two specific objectives of: (i) -1 Meeting the production target of 1320kg MS ha -1 year and (ii) keeping the nitrogen leaching -1 losses within the desirable limit of 26kg N ha -1 year . In these two model runs, goals reflecting maximization of MSP and minimization of N_leach, (A1) and (A2) (Appendix A), are treated as rigid constraints and assigned fixed objective targets (Gg) of 1320 and 26 respectively. The WGP model is further applied to evaluate the management options of: (i) Deciding the number of cows calving in two seasons, i.e., spring and autumn; (ii) Selecting the most appropriate forage/crop production and feed purchase strategy to meet the cattle needs, and (iii) combining (i) and (ii) together. This is because with the growing focus on N-leaching and GHG emissions, there has been increased interest in alternative forages and feeding strategies to supplement the traditional perennial ryegrass-white clover feed-base in pasturebased dairy farms [41,42]. These alternative feeding strategies may also alter the herd structure, especially the number of cows calving in the two seasons, to match the nutrient availability [18,43]. To analyze the management option (i), The number of cows calving in the autumn is varied around 150, i.e., 100, 200, 250 and 300, and the WGP model is run for each case. For the management option (ii), The WGP model is run without constraints on individual pastures/crops, i.e., by eliminating constraints (A9) – (A12) (Appendix A). The effectiveness of the different management options is compared in terms of attributes like MSP, N-leaching, MEP, MoFC, feed cost and the resultant GHG emissions in terms of CO2-e.
2.6 Validation of Model Results Though it is difficult to validate the results of an optimization model, an attempt is made here to validate the N-leaching values obtained from the WGP model runs by setting up the OVERSEER nutrient budget model for select cases. The OVERSEER model has been chosen because it is extensively validated for leaching load estimation from NZ farming systems [35] and thus could be used as a validation tool. The key outputs of the optimization model, i.e., number of animals of different categories, quantity of milk produced, area under different forages/crops and quantity of supplements purchased are used as input while setting up the OVERSEER model,
Singh et al.; BJAST, 5(1): xxx-xxx, 2015; Article no.BJAST.2015.002
along with the farm specific data on climate, soil characteristics, nitrogen fertiliser use and effluent application. The N-leaching loads determined from the OVERSEER model runs are used to validate the optimization results.
3. RESULTS 3.1 Pay-off Matrix Table 1 presents the pay-off matrix obtained by optimizing each objective separately using LP. Each row of Table 1 shows the optimal objective function value (underlined) along with the corresponding values of the other objectives. For example, the first row of Table 1 shows that the optimal milksolids production (MSP) is 1428kg -1 -1 MS ha year , which corresponds to nitrogen -1 -1 leaching (N_leach) of 31kg N ha year , metabolizable energy for milk production (MEP) of 23790597 MJ, margin over feed cost (MoFC) of 2.149 M$ and annual water use (AWU) of 3 50515 m . The pay-off matrix clearly reflects the wide range that each objective can attain. It shows that objectives Max_MSP, Max_MEP and Max_MoFC are complementary to each other. It further shows that objectives Max_MSP and Min_N_leach or Min_AWU are at opposite extremes, which implies the need for compromise between these. Such results can be explained by the fact that maximizing MSP entails larger number of milking cows which in turn results in higher N-leaching or necessitates higher amount of water consumption. A careful examination of the payoff matrix leads to an important conclusion that the production target of 1320kg MS ha-1 year-1 set by the farm management cannot be attained while keeping the nitrogen leaching losses within the desirable -1 -1 limit of 26 kg N ha year . The best value of each objective in Table 1 was further used to define the ideal values
( Z g* ) in
CP and to set the target values (Gg) in WGP, whereas the worst value of each objective defined the anti-ideal values ( Z *g ) in CP.
3.2 Compromise and Programming
Weighted
Goal
Table 2 presents the most efficient compromise set obtained by the CP model for the two metrics L1 and L∞, and goal values attained by the WGP model with the existing farm management
practices. As evident, the compromise solution obtained by CP corresponding to metric L1, and WGP solution are exactly the same, showing about 99% achievement of the ideal values for milk solids production, ME for milk production and margin over feed cost. The ideal values for N-leaching and annual water use are, however, overachieved by about 19%. It further emphasizes the conflict between the objectives of milk solids production and N-leaching. Table 3 presents the herd structure, land allocated to different pastures/crops and cost of purchased feed obtained by CP and WGP models. The major difference between the solutions obtained by CP model corresponding to metric L1 and WGP model, and CP model corresponding to metric L∞ lies in the number of cows calving in spring (and the resultant reduction in the number of calves due to model assumption). This explains the reduced milk solids production and N-leaching obtained in the L∞ solution, as number of cows drives the milk solids production whereas total animals at the farm govern the N-leaching losses. In all three solutions, the entire 296 ha area was cultivated and the entire budget available for purchasing feed was invested. All three models assigned maximum possible area to the annual crops, maize and turnip, indicating a possibility of increasing the cultivable area under these crops from the present limit of 50ha. Among the pastures, models preferred mixed pasture and chicory (WGP and L1 metric of CP). GHG emissions (sum of CH4 and N2O emissions converted into CO2-e) is estimated at 3466 tonnes CO2-e for the solution corresponding to metric L1 of CP model and WGP model, and 2943 tonnes CO2-e for solution corresponding to metric L∞ of CP model. In terms of per litre of milk, the estimated GHG emissions are about 0.8 kg CO2-e l-1 of milk. This value is similar to those reported for dairy farms in New Zealand, UK and other European countries [44,45]. Table 4 presents the WGP model results for farm specific objectives of meeting the production -1 -1 target of 1320kg MS ha year (MSP_1320) and keeping the nitrogen leaching losses within the -1 -1 desirable limit of 26kg N ha year (N_leaching_26). Results reiterate that the -1 -1 production target of 1320kg MS ha year set by the farm management cannot be attained while keeping the nitrogen leaching losses within the -1 -1 desirable limit of 26kg N ha year . This is -1 -1 because MSP of 1320kg MS ha year results in -1 -1 N-leaching loss of 29kg N ha year whereas N-
Singh et al.; BJAST, 5(1): xxx-xxx, 2015; Article no.BJAST.2015.002
leaching loss of 26kg N ha-1 year-1 limits MSP to -1 -1 1195kg MS ha year (Table 4). Thus, within the existing constraints, farm management has to compromise on either of the two targets. The production target of 1320kg MS ha-1 year-1 requires 666 cows (516 calving in spring) resulting in MoFC of 2 M$ compared to 604 cows (454 calving in spring) with MoFC of 1.949 M$ for -1 -1 the N-leaching target of 26kg N ha year . GHG emissions are estimated at 3222 tonnes CO2-e
for MSP_1320, and 2932 tonnes CO2-e for N_leaching_26. Results further show that the annual water requirement exceeds the 40000 m3 of groundwater available at the farm in all cases (Tables 2 and 4), thus necessitating reliance on surface water. Since the water supply in the near future may be on payment basis, farm management may have to keep a check on this additional expenditure.
Table 1. The pay-off matrix Objective
Max_MSP Min_N_leach Max_MEP Max_MoFC Min_AWU
Max_MSP (kg MS ha-1 -1 year ) 1428 1200 1428 1428 1200
Objective Optimised Min_N_leach (kg Max_MEP N ha-1 year-1) (MJ)
Max_MoF C (M $)
Min_AWU (m3)
31 26 31 31 26
2.149 1.874 2.149 2.149 1.779
50515 42322 50515 50515 42322
23790597 20003291 23790597 23790597 20003291
Table 2. Most efficient compromise set (CP model) and attained values of goals (WGP model) for the case study farm
Objective function Max_MSP -1 -1 (kg MS ha year ) Min_N_leach -1 -1 (kg N ha year ) Max_MEP (MJ) Max_MoFC (M$) 3 Min_AWU (m )
Compromise Programming (CP) Metrics L1 L∞ 1426 1200
Weighted Goal Programming (WGP) 1426
31
26
31
23785547 2.144 50246
20016594 1.726 42322
23785547 2.144 50246
Table 3. Herd structure, land allocation and feed cost obtained from compromise and goal programming models Attributes
Herd structure Cows calving in spring (July-August) Cows calving in autumn (March-April) Bulls Calves Land allocation (ha) Mixed pasture Chicory Maize Turnip Feed cost (NZ $) GHG emission (tonnes CO2-e)
Compromise Programming (CP) Metrics L1 L∞
Weighted Goal Programming (WGP)
570 150 9 360
460 150 8 305
570 150 9 360
190 56 21 29 500000 3466
246 0 21 29 500000 2943
190 56 21 29 500000 3466
Singh et al.; BJAST, 5(1): xxx-xxx, 2015; Article no.BJAST.2015.002
Table 4. Weighted goal programming results in meeting farm specific milk solids production and Nitrogen-leaching targets Attributes -1 -1 Max_MSP (kg MS ha year ) -1 -1 Min_N_leach (kg N ha year ) Max_MEP (MJ) Max_MoFC (M$) Min_AWU (m3) Herd structure Cows calving in spring (July-August) Cows calving in autumn (March-April) Bulls Calves Land allocation (ha) Mixed pasture Chicory Maize Turnip Feed cost (NZ $) GHG emission (tonnes CO2-e) *
†
MSP_1320 1320 29 22022243 2.000 46539
*
N_leaching_26 1195 26 19935479 1.949 42151
516 150 8 333
454 150 8 302
234 12 19 31 448230 3222
234 12 21 29 267471 2932
-1
-1
†
Fixed production target of 1320kg MS ha year -1 -1 Fixed nitrogen leaching target of 26kg N ha year
3.2.1 Validation of model results
3.3 Analysis of the Management Options
TheWGP model runs corresponding to the farm specific objectives of meeting the production target of 1320kg MS ha-1 year-1 (MSP_1320) and keeping the nitrogen leaching losses within the desirable limit of 26kg N ha-1 year-1 (N_leaching_26) were randomly selected for validating the N-leaching losses estimated by the optimization model. The key outputs of these runs were extracted at monthly time step (Table 4 presents the consolidated results), and used to set up the OVERSEERnutrient budget models. Additional data on climate, soil characteristics, nitrogen fertiliser use and effluent application were taken from the farm database. The OVERSEER model resulted in a nitrogen -1 -1 leaching loss of 28.5kg N ha year with -1 MSP_1320 inputs, and 27 kg N ha year-1 with N_leaching_26 inputs. The corresponding Nleaching losses estimated by the optimization model are 29 kg N ha-1 year-1 and 26kg N ha-1 -1 year (Table 4), and hence, the optimization model results may be treated as quantitatively validated. The minor difference in the results by two approaches may be attributed to the fact that OVERSEER is acomprehensive model that takes into account the farm climate and soil characteristics whereas Tier 2 methodology used in the optimization model is based on empirical relationships.
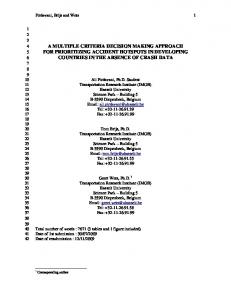
3.3.1 Number of cows calving in two seasons Fig. 1 presents the effect of varying the number of cows calving in autumn on MSP, N-leaching, MoFC, GHG emissions, and annual water use. As evident, the total number of cows maintained at the farm and N-leaching loss remain almost the same in all cases; however, reducing the number of calving in the autumn from 150 to 100, or increasing it to 250 or 300, decreases the milk solids production and the margin over feed cost slightly. It is seen that increasing the number of autumn calving to 200 produces almost the same results as with the existing 150 calving, though there is a minor increase in MoFC. The results show that the existing farm management practice of 150 calving in autumn is near optimal. Therefore, the farm should maintain around 720 cows, with 150 or 200 cows calving in autumn. 3.3.2 Forage/crop production purchase strategy
and
feed
Since both 150 and 200 cows calving in autumn produce similar results, management option (ii) and (iii), i.e., selecting the most appropriate forage/crop production and feed purchase strategy, and combination of autumn calving and selecting the most appropriate forage/crop production and feed purchase strategy are taken together. The management option (ii) is
Singh et al.; BJAST, 5(1): xxx-xxx, 2015; Article no.BJAST.2015.002
considered with 150 calving in autumn and option (iii) with 200 calving; WGP models corresponding to these options are then run without constraints on individual pastures/crops. Table 5 presents the results. The exclusion of constraints on individual forage or crop leads to abundant supply of metabolizable energy for milk production, and increases the number of cows that could be maintained at the farm to 788. This leads to a considerably higher MSP of 1561kg -1 -1 -1 -1 MS ha year and 1559kg MS ha year for options (ii) and (iii), with corresponding margin over feed cost of 2.541 M$ and 2.539 M$. This may be because land allocation to forage/crops changes completely, with chicory replacing the mixed pasture and maize being assigned a higher area of 94 ha in both options. The preference for chicory is because of its high ME content, and for maize because of its high DM yield. The superior economic achievements under these two management options, however, has a negative aspect as N-leaching shoots to -1 -1 34kg N ha year in both cases, with GHG emissions of 3772 tonnes CO2-e and 3771 tonnes CO2-e for options (ii) and (iii).
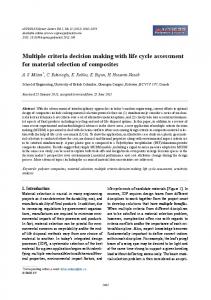
management options (ii) and (iii) are 2.107 M$ and 2.162 M$, with both surpassing even the MoFC of 2.0 M$ obtained in MSP_1320 case (the other farm objective of meeting the production target of 1320kg MS ha-1 year-1; Table 4). Therefore, both options (ii) and (iii), when considered in conjunction with the fixed Nleaching loss of 26kg N ha-1 year-1, meet the twin targets set by the farm management, one directly (N-leaching) and other indirectly (MSP, in terms of MoFC). Fig. 2 presents the land allocation to pasture or crops for management options (ii) and (iii) with N-leaching fixed at 26kg N ha-1 year-1 along with those for N_leaching_26 case. It is seen that with no constraints on the individual forage/crop area, the model allocates higher area to maize: 60ha in option (ii) and 104 ha in option (iii) compared to the constrained 21 ha in N_leaching_26 case. This appears to be the major reason behind the sharp reduction in purchased feed cost in options (ii) and (iii). PKE is the only feed purchased in all three cases (data not shown here), though its quantity varies from 148 tonnes in option (iii) to 777 tonnes in N_leaching_26 case.
To tackle this unwarranted situation, WGP model runs were repeated with N-leaching fixed at 26kg -1 -1 N ha year (similar to the N_leaching_26 case), and the results are presented in Table 6. It is seen that though the number of cows, MSP and GHG emissions are similar to N_leaching_26 model run (Table 4), exclusion of constraints on individual forage or crop area leads to sharp reduction in purchased feed cost and results in higher margin over feed cost. The MoFC for
4. DISCUSSION This study focused on formulation of MCDM models, incorporating NZ specific Tier 2 methodology, to tackle potentially conflicting multiple goals facing the dairy industry, and to analyze the management options that may lead to improved farm performance.
Table 5. Effect of the forage/crop production strategy on the selected attributes Attributes Total number of cows MSP (kg MS ha-1 year-1) -1 -1 N-leaching (kg N ha year ) MEP (MJ) MoFC (M$) Feed cost (NZ $) GHG emission (tonnes CO2-e) Land allocation (ha) Chicory Maize *
†
Option (ii) 788 1561 34 26046324 2.541 354142 3772
*
202 94
150 calving in autumn with no constraints on individual forage/crops 200 calving in autumn with no constraints on individual forage/crops
Option (iii) 788 1559 34 26009279 2.539 353556 3771 202 94
†
Singh et al.; BJAST, 5(1): xxx-xxx, 2015; Article no.BJAST.2015.002
Fig. 1. Effect of number of calving in autumn on (a) Total number of cow, (b) Milk solids production, (c) N-leaching, (d) Margin over feed cost, (e) GHG emissions and (f) Annual water use -1
-1
Table 6. Results of options (ii) and (iii) runs with N-leaching fixed at 26kg N ha year Attributes Total number of cows MSP (kg MS ha-1 year-1) N-leaching (kg N ha-1 year-1) MEP (MJ) MoFC (M$) Feed cost (NZ $) GHG emission (tonnes CO2-e)
*
Option (ii) 604 1195 26 19935479 2.107 109751 2928
*
Option (iii) 604 1193 26 19891454 2.162 51044 2919
†
-1
150 calving in autumn with no constraints on individual forage/crops + N_leaching target fixed at 26 kg N ha -1;† year 200 calving in autumn with no constraints on individual forage/crops + N_leaching target fixed at 26kg N -1 -1 ha year
Singh et al.; BJAST, 5(1): xxx-xxx, 2015; Article no.BJAST.2015.002
Fig. 2. Land allocated to pasture or crops for weighted goal programming model runs corresponding to management option (ii) with nitrogen leaching fixed at 26 kg N ha-1 year-1 -1 -1 (Option_ii_26), management option (iii) with nitrogen leaching fixed at 26 kg N ha year (Option_iii_26) and existing farm management practice with nitrogen leaching fixed at 26 kg N ha-1 year-1 (N_leaching_26) We chose two MCDM techniques: Compromise programming (CP), which defines the ‘best’ based on distance function, and weighted goal programming (WGP), which is based on the Simonian philosophy of ‘Satisfying’ [37]. Though CP is considered to be the best option amongst MCDM techniques [36,38], in our case, the compromise solution obtained by CP corresponding to metric L1, and WGP solution were exactly the same. Similar results were also reported by Val-Arreola et al. [6]. WGP model was particularly useful in analysing two specific targets set for the case study farm, i.e., -1 -1 production target of 1320kg MS ha year and -1 -1 N-leaching target of 26kg N ha year . The comparison of results obtained by WGP in N_leaching_26 case (Table 4) and LP in Min_N_leach case (Table 2) clearly established the advantage of WGP because in spite of slightly lower level of milksolids production, it brought considerable improvement in the margin over feed cost. Fleskens and de Graaff [8] also found WGP to be flexible and efficient in performing scenario analysis. WGP also has an added advantage as it offers the decision maker with the option of assigning different weights to goals reflecting the preferences of the stakeholder. In this study, however, all goals were assigned equal weight. Model validation is usually recommended to address the question whether the model produces realistic and reliable results. Since the
optimization methodology used here is based on empirical relationships included in Tier 2 methodology, we felt it necessary to validate the model outputs. We, therefore, used the OVERSEER nutrient budget model, as described in Section 2, to validate the N-leaching load component for two selected cases, thus bringing confidence in the estimations of ME requirement and GHG emissions (N-leaching estimation being an off-shoot of the N2O emission estimation, Section 2). There may still be uncertainties in the optimization outputs due to uncertainty in model inputs, however, evaluation of these could be possible only if algorithms that support multi-objective optimization under uncertainty are used [46]. We analyzed two management options dealing with the herd structure, in terms of number of cows calving in spring or autumn, and forage/crop production strategies. This is because in a recent review, Le Gal et al. [24] highlighted the complexity of dairy farm production systems as majority of reviewed literature focused on balancing the feed inputs (farm produced and purchased) with herd demand. The selection of these management options was also motivated by the fact that NZ dairy farmers are slowly adopting the new management practice of calving a small number of cows in the autumn (March – April) and taking interest in alternative forages and feeding strategies [14,41,42]. Our analysis for the case
Singh et al.; BJAST, 5(1): xxx-xxx, 2015; Article no.BJAST.2015.002
study farm showed that the number of cows calving in autumn should be within 150 – 200 for optimal adjustment between animals and feeds leading to maximum system output (Fig. 1).
We conclude that the application of MCDM techniques has a strong potential to support the decision-making processes in pasture-based dairy farms.
According to the solutions provided by the WGP model, chicory and maize were preferred under the most appropriate forage/crop production strategy (Table 5). These results are in agreement with earlier research promoting chicory as a prominent component of an alternative forage production strategy because of its high yield quality forage, micro nutrients content and deep tap root system that supports growth through dry conditions [28,42,47]; and maize because of its high DM yield and nitrogen use efficiency [43,48]. In our case, allocation of larger area to maize (Fig. 2) lowered the purchased feed cost and affected the margin over feed cost (Tables 4 and 6). The provision of higher land allocation to maize, however, needs further investigation as there are conflicting research findings regarding the effect of feeding maize on N-leaching and CH4 emissions. Maize has been reported to reduce urinary nitrogen and N-leaching loss [41,48,49,50,51], and reduce CH4 emission [50]. Conversely, maize has been reported to enhance N-leaching [13] and CH4 emission [41].
COMPETING INTERESTS
Although our results establish the utility of MCDM models in dairy farming system, we need to include cost of other inputs like fertilizer and labour for true representation of the profit margins. Similarly, models could be strengthened by incorporating crop growth functions, reflecting the effect of fertilizer and effluent application on pasture/crop growth. We also need to develop a user interface for ease of application of the model and its acceptance by the end-users.
5.
Authors have declared competing interest exits.
REFERENCES 1.
2.
3.
4.
6.
7.
5. CONCLUSION The MCDM models proved to be effective in analyzing the environmental and economic performance of a Waikato dairy farm that was selected for this study. The models supported the evaluation of the existing farm management practices and analyzed the efficacy of the management options. Optimal calving in autumn and planting large area under maize appeared to be the key to attaining twin objectives of maximum milk solids production and minimum Nleaching. Desirable modifications of the models include development of a user interface, inclusion of crop growth functions and consideration of cost of inputs other than feed.
that there are no
8.
9. 10.
LIC. Dairy Statistics 2010–2011, Livestock Improvement Corporation Limited, Hamilton, New Zealand; 2011. Available: http://www.lic.co.nz/pdf/DAIRYSTATISTIC S10-11-WEB.pdf. Di, HJ, Cameron, KC. Nitrate leaching in temperate agroecosystems: Sources, factors, and mitigating strategies. Nutrient Cycling in Agroecosystems. 2002;46:237– 256. MfE. Ministry for the Environment. New Zealand’s Greenhouse Gas Inventory 1990-2006 An Overview. ME 872, Wellington; 2008. Romero C, Rehman T. Multiple Criteria Analysis for Agricultural Decisions. Elsevier Science Publications, Amsterdam; 1989. Sarker RA, Quaddus MA. Modelling a nationwide crop planning problem using a multiple criteria decision making tool. Computers and Industrial Engineering. 2002;42:541-553. Val-Arreola, D, Kebreab, E and France, J. Modeling small-scale dairy farms in central Mexico using multi-criteria programming. J Dairy Sci. 2006;89:1662–1672. vanCalker KJ, Berensten PBM, Giesen GWJ, Huirne, RBM. Maximizing sustainability of Dutch dairy farming systems for different stakeholders: A modelling approach. Ecol. Econ. 2008;65:407-419. Fleskens L, De Graaff J. Conserving natural resources in olive orchards on sloping land: Alternative goal programming approaches towards effective design of cross-compliance and agri-environmental measures. Agric Syst. 2010;103:521–534. Babic Z, Peric T. Optimization of livestock feed blend by use of goal programming. Int. J. Prod. Econ. 2011;130:218-223. Huang IV, Keisler J, Linkov, I. Multi-criteria decision analysis in environmental sciences: Ten years of applications and
Singh et al.; BJAST, 5(1): xxx-xxx, 2015; Article no.BJAST.2015.002
11.
12.
13.
14.
15.
16.
17.
18.
19.
trends. Sci. Total Environ. 2011;409:35783594. Groot JCJ, Oomen GJM, Rossing, WAH. Multi-objective optimization and design of farming systems. Agric Syst. 2012;110:6377. Herrero M, Fawcett RH, Dent JB. Bioeconomic evaluation of dairy farm management scenarios using integrated simulation and multiple-criteria models. Agric Syst. 1999;62:169-188. Van De Ven, GWJ, Van Keulen H. A mathematical approach to comparing environmental and economic goals in dairy farming: Identifying strategic development options. Agric Syst. 2007;94:231–246. Beukes PC, Palliser CC, Macdonald KA, Lancster JAS, Levy G, Thorrold BS, Wastney ME. Evaluation of a whole-farm model for pasture-based dairy systems. J Dairy Sci. 2008;91:2353-2360. Bryant JR, Ogle G, Marshall PR, Glassey CB, Lancaster JAS, Garcia SC, Holmes CW. Description and evaluation of the Farmax Dairy Pro decision support model. NZ J. Agric. Res. 2010;53:13–28. Johnson IR, Chapman DF, Snow VO, Eckard, RJ, Parsons, AJ, Lambert, MG and Cullen, BR. DairyMod and EcoMod: Biophysical pastoral simulation models for Australia and New Zealand. Australian Journal of Experimental Agriculture. 2008;48:621–631. Macdonald KA, Penno JW, Beca D, Lancaster, JAS and Roche, JR. Evaluating the effectiveness of the UDDER simulation model as a decision support tool for farm management, in: Edwards GR, Bryant RH (Eds.), Meeting the Challenges for Pasture-based Dairying, Proceedings of the 4th Australasian Dairy Science Symposium; 2010. Anderson WJ, Ridler BJ. The effect of increasing per cow production and changing herd structure on economic and environmental outcomes within a farm system using optimal resource allocation, in: Edwards GR, Bryant RH (Eds.), Meeting the Challenges for Pasture-based Dairying, Proceedings of the 4th Australasian Dairy Science Symposium; 2010. McCall DG, Clark DA, Stachurski LJ, Penno JW, Byrant AM, Ridler BJ. Optimised dairy grazing systems in the Northeast United States and New Zealand.
20.
21.
22.
23.
24.
25.
26.
27.
28.
1. Model description and evaluation. J Dairy Sci. 1999;82:1795–1807. Ridler BJ, Anderson WJ, Fraser P. Milk, money, muck and metrics: Inefficient resource allocation by New Zealand dairy farmers. 2010 Conference, August 26-27, 2010, Nelson, New Zealand 96492, New Zealand Agricultural and Resource Economics Society; 2010. Ridler BJ, Rendel JM, Baker A. Driving innovation: Application of linear programming to improving farm systems. Proceedings of New Zealand Grasslands Association. 2001;63:295-298. Doole GJ, Romera AJ, Adler AA. A mathematical optimization model of a New Zealand dairy farm: The Integrated Dairy Enterprise Analysis (IDEA) Framework. Working paper in Economics 01/12, Department of Economics, University of Waikato, Hamilton, New Zealand; 2012. Pickering A. Detailed methodologies for agricultural greenhouse gas emission calculation. Technical Paper No. 2011/40, Ministry of Agriculture and Forestry, Wellington; 2011. Le Gal, PY, Dugue P, Faure G, Novak S. How does research address the design of innovative agricultural production systems at the farm level? A review. Agric Syst. 2001;104:714-728. Ledgard SF, Williams PH, Broom FD, Thorrold BS, Wheeler DM, Willis VJ. OVERSEERTM—a nutrient budgeting model for pastoral farming, wheat, potatoes, apples and kiwifruit, in: Currie LD, Hedley MJ, Horne DJ, Loganathan P (Eds.), Best Soil Management Practices for Production. Massey University, Palmerston North; 1999. Wheeler DM, Ledgard SF, Monaghan RM, McDowell RW, De Klein, CAM. OVERSEER nutrient budget model—what it is, what it does, in: Currie LD, Hanly JA (Eds.), Implementing Sustainable Nutrient Management Strategies in Agriculture. Massey University, Palmerston North; 2006. DairyNZ. Average Pasture Growth Data for New Zealand Dairy Farms. DairyNZ, Hamilton. 2012a. Accessed on 05 April 2012. Available:http://www.dairynz.co.nz/page/pa geid/2145866515/Pasture#427. DairyNZ. Farmfacts. DairyNZ, Hamilton. 2012b. Accessed on 05 April 2012. Available:
Singh et al.; BJAST, 5(1): xxx-xxx, 2015; Article no.BJAST.2015.002
29. 30.
31.
32. 33.
34.
35.
36.
37.
38.
39. 40.
http://www.dairynz.co.nz/page/pageid/2145 861419/Farmfacts. DairyNZ. Facts and Figures for New Zealand Dairy Farmers. DairyNZ, Hamilton; 2010. DairyNZ. DairyNZ Economic Survey 2010–11. 2012c. Dairy NZ, Hamilton. Accessed on 05 April 2012. Available: http://www.dairynz.co.nz/page/pageid/2145 871201/DairyNZ_Economic_Survey#719. Clark H, Brookes I, Walcroft A. Enteric methane emissions from New Zealand ruminants 1990–2001 calculated using an IPCC Tier 2 approach. Ministry of Agriculture and Forestry, Wellington; 2003. Freer M, Dove H, Nolan JV (Eds.). Nutrient Requirements of Domesticated Ruminants. CSIRO Publishing, Victoria; 2007. IPCC. Solomon S, Qin D, Manning M, Chen Z, Marquis M, Averyt KB, Tignor M, Miller HL (Eds.). Climate Change 2007: The Physical Science Basis. Contribution of Working Group I to the Fourth Assessment Report of the Intergovernmental Panel on Climate Change (IPCC). Cambridge University Press, New York; 2007. Ledgard SF, Penno JW, Sprosen MS. Nitrogen balances and losses on intensive dairy farms. Proceedings of New Zealand Grasslands Association. 1997;59:49-53. Thomas, SM, Ledgard, SF and Francis, GS. Improving estimates of nitrate leaching for quantifying New Zealand’s indirect nitrous oxide emissions. Nutrient Cycling in Agroecosystems. 2005;73:213–226. El-Gayar OF, Leung P. A multiple criteria decision making framework for regional aquaculture development. European Journal of Operational Research. 2001;133:462–482. Rehman T, Romero C. The application of the MCDM paradigm to the management of the agricultural systems: Some basic considerations. Agric Syst. 1993;41:239– 255. Piech B, Rehman T. Application of multiple criteria decision-making methods to farm planning: A case study. Agric Syst. 1993;41:305–319. Cohon J. Multiobjective Programming and Planning. Academic Press, New York; 1978. Tamiz M, Jones D, Romero C. Goal programming for decision making: An overview of the current state-of-the-art.
41.
42.
43.
44.
45.
46.
47.
48.
European Journal of Operational Research. 1998;111:569–581. Gregorini P, Beukes,PC, Bryant RH, Romera AJ. A brief overview and simulation of the effects of some feeding strategies on nitrogen excretion and enteric methane emission from grazing dairy cows, in: Edwards, GR and Bryant, RH (Eds.), Meeting the Challenges for Pasture-based Dairying, Proceedings of th the 4 Australasian Dairy Science Symposium; 2010. Jacobs JL, Woodward SL. Capturing the benefits of alternative forages for increased dairy farm profitability, in: Edwards, GR and Bryant, RH (Eds.), Meeting the Challenges for Pasture-based Dairying, Proceedings of the 4th Australasian Dairy Science Symposium; 2010. Kolver ES, Roche JR, Miller D, Densley R. Maize silage for dairy cows. Proceedings of New Zealand Grasslands Association. 2001;63:195-201. Del Prado A, Misselbrook T, Chadwick D, Hopkins A, Dewhurst, RJ, Davison, P, Butler A, Schroder J, Scholefield D. SIMS(DAIRY): A modelling framework to identify sustainable dairy farms in the UK. Framework description and test for organic systems and N fertilizer optimisation. Sci. Total Environ. 2011;409:3993–4009. Fonterra. Fonterra Sustainability Fact Sheet: Climate Change. Fonterra Cooperative Group Ltd., Auckland; 2009. Accessed on 02 April 2012. Available: http://www.fonterra.com//wps/wcm/connect /4c59510044921409b704f77cde4449c0/Fo nterra+Climate.pdf?MOD=AJPERES. Crespo O, Bergez J, Garcia F. Multiobjective optimization subject to uncertainty: Application to irrigation strategy management. Computers and Electronics in Agriculture. 2010;74:145– 154. Chapman DF, Kenny SN, Beca D, Johnson IR. Pasture and forage crop systems for non-irrigated dairy farms in southern Australia. 1. Physical production and economic performance. Agric Syst. 2008;97:108-125. Williams ID, Densley RJ, Edmeades GO, Kleinmans JJ, Mccarter SB. Using maize silage to reduce the impact of dairy farm systems on water use and quality in New Zealand: A review, in: Edwards GR, Bryant RH (Eds.), Meeting the Challenges
Singh et al.; BJAST, 5(1): xxx-xxx, 2015; Article no.BJAST.2015.002
49.
50.
for Pasture-based Dairying, Proceedings of th the 4 Australasian Dairy Science Symposium; 2010. Aarts HFM, Habbekotte B, Hilhorst GJ, Koskamp GJ, van der Schans FC, Vries CK. Efficient resource management in dairy farming on sandy soils. Netherlands Journal of Agricultural Science. 1999;47:153–167. Dijkstra J, France J, Ellis JL, Kebreab E, Lopez S, Rejis J, Bannink A. Effects of nutritional strategies on N and methane losses in dairy cattle, in: Sauvant D, van
51.
Milgen J, Faverdinand P, Friggens N (Eds.), Modelling Nutrient Digestion and Utilization in Farm Animals. Proceedings of the 7th international workshop MODNUT, Wageningen Academic Publishers, Wageningen; 2010. Ledgard SF. Nitrogen management – why is it important and what can we do about it? in: Chapman DF, Clark DA, Macmillan KL, Nation DP (Eds.), Meeting the Challenges for Pasture-based Dairying, Proceedings of the 3rd Dairy Science Symposium; 2006.
Singh et al.; BJAST, 5(1): xxx-xxx, 2015; Article no.BJAST.2015.002
APPENDIX-A The model involves five animal categories, represented by set i (i = 1 for cows calving in spring, i.e., July-August; i = 2 for cows calving in autumn, i.e., March-April; i = 3 for calves less than one-year old; i = 4 for calves, one to two year old; i = 5 for bulls). A monthly time step, represented by set j, is used (j = 1 for June; j = 2 for July; j = 3 for August; j = 4 for September; j = 5 for October; j = 6 for November; j = 7 for December; j = 8 for January; j = 9 for February; j = 10 for March; j = 11 for April; j = 12 for May). Set k represents the home-grown pasture/crop and purchased feed (k = 1 for mixed pasture; k = 2 for tall fescue; k = 3 for chicory; k = 4 for annual ryegrass; k = 5 for maize; k = 6 for turnip; k = 7 for meal concentrate; k = 8 for palm kernel extract (PKE); k = 9 for molasses; k = 10 for maize kibbled; with k = 1 to 6 representing home-grown pasture/crop and k = 7 to 10, purchased feed).
A.1 Objectives The following five objectives are considered. A.1.1 Maximization of Milksolids Production (Max_MSP) 2
12
∑∑ X
Max
ij
MSYi j
(A1)
i =1 j =1
Where Xi j is the number of cow i in month j, and MSYi j is the MS yield of cow i in month j, kg MS cow-1. A.1.2 Minimization of nitrogen leaching (Min_N_leach) 12
∑N
Min
Des
j =1
6 ∑ A jk k =1
(A2)
Where NDes is the desirable quantity of nitrogen that could leach, kg N ha-1 year-1, and Ajk is the area under pasture or crop, ha. A.1.3 Maximization of Metabolizable Energy for Milk PRODUCTION (Max_MEP) 2
12
∑∑ X
Max
ij
MEPi j
(A3)
i =1 j =1
Where MEPi j is ME required by cow i in month j for “Milk Production”, MJ. A.1.4 Maximization of Margin over Purchased Feed Cost (Max_MoFC) 10 2 ( X MSY P ) − (Y j k C j k ) ∑ ∑ i j MS ∑ i j j =1 i =1 k =7 12
Max
(A4)
Where PMS is the price of milksolids, NZ $ kg-1 MS, Yjk is the quantity of feed k in month j, kg, and Cjkis -1 the unit price of purchased feed kin month j, NZ $ kg . A.1.5 Minimization of Annual Water Use (Min_AWU) 2 2 5 X W + X W + X i j WFDM _ managei ( N day j ) ∑ ∑ ∑ ij drink i ∑ ij mp i j =1 i =1 i =1 i =1 12
Min
(A5)
Singh et al.; BJAST, 5(1): xxx-xxx, 2015; Article no.BJAST.2015.002
Where
Wdrink i is the water required by animal i for drinking, L day-1, Wmp is the water required for i
-1
milking procedure of animal i, L animal
-1
day ,
-1
WFDM _ manage i is the water required for faecal dry
-1
management (FDM) of animal i, L animal day , and N day j is the number of days in month j.
A.2 Constraints The above objectives are subject to the following constraints. A.2.1 ME requirement constraint 2
12
5
12
12 10
∑∑ X i j MEPi j + ∑∑ X i j MEOi j ≤ ∑∑ Y j k ME j k i =1 j =1
Where
i =1 j =1
(A6)
j =1 k =1
MEOij is the ME required by animal i in month j for “Other than milk production”, MJ, and
ME jk is the ME content of feed k in monthj, MJkg-1 DM (Dry Matter). The constraint states that the ME required by animals for milk production, maintenance, gestation, pregnancy, weight change and grazing must be met by the Diet. A.2.2 DM intake constraint 5
12
12
10
∑∑ X i j DMI i j ≤ ∑∑ Y j k i =1 j =1
(A7)
j =1 k =1
Where DMIijis the dry matter intake of animal i in month j, kg DM. The constraint ensures that DM intake requirement is met by the feeds selected by the model. A.2.3 Area constraints
Yj k
6
∑ DMY k =1
≤ Acultivable
for all j
(A8)
jk
Where DMYjkis the dry matter yield of the home-grown feed k in month j, kg DM ha-1, and Acultivableis the farm area available for cultivation, ha.
∑A
jk
≥190
jk
≤ 246
for all j
(A9)
k =1 4
∑A
for all j
(A10)
k =1
6
∑A
jk
≤ 50
for j = 5 to 10
≤ 21
for j = 5 to 10
k =5
∑A k =5
jk
(A11) (A12)
Singh et al.; BJAST, 5(1): xxx-xxx, 2015; Article no.BJAST.2015.002
Constraint (A8) states that the area available for home-grown feed is limited by the cultivable farm area, whereas (A9) ensures a minimum area of 190 ha under mixed pasture. Constraint (A10) limits the maximum area under perennial crops to 246 ha and ensures that the annual crops are indeed grown, whereas (A11) limits the maximum area under annual crops, and (A12) under maize. A.2.4 Budget constraint 12
10
∑∑ Y
jk
(A13)
C j k ≤ U cap
j =1 k = 7
Where Ucapis the maximum fund available for purchasing feed in a year, NZ $. The constraint ensures that the limit on the maximum fund available for purchasing feed holds good. A.2.5 Daily water use constraint 2 2 5 ∑ X i j Wdrinki + ∑ X i j Wmpi + ∑ X i j WFDM _ managei ≤ Wlim it _ daily i =1 i =1 i=1
for all j
(A14)
Where Wlimit_dailyis the maximum limit on the daily water use, L. The constraint states that the daily water limit restricts the daily water use. _________________________________________________________________________________ © 2015 Singh et al.; This is an Open Access article distributed under the terms of the Creative Commons Attribution License (http://creativecommons.org/licenses/by/4.0), which permits unrestricted use, distribution, and reproduction in any medium, provided the original work is properly cited.
Peer-review history: The peer review history for this paper can be accessed here: http://www.sciencedomain.org/review-history.php?iid=706&id=5&aid=6402