the population from which the sample was drawn; (2) a regression equation
which can be ... In order for the sample regression equation to represent the
population regression equation as ..... dissertation, University of North Carolina,
Chapel.
Multiple Regression and Validity Estimation in One Sample John G. Claudy American Institutes for Research
This study empirically investigated equations for estimating the value of the multiple correlation coefficient in the population underlying a sample and the value of the population validity coefficient of a sample regression equation. In addition to previously published estimation equations, several new
procedures, including an empirically derived equation, were evaluated using 16 independent populations. Overall, the empirical equation was superior to any of the previously published estimation procedures. It appears that cross-validation may longer be necessary for certain purposes.
no
applies multiple regression procedures to a set of data from a sample is genof three outcomes: (1) an estimate of the multiple correlation coefficient in erally seeking the population from which the sample was drawn; (2) a regression equation which can be used to predict the value of some dependent variable for members of the population for whom it is not currently available; or (3) an estimate of the validity or predictive effectiveness of the regression equation when it is applied to new cases from the population. In order for the sample regression equation to represent the population regression equation as closely as possible and for the estimate of the population multiple correlation to be as accurate as possible, the sample on which they are derived should be as large as possible; indeed, the entire available sample should be used. Use of all available cases, however, does not leave an independent sample for cross-validation to estimate the population validity or predictive effectiveness of the regression equation. Thus, it has not been possible to optimally determine all the desired outcomes of a multiple regression study. This problem has been discussed in more detail by Horst (1966) and Mosier (1951). Within the past several years, equations which permit the direct estimation of the population multiple correlation and the population validity have been advanced. However, their use has not been subjected to empirical test. If accurate and useful equations for estimating these parameters can be found, all three of the desired outcomes can be calculated on the entire available sample. This will be especially important in studies where the size of the available sample is small. This study thus had two major purposes: 1. To investigate empirically the accuracy and usefulness of equations for estimating the population multiple correlation. The researcher who
one or more
APPLIED PSYCHOLOGICAL MEASUREMENt Vol. 2, No. 4 Fall 1978 pp. 595-607 @ Copyright 1978 West Publishing Co.
595 Downloaded from the Digital Conservancy at the University of Minnesota, http://purl.umn.edu/93227. May be reproduced with no cost by students and faculty for academic use. Non-academic reproduction requires payment of royalties through the Copyright Clearance Center, http://www.copyright.com/
596 2.
investigate empirically the accuracy and usefulness of equations for predicting the population validity of a sample regression equation. To
Multiple Regression Models Multiple regression is a technique
which was developed within the context of experimental, data and involves assumptions which frequently are not met in rather than psychometric survey, those which involve the use of psychological tests. A basic asnonexperimental situations, especially that the values or levels of the independent variables are model is sumption of the multiple regression the fixed decided upon and by experimenter prior to conducting the experiment: They are set by and of the under the control experimenter and are thus not subject to measurement error. Only the dependent variable is free to vary from observation to observation; and if the usual sampling error formulas are to apply, its distribution must be normal. Thus, the dependent variable is the only variable subject to measurement error. This approach is termed the &dquo;regression,&dquo; or Fixed-X, model. This is generally not the situation found in psychometric research, where the values of the independent variables are typically the scores which a group of individuals receives on psychological tests of less than perfect reliability. Not only are the values of the independent variables not fixed by the researcher, they are subject to sampling errors as well as errors of measurement. The &dquo;regression,&dquo; or Fixed-X, model does not apply strictly to these conditions; and in its place been has proposed the &dquo;correlation,&dquo; or Random-X, model which allows the independent variables to vary freely. However, the Random-X model is so complex that usable computational procedures have not been developed for many of its aspects (Burket, 1964; Nicholson, 1948). It actually provides little more than a way to describe the situation and data, for even when the data are from a Random-X situation, Fixed-X regression procedures are ordinarily applied. Application of estimation procedures based on the Fixed-X model to Random-X data causes an over-fitting of the regression surface to the available data. The regression surface is fitted to the sample specific error variance as well as to the systematic trends of the population. This over-fitting, or error-fitting, results in the sample multiple correlation coefficient overestimating the actual population multiple correlation. or
Correction Procedures To correct for this overestimation of the population multiple correlation, several procedures have suggested. The first of these is generally termed &dquo;shrinkage&dquo; of the sample multiple correlation coefficient and was first proposed in a paper by Larson (1931) in which he attributed the shrinkage equation to B. B. Smith. This equation was modified by Wherry (1931) to yield what is now the most widely used equation for estimating the squared population multiple correlation, given a sample
been
multiple correlation coefficient:
where N =
sample size,
number of independent variables, r sample multiple correlation coefficient, and p population multiple correlation coefficient. However, this estimate, which involves the ratio of two unbiased estimates, is not an unbiased estimate of e2, nor is its square root an unbiased estimate of p (Darlington, 1968). It actually yields n
=
=
=
Downloaded from the Digital Conservancy at the University of Minnesota, http://purl.umn.edu/93227. May be reproduced with no cost by students and faculty for academic use. Non-academic reproduction requires payment of royalties through the Copyright Clearance Center, http://www.copyright.com/
597 underestimates of both of these values. (Throughout this paper the for a parameter will denote an estimate of that parameter.) Olkin and Pratt (1958) have
use
of a caret
[’] over the symbol
published an unbiased estimate of e2,
requires the expansion of the hypergeometric function. Pratt (1964) provided an approximation Equation 2, which is based on the first two terms of the expanded hypergeometric series and a par-
which to
tial correction for the omitted later terms:
Herzberg (1969) has also given an approximation to Equation 2:
3 and 4 differ only in the value of the divisor in the rightmost term. Herzberg, after expansion of the hypergeometric function, merely dropped all terms after the second, while Pratt adjusted the value in the second term to compensate in part for the effects of the terms which were dropped. The Pratt correction has the effect of minimizing asymptotically the maximum error caused by omission of the later terms (Pratt, 1969). Thus the Pratt approximation should yield an estimate of Q2 with less bias than that of the Herzberg approximation. While Equations 3 and 4 provide almost-unbiased estimates of e2, their square roots are not unbiased estimates of Q; rather, they are underestimates of that value, the square root of the Herzberg estimate being slightly larger than that of the Pratt estimate.
Equations
carrying out the
Cross-Validation A second problem arising from the application of Fixed-X procedures to Random-X data is the the sample beta weights differ at least randomly from the population beta weights. If the that fact beta weights from a single sample could be applied to the entire population, the resulting population aggregate correlation would be lower than the population multiple correlation. This population aggregate correlation would be the population validity coefficient of the predictor set. The method in common use for estimating this aggregate correlation is termed cross-validation. The beta weights derived on one sample are applied to observations of the predictor variables in a second independent sample from the same population to obtain a predicted dependent variable value for each criterion observation in the second sample. The Pearson product-moment correlation between the predicted and actual dependent variable values in the second sample is calculated, and this aggregate correlation is termed the cross-validity coefficient. Following Herzberg (1969), the symbol r~ shall be assigned to the sample cross-validity coefficient. The corresponding population validity coefficient is given the symbol Q.. Mosier (1951) suggested an extension of cross-validation, which he termed double cross-validation. A given sample is split into two independent subsamples, and beta weights are derived in both subsamples. The beta weights from each subsample are applied to the other subsample to yield two aggregate correlations or subsample cross-validities. The average of these two independently calculated Downloaded from the Digital Conservancy at the University of Minnesota, http://purl.umn.edu/93227. May be reproduced with no cost by students and faculty for academic use. Non-academic reproduction requires payment of royalties through the Copyright Clearance Center, http://www.copyright.com/
598 cross-validities is used as an estimate of the population validity of a regression equation the total sample. For many years, little distinction was made between estimates of the population multiple correlation obtained by shrinkage of a sample multiple correlation coefficient, 6. and estimates of the aggregate correlation, 6,, obtained by cross-validation (Guilford, 1965; Guion, 1965). The implication was that they were basically equivalent, differing only in how they were obtained. This is not the case. On the average, both values are smaller than the population multiple correlation; and the population validity coefficient is smaller than the estimated population multiple correlation. When considering a single population, especially where sample sizes are fairly small, the following inequality is found to hold:
subsample based
on
cross-validity coefficient, r~, is an estimate of the validity or predictive effectiveness of a regression equation derived in one sample of a given size when it is applied to a second independent sample. As with the sample multiple correlation coefficient, the sample cross-validity coefficient itself is of little interest. What is desirable to estimate is the population validity coefficient, Q., that is, the predictive effectiveness of a sample regression equation when it is applied to the entire population from which the sample was drawn or, in the applied situation, when it is applied to new data not initially available. Since in actual practice the entire population of interest is not available, Q, can never be directly calculated. Instead, some way to estimate this value must be found. Herzberg (1969) provides two equations for doing this. The first is based on the work of Lord (1950) and Nicholson (1948) and applies to the &dquo;regression,&dquo; or Fixed-X, model: The
The second is due to
Darlington (1968) and is for the &dquo;correlation,&dquo; or Random-X, model:
Burket (1964) also provides weight validity, can be estimated:
an
equation by
which the
population validity,
which he calls the
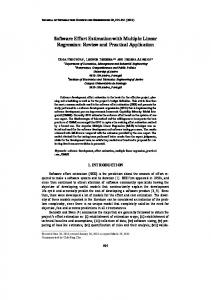
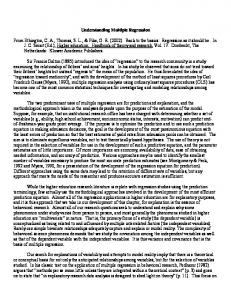
it is of interest that this last equation provides a direct estimate of the population validity rather than its square, it was derived within the context of Fixed-X regression theory and thus may not be suitable when applied to Random-X data. During the early part of this study, a provocative finding was revealed by the empirical data. The curves of sample multiple correlations and sample cross-validities, when plotted against sample size, were approximately symmetric about the value of the population multiple correlation-at least for values of the population multiple correlation equal to or greater than .25 for samples of a minimum of 20 or, in general, for population multiple correlations and sample sizes large enough for the inequality r - Q < Q to remain true, so that symmetry will not imply a near-zero or negative cross-
Although
validity. (For an example of this symmetry, see Figure 1.) Downloaded from the Digital Conservancy at the University of Minnesota, http://purl.umn.edu/93227. May be reproduced with no cost by students and faculty for academic use. Non-academic reproduction requires payment of royalties through the Copyright Clearance Center, http://www.copyright.com/
FIGURE 1 MEAN VALUES OF SAMPLE MULTIPLE CORRELATION COEFFICIENTS, SAMPLE CROSS-VALIDITY COEFFICIENTS, AND POPULATION VALIDITY COEFFICIENTS FOR SAMPLES OF DIFFERENT SIZES
Downloaded from the Digital Conservancy at the University of Minnesota, http://purl.umn.edu/93227. May be reproduced with no cost by students and faculty for academic use. Non-academic reproduction requires payment of royalties through the Copyright Clearance Center, http://www.copyright.com/
600 This finding suggested another approach for estimating the population multiple correlation based on the Mosier double cross-validation procedure. If the symmetric relationship holds across most populations, the mean subsample multiple correlation should be as far above the population multiple correlation as the mean subsample cross-validity is below it; thus,
The population multiple correlation is estimated by the mean of two subsample multiple correlations and two subsample cross-validities. Preliminary empirical work also indicated that mean sample cross-validities and mean population validities are essentially equal when the regression equations on which they are based are derived on samples of the same size. (See Figure 1, for example.) This finding is in agreement with Herzberg (1969) and, when considered together with the finding of symmetry described above, suggested a new approach for the estimation of the population validity. If an accurate estimate of the population multiple correlation could be found, then the population validity should be twice as far below the sample multiple correlation as is the population multiple correlation. Thus,
This equation applies to any estimate of the population multiple correlation (~) and is here termed a double shrinkage estimate. However, in the case in which 6 is found by Equation 9, Q, is calculated as
The accuracy of these methods for estimating the population multiple correlation and the population validity were also investigated as part of this study. Method Data
Only small sample sizes were used. The reasons for this limitation were twofold: (1) many current studies, especially applied studies, which make use of multiple regression procedures have used only small sample sizes; and (2) the errors in the results of multiple regression procedures are greatest with small sample sizes, suggesting that there is more room for improvement here. Rather than using real data, the decision was made to use computer-generated populations of data and to draw samples from these populations. Thus, the characteristics of the populations could be varied widely and the generality of the findings could be estimated. Data generation. A Fortran IV program was written to generate the data. Input to this program consisted of (1) the size of the population; (2) the total number of variables; (3) the number of common factors for these variables; (4) the desired simple structure factor matrix, including unique loadings, for the generated variables; and (5) a randomly chosen number used to initialize a pseudo-random number generator. The inputted simple structure factor matrix allowed both the factor structure of each variable and the intercorrelation matrix among the variables to be determined prior to the generation of the data. In this way the generated populations could be made to correspond to the sorts of populations found in real data. Factor analyses of variables generated in this Downloaded from the Digital Conservancy at the University of Minnesota, http://purl.umn.edu/93227. May be reproduced with no cost by students and faculty for academic use. Non-academic reproduction requires payment of royalties through the Copyright Clearance Center, http://www.copyright.com/
601
indicated that their factor patterns corresponded very closely to those of the inputted factor and regression analyses indicated that the variables were linearly related. After genmatrices, pattern eration, the entire population was stored in a random access disk file of the computer. Populations. Sixteen independent multivariate normal populations of 500 sets of observations each were generated for use in this study. The selection of a population size of 500 was a compromise between a desire to have the populations as large as possible, a desire to use as many populations as possible within the budget limits of the project, and the space and time limitations imposed by the computer. The parameters of the populations were chosen to represent the statistics of samples of real data, as reported in the psychological and educational literature. Thus the populations differed manner
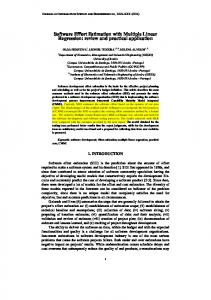
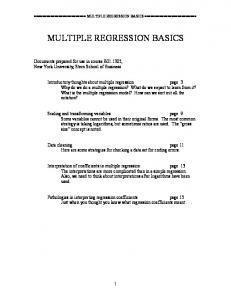
in their intercorrelations, factor structures, and numbers of variables. However, in no case did the number of independent variables exceed five. Table 1 presents summary data for each of the 16 populations. Samples. From each population a total of 400 samples were drawn-100 each of the following sizes: 20, 40, 80, and 160. The sets of observations to be included in each sample were selected by the use of a random number generator which generated a number between 1 and 500, inclusive. A sample of size N consisted of the first N random numbers generated, a different set of N numbers being generated for each sample. Due to the limited population size, these samples were drawn with replacement.
Using this procedure, the finite population of 500 observations is equivalent to an infinite population in which the same series of 500 observations is repeated an infinite number of times. Thus, the parameters of the population of 500 are the same as those of the infinite population it represents, and ’
Summary Descriptive
Table 1 Statistics for the Sixteen
Study Populations
Downloaded from the Digital Conservancy at the University of Minnesota, http://purl.umn.edu/93227. May be reproduced with no cost by students and faculty for academic use. Non-academic reproduction requires payment of royalties through the Copyright Clearance Center, http://www.copyright.com/
602
the sampling is approximately equivalent to what it would have been had the sample been drawn without replacement from an infinite population having the same parameters. It should be noted, however, that this implies that each observed score is the true score for that individual on that variable. In other words, this study concerns the effects of different sample sizes only and does not consider the effects of unreliability.
Dependent Variables The following statistics were calculated on each sample: 1. The multiple correlation in the complete sample. 2. Two multiple correlations based on half-samples. 3. Two half-sample cross-validity coefficients. 4. The population validity based on complete sample beta weights. The population multiple correlation for each population was also obtained. With these initial results available, Equations 1, 3, 4, 6, 7, 8, 9, and 11 as well as three versions of Equation 10, which made use of the results from Equations 1, 3, and 4, were calculated. These calculations may be summarized as follows: Estimates of the population multiple correlation: 1. Square root of the Wherry estimate of e2 (Equation 1). 2. Square root of the Pratt approximation to the Olkin-Pratt estimate of e2 (Equation 3). 3. Square root of the Herzberg approximation to the Olkin-Pratt estimate of e2 (Equation 4). 4. Double cross-validity estimate of Q (Equation 9). Estimates of the population validity: 1. Square root of the Lord-Nicholson estimate of ee2 (Equation 6). 2. Square root of Darlington estimate of ee (Equation 7). 3. Burket estimate of Q, (Equation 8). 4. Double shrinkage’ of the double-cross validity estimate of e (Equation 11). 5. Double shrinkage of the square root of the Wherry estimate of e2 (Equations 1 and 10). 6. Double shrinkage of the square root of the Pratt approximation to the Olkin-Pratt estimate of e2 (Equations 3 and 10). 7. Double shrinkage of the square root of the Herzberg approximation to the Olkin-Pratt estimate of e2 (Equations 4 and 10). These estimates were calculated for all samples from each population and constituted the data for this study. In those few cases in which the estimate of ez was negative, 6 was set equal to zero. Results and Discussion Estimates of the Population Multiple Correlation For each of the 16 populations, the 4 estimates of e were calculated for each sample, a total of 1600 estimates per equation for each sample size. The mean square error of Q - 6 was obtained for each estimation equation for each sample size. These MSE values are presented in Table 2, columns 2 through 5.
’Note
again that &dquo;double shrinkage&dquo; means estimation of Q, as being twice as far below r as is Q (Formula 10). Downloaded from the Digital Conservancy at the University of Minnesota, http://purl.umn.edu/93227. May be reproduced with no cost by students and faculty for academic use. Non-academic reproduction requires payment of royalties through the Copyright Clearance Center, http://www.copyright.com/
603 Table 2 Mean
Square Error in the Estimation of the Population Multiple Correlation (p)
Note.
Each entry based
on
For all four of the estimation
100
samples from each of the 16 populations.
equations
for the
population multiple
correlation
(Q)
discussed
above, the accuracy of the estimation increased with increasing sample size. For each sample size, the double cross-validity estimate was the most accurate of the four, as indicated by its smaller mean square error. However, an important point should be considered prior to making a recommendation as to which estimation equation should be used. The Wherry, Pratt, and Herzberg estimates require only the calculation of a single sample multiple correlation coefficient, while the double cross-validity estimate
requires the calculation of two half-sample multiple correlation coefficients and two halfsample cross-validity coefficients. Is the extra accuracy worth the extra time and effort? As part of an attempt to provide an answer to this question, an effort was undertaken to develop an empirical-estimation equation for the population multiple correlation. It was desired that this empirical equation have two primary properties: (1) it should be as accurate as the double cross-validity estimate, and (2) it should be computationally less complex than the double cross-validity estimate. It had been anticipated that the Pratt equation (Equation 3) would be the most accurate of the estimation procedures investigated, since this equation attempts to correct for the omitted terms. However, examination of results of the application of the several estimation equations revealed that the Herzberg equation (Equation 4) was the most accurate and that it tended to yield an underestimate of the population multiple correlation. Accordingly, it was hypothesized that if the Herzberg estimation equation could be empirically modified to result in a slightly larger value, it might thus yield a more accurate estimate of Q.
During a process of successive trial empirical modifications and evaluations, some 12 different empirical equations were investigated. The empirical estimation equation finally arrived at was
Comparison of this equation with Equation 4 reveals that they differ only in the second term on the right. Here the value N-4 has been substituted for N-3. Table 2 contains a comparison of the MSE results obtained using Equation 12 with those of the other estimation equations. At all sample sizes except the smallest, Equation 12 yielded a MSE equal in size to that of the double cross-validity estimate, the best of the other four. While for the smallest sample size (N 20) the mean square error of estimation was greater for Equation 12 than for the double cross-validity equation, it was still less than that for the Wherry, Pratt, or Herzberg equations. The reason for the =
Downloaded from the Digital Conservancy at the University of Minnesota, http://purl.umn.edu/93227. May be reproduced with no cost by students and faculty for academic use. Non-academic reproduction requires payment of royalties through the Copyright Clearance Center, http://www.copyright.com/
604
superiority
of
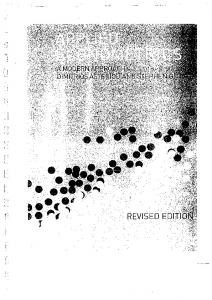
Equation 12 is revealed in Table 3, which reports mean values for the difference bepopulation multiple correlation and the estimated population multiple correlation, Q
tween the actual
-6. Both the Herzberg and double cross-validity estimates tended to underestimate the true populamultiple correlation, while the empirical estimate tended to overestimate the value. However, the empirical estimate tended to be less biased than either of the other two estimates. This smaller degree of bias, when considered along with the smaller MSE value, leads to the suggestion that the researcher who has a sample of at least moderate size can best estimate the population multiple correlation by use of Equation 12. No theoretical or mathematical rationale is offered for this new estimation equation. In fact, the author has not been able to develop such rationale. Its only justification is that it does seem to work and that it is not greatly different from other theoretical procedures. It is an empirically derived estimate supported by empirical data. A further fact revealed by the double cross-validity estimate is that sample multiple correlation coefficients and sample cross-validity coefficients are not perfectly symmetrical about the population multiple correlation. However, the available data do seem to indicate that as sample size increases, the departure from symmetry decreases. This closeness to symmetry seems sufficient to make this finding important.
tion
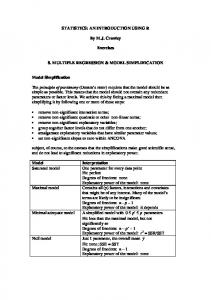
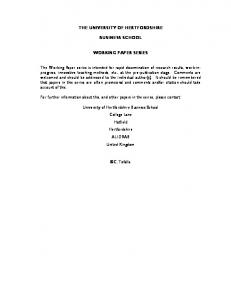
Estimation of Population Validity A total of 7 population validity estimation equations were investigated, each being applied to all samples from the 16 populations. A comparison of mean square errors in the estimation of the population validity for these 7 equations is reported in Table 4. Considering only the 7 estimation equations for the population validity shown in columns 2 through 8, at the smallest sample size the Darlington estimation equation yielded the most accurate estimate of Qc; but at all other sample sizes the double cross-validity estimate, Equation 11, was as good as or better than any other procedure. This latter method is termed double shrinkage of the double cross-validity estimate. Since multiple regression is ordinarily not carried out using very small sample sizes, these results would lead to a recommendation to use either the Darlington equation or double shrinkage of the
400
Table 3 Mean Value of
Minus
Population Multiple Correlation Estimated Population Multiple Correlation
Each entry based of the 16 populations.
Note.
on
100 samples from each
Downloaded from the Digital Conservancy at the University of Minnesota, http://purl.umn.edu/93227. May be reproduced with no cost by students and faculty for academic use. Non-academic reproduction requires payment of royalties through the Copyright Clearance Center, http://www.copyright.com/
N
~ 4J m 4-1
0
0
0 . 4.J
r.
c
0
~--i
’~
=! P. 0 p...
u
4-J
Cù 0-
E~’
’rl
41
>-.
UIP
1 ~4 4-1
r. a)
x U
m W
v 4-1
0
z
Downloaded from the Digital Conservancy at the University of Minnesota, http://purl.umn.edu/93227. May be reproduced with no cost by students and faculty for academic use. Non-academic reproduction requires payment of royalties through the Copyright Clearance Center, http://www.copyright.com/
606 double
cross-validity as the estimate of Q,. However, in the first phase of this study it was found that empirically derived equation (Equation 12) yielded an even better estimate of Q than did the double cross-validity procedure. Therefore, a further analysis was carried out in which Equation 10 was applied to the results of Equation 12. These results were compared with the results of the other 7 estimation equations. This comparison is presented in column 9 of Table 4. At all sample sizes, double shrinkage of the empirical estimate was equal or superior to any of the other estimates. Thus, of the 8 equations for predicting the population validity, double shrinkage of the empirical estimate was generally the most accurate. This finding that double shrinkage of the empirical estimate was the most accurate estimation procedure for the population validity (pe) is particularly important because it provides independent support for the use of the empirical estimation equation (Equation 12) for the estimation of the population multiple correlation (e).
an
Conclusions 1. 2.
3. 4. 5.
their theoretical inapplicability, Fixed-X regression procedures are the only ones available for estimating regression coefficients from Random-X data. The estimate of the population multiple correlation, Q, given by Equation 12, is more accurate than any previously available estimate. So long as r - Q < e, the best available estimate of the population validity is êc = 2 e - r. A regression equation should be based on the entire available sample. In light of these data, it appears that cross-validation is no longer needed to estimate the validity of a regression equation in the population which underlies the validation sample. It will still be needed, however, to assess validity generalization to other populations (e.g., the validity of a regression equation of grade-point averages on test scores developed at one university for use at other universities).
Despite
References Burket, G. R. A study of reduced rank models for
multiple prediction. Psychometric Monograph No. 12, 1964.
Darlington, R. B. Multiple regression in psychological research and practice. Psychological Bulletin, 1968, , 161-182. 69 Guilford, J. P. Fundamental statistics in psychology and education (4th ed.). New York: McGraw-Hill, 1965.
Guion, R. M. Personnel testing. New York: McGrawHill, 1965. Herzberg, P. A. The parameters of cross-validation. Psychometric Monograph No. 16, 1969. Horst, P. Psychological measurement and prediction. Belmont, CA: Wadsworth and Company, 1966. Larson, S. C. The shrinkage of the multiple correlation coefficient. Journal of Educational Psychol, 45-55. 22 ogy, 1931, Lord, F. M. Efficiency of prediction when a regression
equation
from
one
sample
is used in
a new
sample. (Research Bulletin No. 50-40) Princeton, NJ: Educational Testing Service, 1950. Mosier, C. I. Problems and designs of cross-validation. Educational and Psychological Measurement, 1951, , 1-11. 11 Nicholson, G. E., Jr. The application of a regression
equation
to a new
sample. Unpublished
doctoral
dissertation, University of North Carolina, Chapel Hill, 1948. Olkin, I., & Pratt, J. W. Unbiased estimation of certain correlation coefficients. Annals of Mathematical Statistics, 1958, , 201-211. 29 Pratt, J. W. Personal communication to E. E. Cureton, October 20, 1964. Pratt, J. W. Personal communication to J. G. Claudy,
May 12, 1969. Wherry, R. J. A
new formula for predicting the of the coefficient of multiple correlation. Annals of Mathematical Statistics. 1931, 2, 446-A57.
shrinkage
Downloaded from the Digital Conservancy at the University of Minnesota, http://purl.umn.edu/93227. May be reproduced with no cost by students and faculty for academic use. Non-academic reproduction requires payment of royalties through the Copyright Clearance Center, http://www.copyright.com/
607
Acknowledgements The computer costs associated with this study were in part supported by Grant No. NAS8-11189 from the National Aeronautics and Space Administration to the University of Tennessee, Knoxville, Computer Center. The author thanks Edward E. Cureton for his help and guidance throughout the study and William
V. Clemans, A. Oscar H. Roberts, and William M. Shanner for their comments and suggestions on earlier drafts of the manuscript.
Author’s Address John G. Claudy, American Institutes for Research, Post Office Box 1113, Palo Alto, CA 94302.
Downloaded from the Digital Conservancy at the University of Minnesota, http://purl.umn.edu/93227. May be reproduced with no cost by students and faculty for academic use. Non-academic reproduction requires payment of royalties through the Copyright Clearance Center, http://www.copyright.com/