Keywords - Fuzzy systems; time series analysis and forecasting; wave- let-based ... been widely used for decomposing time serial data. Wavelets are.
Multiscale Wavelet Preprocessing for Fuzzy Systems Ademola Popoola, Saif Ahmad, and Khurshid Ahmad Department of Computing, School of Electronics and Physical Sciences, University of Surrey, Guildford GU2 7XH, UK {a.popoola, s.ahmad, k.ahmad}@surrey.ac.uk
Abstract— Fuzzy systems, referred to as universal approximators, have been used to model real-world data. In this paper, we examine the prediction performance of fuzzy subtractive clustering models on time series with trends, seasonalities, and discontinuities. Our results indicate that wavelet preprocessing improves forecast accuracy for time series that exhibit variance changes and other complex local behavior. Conversely, for time series that exhibit no significant structural breaks or variance changes, fuzzy models trained on raw data perform better than hybrid fuzzy-wavelet models. Further work is required to investigate the use of wavelet variance profile of time series to determine the suitability of the application of waveletbased preprocessing on prediction models. Keywords - Fuzzy systems; time series analysis and forecasting; wavelet-based approaches.
I. INTRODUCTION Measured time series are used to characterize the time course of the behavior of a wide variety of physical and biological systems. Increasingly, so-called ‘model free’ soft computing techniques such as neural networks, fuzzy systems, genetic algorithms and hybrids, have been used to successfully model complex underlying relationships in nonlinear time series. Such techniques, referred to as universal approximators [1], [2] are theoretically capable of uniformly approximating any real continuous function on a compact set to any degree of accuracy. However, there has been considerable research, and debate, on the presumed ability of such ‘monolithic global models’ [3] to directly model real-world time series, which are often characterized by complex local behavior – mean and variance changes, seasonality and other features [4], [5]. Moreover, it has been asserted that most real-world processes, especially in financial markets, are made up of complex combinations of sub-processes, which operate at different frequencies or timescales [6]. To successfully characterize such systems, there is a need to disentangle the different sub-processes, or components. Consequently, various strategies have been used for modeling or filtering so-called components of time series. In particular, wavelet analysis has been widely used for decomposing time serial data. Wavelets are robust parameter-free tools [7] that ‘cut’ up data into different
frequency components, and study each component with a resolution matched to its scale [8], [9]. Wavelets are able to capture events that are local in time, and identify the deterministic dynamics of complex processes [6] without knowledge of the underlying generation phenomena. Ramsey suggests that adopting a wavelet-based approach ‘formalizes’ the notions of decomposing time series into its various components [10]. In addition, Gençay et al. have demonstrated that wavelets can separate intraday seasonal components of high frequency, non-stationary time series, leaving the underlying non-seasonal structure intact [7]. Wavelets have been used to preprocess time series prior to the application of suitable prediction techniques: for ‘filtering’ data before the application of a neural network [11] and multiresolution autoregressive (MAR) model [12]. In this paper, we briefly describe simulations that indicate that, whilst wavelet-based processing is generally beneficial, fuzzy models built from wavelet-processed data may under perform compared to models trained on raw data. In particular, we suggest that the variance structure of the time series under analysis may affect the suitability of wavelet-based preprocessing. The remainder of this paper is organized as follows. In Section II, a review of wavelets is presented. This is followed, in Section III, by a description of the proposed fuzzy-wavelet scheme. In Section IV, experimental results are presented and discussed. The conclusions of the paper are reported in Section V. II. WAVELET-BASED PREPROCESSING In wavelet formalism, a suitably chosen mother wavelet function ψ can be used to expand a function X as: ∞
X (t ) = ∑
∞
j/2 j ∑ w j , k 2 ψ (2 t − k ) ,
j = −∞ k = −∞
(1)
where the functions ψ (2 jt - k) are all orthogonal to one another, and wj,k provides information about the behavior of function X, focusing on effects of scale around 2-j, close to time k X 2-j [3]. This is the discrete wavelet transform (DWT). However, the DWT can only be applied to a time series {Xt: t = 1,…,N}, where Ν is the number of resoluN is an integer multiple of 2j, and j∈Ν tion levels. Moreover, the DWT lacks shift or translation invari-
ance - it is sensitive to the choice of origin of the series, and circularly shifting a time series will not necessarily shift its DWT coefficients in a similar manner. These problems are addressed by means of a variant of the DWT, the redundant non-orthogonal transform called the maximal overlap discrete wavelet transform (MODWT) [13]. The jth ~ ~ level MODWT wavelet ( W j ) and scaling ( V j ) coefficients of a time series X with arbitrary sample size N, are defined as, L j −1 ~ ~ W j ,t ≡ ∑ h j ,l X t − l mod N l =0
(2) L j −1 ~ V j ,t ≡ ∑ g~ j ,l X t − l mod N l =0
~ where h j ,l ≡ h j ,l / 2 j / 2 are the MODWT wavelet filters, and g~ j ,l ≡ g j ,l / 2 j / 2 are the scaling filters [13]. The MODWT yields an additive decomposition or MRA given by, J0 ~ ~ X = ∑ D j + S J0
(3)
j =1
where N −1 ~ ~ ~ D j ,t = ∑ h jo,lW j ,t + l mod N
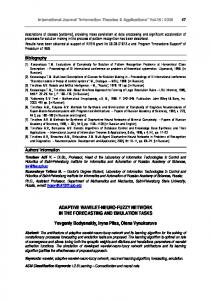
III. HYBRID FUZZY-WAVELET SCHEME FOR TIME SERIES PREDICTION Given the time series {Xt: t = 1,…,N}, our aim is to predict the lth sample ahead, X(N+l), of the series. For single step prediction, l = 1. This scheme basically involves three stages. In the first stage, the time series is decomposed into different scales using the MODWT. In the second stage, each scale is predicted by a separate fuzzy model and in the third stage the individual predictions at each scale are combined to generate an aggregate forecast. The time-based à trous filtering scheme presented in section II is used to pre-process the data prior to the application of a fuzzy model for time series prediction. Fig. 1 shows the proposed hybrid fuzzy-wavelet scheme for time series prediction. The fuzzy model used in our study is the subtractive clustering method, proposed in [15]. This method does not need a prespecified number of clusters and their initial location, unlike fuzzy c-means (FCM) data clustering technique. We have used a cluster radius of 0.5, following [15], to build first-order TakagiSugeno-Kang (TSK) models from training data, without iterative optimization. Time lags between 1 and 20 were tested on the validation set, and the lags with minimum error were used on the test set to obtain single-step forecasts. IV. ANALYSES AND RESULTS
l =0
(4) N −1 ~ ~ S j ,t = ∑ g~ oj ,lV j , t + l mod N l =0
The set of coefficients {Dj} in (4) are called wavelet “details” and they capture local fluctuations over the whole period of a time series at each scale; and the set of values Sj provide a “smooth” or overall “trend” of the original signal. The additive form of reconstruction in (3) allows us to predict each wavelet sub-series separately and add the individual predictions to generate an aggregate forecast. Since our intention is to make one-step-ahead predictions, we should perform the MODWT in such a way that the wavelet coefficients (for each level) at time point t should not be influenced by the behavior of the time series beyond point t. To accomplish this, we make use of the time-based à trous filtering scheme proposed in [14]. Given time series {Xt: t = 1,…,n}, where n is the present time point, we perform the steps detailed below, following [3]: 1) For index k sufficiently large (we use k=10), carry out the transforms (5), on {Xt: t = 1,…,n}. 2) For j resolution levels, retain D1(k), D2(k), …, Dj(k), Sj(k), for the kth time point only. 3) If k < n, set k = k+1 and go to Step 1. The summation of the values D1(k), D2(k), …, Dj(k), Sj(k) gives X(k), as indicated in (4).
The data set used in our analyses comprises ten monthly time series used in [5] and by other researchers. These are five US Census Bureau (USCB) retail sales data, one USCB housing start data, and four industrial production series from the Federal Reserve Board (FRB). Monthly series are used since they exhibit stronger seasonal patterns than quarterly series. These series are characterized, in varying degrees, by trend and seasonal patterns, as well as discontinuities [5].
Fig. 1. Schematic representation of the wavelet/fuzzy forecasting system. D1, …D5 are wavelet coefficients, S5 is the signal “smooth”.
Following [5], validation data comprises the last 12 months of in-sample data, while the remaining data are used for model training. Out-of-sample test data consists of the last 12 months’ data of each data set. Given a test set of length n, single-step predictions, Pi, are evaluated against the target (original) series, Ti, using the mean absolute percentage error (MAPE), EMAPE statistic:
E MAPE =
100 n ∑ (Ti − Pi ) / Ti n i =1
(5)
The MAPE statistic is used in preference to the commonly used root mean square error (RMSE) statistic because MAPE is insensitive to the scale of a time series. The condition for the use of the MAPE – data must be strictly positive – is met in all time series studied. To exclude the possibility that the fuzzy model inherently produces inferior forecast results, we compare results obtained on raw data with results obtained in [5] using artificial neural networks (ANN), ARIMA models. We observe that, generally, results obtained for the fuzzy model are comparable to those obtained for the ANN and ARIMA models (Table I). In order to evaluate the performance of fuzzy models on wavelet processed time series, each of the ten time series was decomposed into five wavelet resolution levels using the à trous filtering scheme discussed in section II. The fuzzy system was trained separately on each wavelet sub-series (resolution) to generate one-step-ahead forecasts. The results for the ten data sets are presented in Table II. Our results indicate that, in seven out of ten cases, the fuzzywavelet hybrid approach performed better than fuzzy models trained on raw data. Details of the percentage reduction in MAPE are presented in Table II. Notice that for USCB clothing, department, and furniture (items 6-8 in Table II), the performance of the fuzzy-wavelet model is inferior to that of the fuzzy-raw model. Why is it that, for these three series, fuzzy models appear to have worse fit to test data if the series are preprocessed?
TABLE II COMPARISON OF MAPE ON RAW AND WAVELET PROCESSED DATA USING FUZZY CLUSTERING MODEL Analysis Method #
Data Sets
1 2 3 4 5 6 7 8 9 10
FRB Durable Goods FRB Consumer goods FRB Total production FRB Fuels USCB Book Store USCB Clothing USCB Department USCB Furniture USCB Hardware USCB Housing Start
FuzzyRaw 2.37 2.26 1.94 1.89 8.43 4.26 2.45 3.88 5.05 6.14
FuzzyWavelet 1.70 1.04 1.06 1.02 6.92 8.94 3.21 4.84 3.30 3.28
Error Reduction (%) 28 54 46 46 18 -110 -31 -25 35 47
This may be because wavelet preprocessing is well suited for analyzing time series with structural breaks and local behavior [6] that, for example, may cause a change in variance in the series. If there are no such discontinuities or local behavior, then (a) there is no need to use the preprocessing and (b) there is a possibility that the use of wavelet preprocessing may add artifacts to processed series thereby worsening the fit. Our initial estimates of variance for the three series (items 6-8 in Table II) indicate that there is no variance change (Fig. 2).
TABLE I COMPARISON OF MAPE ON RAW DATA USING FUZZY, ANN AND ARIMA MODELS Data Sets FRB Durable Goods FRB Consumer goods FRB Total production FRB Fuels USCB Book Store USCB Clothing USCB Department USCB Furniture USCB Hardware USCB Housing Start
Fuzzy 2.37 2.26 1.94 1.89 8.43 4.26 2.45 3.88 5.05 6.14
Analysis Method ANN [5] ARIMA [5] 3.27 2.98 1.12 2.83 1.01 5.79 1.65 1.16 21.44 3.26 16.57 3.98 8.73 4.33 8.97 2.49 11.89 6.25 10.13 5.18
Fig. 2. Multiscale wavelet variance for USCB clothing, department and furniture time series plotted on a log scale.
[3]
We are currently examining two issues: first, whether or not wavelet preprocessing does add artifacts; and second, if the presence of variance breaks can be used as a diagnostic test as to the feasibility of using wavelet-based preprocessing.
[4]
V. CONCLUSION
[5]
Wavelet preprocessing has been used to improve the forecasting capability of typical universal approximators like neural networks. We have extended the scope of these studies to fuzzy systems. The results obtained on carefully selected time series (USCB and FRB series) that include specific features such as trend and seasonal behavior, and irregular components, indicate that a time series that has homogeneous variance does not require (wavelet) preprocessing. However, the case for series with variance changes and local behavior is a complex one, although we show an improvement in this case. Further studies are required using: (a) much longer time series that do show local behavior and variance change e.g. intraday trading data, together with other test data reported in the wavelet literature (like Nile data [13]); (b) other fuzzy models; and (c) neural networks. These will be investigated and reported in due course. REFERENCES [1]
[2]
K. Hornik, M. Stinchcombe, and H. White, “Multilayer Feedforward Networks are Universal Approximators,” Neural Networks, vol. 2, no. 5, pp. 359 – 366, 1989. B. Kosko, “Fuzzy Systems as Universal Approximators,” IEEE Transactions on Computers, vol. 43, no. 11, pp. 1329–1333, November 1994.
[6]
[7]
[8]
[9] [10]
[11] [12]
[13] [14]
[15]
B-L Zhang, R. Coggins, M.A Jabri, D. Dersch, and B. Flower, “Multiresolution Forecasting for Futures Trading using Wavelet Decompositions,” IEEE Transactions on Neural Networks, vol. 12, no. 4. pp. 765-775, July 2001. Nelson, M., Hill, T., Remus, T., O’Connor, M., ‘Time Series Forecasting using Neural Networks: Should the Data be Deseasonalized First?’ Journal of Forecasting, 18, 359–367, 1999. P.G. Zhang, and M. Qi, “Neural Network Forecasting for Seasonal and Trend Time Series,” European Journal of Operational Research, vol. 160, no. 2, pp. 501-514, 2005. R. Gençay, F. Selçuk, and B. Whitcher, An Introduction to Wavelets and Other Filtering Methods in Finance and Economics. San Diego, California; London: Academic Press, 2002. R. Gençay, F. Selçuk, and B. Whitcher, “Differentiating Intraday Seasonalities Through Wavelet Multi-Scaling,” Physica A, vol. 289, no. 3-4, pp. 543-556, January 2001. I. Daubechies, “Where Do Wavelets Come From? – A personal point of view,” In Proceedings of the IEEE Special Issue on Wavelets, vol. 84, no. 4, pp. 510-513, April 1996. I. Daubechies, Ten Lectures on Wavelets. Philadelphia: SIAM, 1992. J. B. Ramsey, “The Contribution of Wavelets to the Analysis of Economic and Financial Data,” Philosophical Transactions of the Royal Society, London, vol. 357, pp. 2593-2606, September 1999. F. Murtagh, J.-L. Starck, and O. Renaud, “On Neuro-Wavelet Modeling,” Decision Support Systems, vol. 37, pp.475–484, 2004. O. Renaud, J.-L. Starck, and F. Murtagh, “Prediction Based on a Multiscale Decomposition,” International Journal of Wavelets, Multiresolution and Information Processing, vol. 1, no. 2, pp. 217–232, 2003. D. B. Percival, and A. T. Walden, Wavelet Methods for Time Series Analysis. Cambridge: Cambridge University Press, 2000. M. J. Shensa, “The Discrete Wavelet Transform: Wedding the à trous and Mallat Algorithms,” IEEE Transactions on Signal Processing, vol. 40, no. 10, pp. 2464-2482, October 1992. S. Chiu, “Fuzzy Model Identification Based on Cluster Estimation,” Journal of Intelligent & Fuzzy Systems, vol. 2, no. 3, pp. 267-278, 1994.