the best input combination of well logs to train an artificial ... and recovery (ASR) horizon in south Florida (Parra and .... SEG Technical Program Expanded Abstracts have been copy edited so that references provided with the online metadata ...
T
Main Menu
Neural network and rock physics for predicting and modeling attenuation logs Jorge O. Parra*, Southwest Research Institute Ursula Iturrarán-Viveros, Universidad Nacional Autónoma de México Jonathan S. Parra, JPGeosciences P- C. Xu, Datatrend Research Summary P-wave attenuation (Q-1), a powerful attribute, can be used as an indicator of lithology and fluid saturation in the characterization of oil and gas reservoirs. The estimations of Q-1 from a new well at Waggoner reservoir were used to perform data analysis via the Gamma test, a mathematically non-parametric nonlinear smooth modeling tool, to choose the best input combination of well logs to train an artificial neural network (NN) for estimating Q-1. Then the NN was applied to predict attenuation logs in two nearby old wells. The Q-1 logs detect oil saturated sand that was verified with a forward rock physical model. This is a significant result that shows for the first time that oil, gas, and water saturations of sand can be quantified from an attenuation anomaly estimated from full waveform sonic data. In addition, water, oil, and gas saturations of the sand were determined from Q-1 anomalies observed in the old wells. This confirms the production of the Upper Milham oil-saturated sand intercepted by the three wells. This study demonstrates that attenuation logs combined with rock physical models can be used to discriminate between those anomalies associated with lithology and those associated with oil and gas saturations.
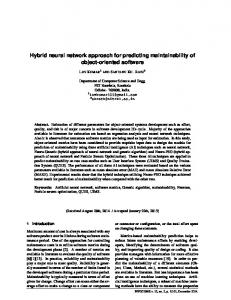
by Parra et al. (2007) was successfully applied to predict attenuation logs from full waveform logging data acquired in a well from the western Hillsboro proposed aquifer storage and recovery (ASR) horizon in south Florida (Parra and Hackert, 2005). This algorithm makes use of the head P-wave of the sonic log and takes into account the inhomogeneity (e.g., thin layers, boundaries) conditions of the formation in the vertical direction along the borehole. The algorithm also has been applied to full waveform sonic data from the Waggoner oil reservoir in northeast Texas to predict attenuation data used in this study. In this paper, we analyze and model data from the Waggoner oil reservoir. Production of this field is primarily from shallower Permian horizons, where thin sandstone and limestone formations represent alternating, fairly rapid transgressive and regressive marine sequences. The reservoir is a sand-shale sequence that is characterized at the borehole and seismic scales. A new well (well 3) was drilled near existing wells 1 and 2 at the site (see Figure 1). In the new well, a complete suite of logs was
Introduction Characterizing oil and gas fields relies on knowledge of the distribution of rock physics properties of the reservoir based on well log data. P-wave and S-wave velocities are the most important data for the evaluation of reservoir rock and fluid properties as well as geotechnical rock properties; however, P-wave attenuation can be used as an indicator of lithology, pore structure, clay, sand and fluid content as well as hydrocarbon saturation. Acoustic attributes from full waveform sonic logs effectively relate to petrophysics and core data in a single borehole. Since the early 1980s, many researchers have attempted to develop techniques for the inversion of Q for single full-waveform acoustic log data, in particular to obtain depth profiles of intrinsic Q-1 from the head P-wave of the sonic data. In an often-used approach, Q-1 is calculated from the amplitude spectral ratio of the head Pwave measured at two locations (e.g., Klimentos, T., 1995; Sun et al., 2000; Dasios et al., 2004). In this approach, the borehole head wave is analogous to the borehole to a plane wave in a uniform unbounded medium. However, the approach does not yield satisfactory results when applied to sonic log wave attenuation. Recently, an algorithm developed
© 2014 SEG SEG Denver 2014 Annual Meeting
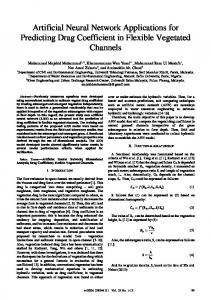
Figure 1: Locations of wells 1, 2, and 3 acquired, including P-wave and S-wave full waveform monopole sonic and dipole sonic. In addition, P-wave full waveform sonic data was processed for acoustic attenuation (Parra et al., 2006) in well 3. Our objective is to predict attenuation logs where these data are not available. The data can then be used to relate attenuation anomalies to fluid saturation and physical properties of the reservoir. To predict Q-1 logs we used the Gamma test to select the best combination of well logs from well 3, and this combination was used to train an Artificial Neural Network (NN) and apply it to estimate Q-1 in wells 1 and 2. Rock physical models were used to verify the attenuation anomalies. We modeled the attenuation anomalies associated with the Milham sand intercepted by the three wells (Figure 2).
DOI http://dx.doi.org/10.1190/segam2014-0095.1 Page 633
T
Main Menu
Predicting and modeling attenuation logs
Neural network design and training Our goal is first to establish a model to predict a Q-1 log using a section (2385-2500 ft) from well 3 as a training dataset. We perform the Gamma test analysis (see Jones 2004) to select the best combination of inputs to train an NN since it is critical to devise a systematic feature selection scheme that provides guidance on choosing the most representative features for estimation of petrophysical parameters. We consider in the analysis: depth and the logs of Vp, Vs, density, porosity, gamma ray, and volumes of sand, shale, and limestone as possible inputs. Among these well logs the best combination of inputs we obtained only includes: depth, gamma ray, Vp, density and porosity. We have used Back propagation learning algorithm to train a Neural Network with a momentum α = 0.15 and a learning rate η = 0.3. The Neural Network is a four-layer network with five inputs and two middle layers each one of them with eight neurons. This is the learning algorithm that produced the best results, reaching a mean square error MSE=0.1876. These results gave us confidence and we extended the training data set to a larger section (13502600 ft) but splitting the data (into two disjoint sets taking every other point with respect to depth) to obtain the training and the testing data sets. We have trained an NN and test its capability of generalization using the testing data set which was not known for the NN and the agreement was very satisfactory. Since we obtained good results from the attenuation, we apply the NN to predict attenuation logs for well 1 and 2. These wells do not have S-wave velocity logs, so we use the synthetic logs calculated with rock physical model for well 1 and 2. To assess the NN results for the three well logs we compared the logs between them and with the gamma ray logs. In Figure 3 we observe a good coherence between all of them and the gamma logs. Interpretation of attenuation anomalies We selected the depth interval 2380- 2550 ft to analyze the attenuation logs of wells 1, 2 and 3 shown in Figure 1. In Figure 4 the Q-1 log of well 3 is correlated with the P-wave and S-wave velocity logs, and the sand and limestone volume logs. There is strong velocity contrast in the limestone layers with the sand and shale observed in the logs. The more compliant portions of the material respond with greater fluid pressure than stiffer portions, therefore, there is enough fluid that can generate losses in the wave field spectrum (Pride, et al, 2004, and Pride 2003). In the attenuation log the anomaly at 2380 ft correlates with the high P-wave velocity contrast at the limestone/shale interface and the attenuation anomaly at 2412 ft correlates with a sand unit that is saturated with oil and brine, and a gas phase is preset as well. The next attenuation anomaly starts at 2430 ft, and correlates with the stiffness contrast at the sand/shale interface sequence. This anomaly increases to a maximum at 2440 ft, and then a new anomaly is formed between the shale and the limestone contact to reach a maximum at 2450 ft. The next major anomaly occurs at 2490 ft, and correlates with the stiffness contrast at the sand/shale interface (the fully water saturated sand is stiffer than shale). The last two attenuation anomalies at 2520 and 2490 ft are associated to velocity contrasts at shale/ limestone interfaces. All of these attenuation anomalies can be modeled with the method developed Dvorkin and Mavko, 2006, and (Mavko, et al, 1998). To calculate the attenuation from modulus of dispersion we use the inverse quality factor equation:
1 Qmax
Where the moduli
M M o 2 M oM
Mo
and M are the low-frequency and the high-frequency limits, respectively. To model the attenuation
anomalies given in the attenuation log of well 3 we select two thin layers of equal thickness in each case. For example, the modeling of attenuation anomalies associated with sand/shale velocity contrasts are conducted by selecting one layer in the sand (Layer 1), and the second layer (Layer 2) in the shale below the boundary between these two units. We model the attenuation anomaly at 2412 ft by selecting the oil-saturated sand (Layer 1) right above the fully brine- saturated shale (Layer 2), both of equal thickness. The input parameters are given in Table 1.
Table 1: Input parameters for model at 2412 feet ϕ fraction
Vp m/s
Vs m/s
ρb g/cm3
Kf GPa
Ks GPa
Ksat GPa
Layer 1
0.18
3730
2066
2.37
0.15
35
19.5
Layer 2
0.16
3609
1981
2.49
2.25
29
19.4
2 © 2014 SEG SEG Denver 2014 Annual Meeting
DOI http://dx.doi.org/10.1190/segam2014-0095.1 Page 634
T
Main Menu
Predicting and modeling attenuation logs
For the input parameters, we obtained the moduli M = 19.45 GPa, and M o = 16.8 GPa, which give the inverse quality factor of 1 Qmod el
M M o 0.073 2 M oM
This value is close to the Q-1 average for the anomaly observed in the log at 2412 ft (track 1 in Figure 4), which is Q-1 = 0.071. In addition, we observed attenuation anomalies associated with the top Upper Milham Sands (see Figure 2) at a depth 2400 ft in wells 1 and 2. These anomalies are due to oil, water, and gas saturations intercepted by the three wells. Table 2 shows the attenuation observed in the Q-1 logs and the corresponding attenuation models, as well as the saturations of oil, water, and gas that give the best fit between the observed and the modeled Q-1 anomaly. Table 2: Attenuation results from wells 1, 2, and 3 1 Qlog
1 Qmod el
Sw
Soil
S gas
Well 1
0.048
0.049
58%
40%
2%
Well 2
0.053
0.054
14%
79%
7%
Well 3
0.071
0.073
55%
20%
25%
Conclusions The rock physical model used to verify the Q-1 anomaly associated with the saturated oil sand layer demonstrates that attenuation data from full waveform sonic logs can be used to identify oil and gas saturation. This confirms that the Q-1 logs derived from sonic logs can be used as an additional formation evaluation tool to characterize the reservoir at the borehole scale. This is a significant result which shows for the first time that the Q-1 logs derived from sonic logs can be used as an additional formation evaluation tool to quantify oil, gas, and water saturations of sand in a reservoir. This is important, because the oil- and gassaturated structure intercepted by the borehole can be predicted at a distance beyond the well by identifying the corresponding Q-1 anomalies from reflection seismic data. We do find that attenuation anomalies can be caused by shale/sand and shale/limestone stiffness contrasts with no oil saturation. This interpretation was confirmed with the aid of conventional well logs, the lithological data, and rock physics modeling. Therefore, this study demonstrates that attenuation logs combined with rock physical models and conventional well logs can discriminate between anomalies associated with wave-induced elastic deformations of heterogeneous lithology and those associated with oil and gas saturations. The Gamma test employed in this study has substantial potential to help build smooth predictive models by identifying relevant input variables. Modelers are able to choose the best input combination before calibrating and testing models. Therefore, the Gamma Test reduces the input selection uncertainty for estimating Q-1. Acknowledgements This work was partially supported by DGAPA-UNAM under project IN116114-2. We thank Todd Thomas and the W.T. Waggoner Estate for providing the data.
3 © 2014 SEG SEG Denver 2014 Annual Meeting
DOI http://dx.doi.org/10.1190/segam2014-0095.1 Page 635
T
Main Menu
Predicting and modeling attenuation logs
Figure 2: Geological cross section showing the oil-saturated sand based on the lithologic columns from wells 1, 2, and 3.
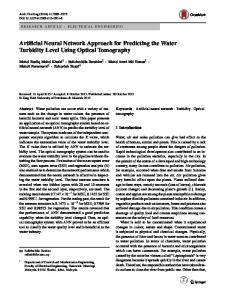
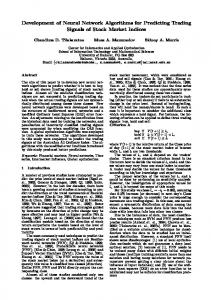
Figure 3: (left) Comparison between synthetic Q-1 logs with the corresponding gamma logs of wells 1 and 3. Track 1 and track2 contain the Q-1 and gamma logs of well 3, and track 3 and track 4 contain the Q-1 and gamma logs of well 1. Figure 4: (right) Comparison of the Q-1 log (track 1) extracted from full waveform sonic log data with P-wave and S-wave velocity logs (track 2), as well as limestone (blue) and sand (red) volumes of well 3 (track 3). The attenuation anomaly associated with oil and gas saturations is observed in the depth interval of 2400-2420 ft in track 1.
4 © 2014 SEG SEG Denver 2014 Annual Meeting
DOI http://dx.doi.org/10.1190/segam2014-0095.1 Page 636
T
Main Menu
http://dx.doi.org/10.1190/segam2014-0095.1 EDITED REFERENCES Note: This reference list is a copy-edited version of the reference list submitted by the author. Reference lists for the 2014 SEG Technical Program Expanded Abstracts have been copy edited so that references provided with the online metadata for each paper will achieve a high degree of linking to cited sources that appear on the Web. REFERENCES
Dasios, A., C. McCann, and T. Astin, 2004, Least-squares inversion of in-situ sonic Q measurements: Stability and resolution: Geophysics, 69, 378–385, http://dx.doi.org/10.1190/1.1707056. Dvorkin , J., and G. Mavko, 2006, Modeling attenuation in reservoir and reservoir rock: The Leading Edge, 25, 194–197, http://dx.doi.org/10.1190/1.2172312. Jones, A. J., 2004, New tools in non-linear modeling and prediction: Computational Management Science, 1, no. 2, 109–149, http://dx.doi.org/10.1007/s10287-003-0006-1. Klimentos , T., 1995, Attenuation of P- and S-waves as a method of distinguishing gas and condensate from oil and water: Geophysics, 60, 447–458, http://dx.doi.org/10.1190/1.1443782. Mavko, G., M. Tapan, and J. Dvorkin, 1998, The rock physics handbook: Cambridge University Press. Parra, J. O., and C. L. Hackert, 2006, Modeling and interpretation of Q logs in carbonate rock using a double porosity model and well logs : Journal of Applied Geophysics, 58, no. 3, 253–262, http://dx.doi.org/10.1016/j.jappgeo.2005.07.003. Parra, J. O., C. L. Hackert, P.-C. Xu, and H. A. Collier, 2006, Attenuation analysis of acoustic waveforms in a borehole intercepted by a sand-shale sequence reservoir : The Leading Edge , 25, 186–193, http://dx.doi.org/10.1190/1.2172311. Parra, J. O., P.-C. Xu, and C. L. Hackert, 2007, A borehole -model-derived algorithm for estimating QP logs from full-waveform sonic logs : Geophysics, 72, no. 4, E107–E117, http://dx.doi.org/10.1190/1.2734109. Pride, S. R., and J. G. Berryman, 2003, Linear dynamics of double -porosity dual-permeability materials. I. Governing equations and acoustic attenuation: Physical Review E: Statistical, Nonlinear, and Soft Matter Physics, 68, no. 3, 036603, http://dx.doi.org/10.1103/PhysRevE.68.036603. Pride, S. R., J. G. Berryman, and J. M. Harris, 2004, Seismic attenuation due to wave-induced flow: Journal of Geophysical Research: Solid Earth, 109, no. B1, http://dx.doi.org/10.1029/2003JB002639. Sun, X., X. Tang, C. H. Cheng, and L. N. Frazer, 2000, P- and S-wave attenuation logs from monopole sonic data: Geophysics, 65, 755–765, http://dx.doi.org/10.1190/1.1444774.
© 2014 SEG SEG Denver 2014 Annual Meeting
DOI http://dx.doi.org/10.1190/segam2014-0095.1 Page 637