Nevertheless, if f is a Gaussian density one can determine (for r = 2 as ...... learning rates, optimality, etc) but also practical ones deserve future attention.
Neural Networks with Error-Density Risk Functionals for Data Classification
Lu´ıs Miguel Almeida da Silva
Thesis submitted to the Engineering Faculty of University of Porto, Portugal, for the partial fulfillment of the requirements for the degree of Doctor of Philosophy made under the supervision of Doctor Joaquim Marques de S´ a, Full Professor at the Faculty of Engineering of the University of Porto, Portugal and Doctor Lu´ıs A. Alexandre, Assistant Professor at the Beira Interior University, Covilh˜ a, Portugal.
April 2008
To my parents, Ana and those who have left...
Resumo O princ´ıpio da minimiza¸c˜ ao da entropia do erro - MEE - foi recentemente proposto como um novo paradigma de aprendizagem, no qual uma medida da entropia do erro ´e usada como funcional de risco. O princ´ıpio pode ser usado, por exemplo, para o treino de redes neuronais. O MEE foi inicialmente aplicado a problemas de regress˜ao e em anos mais recentes, no seio do nosso grupo, ao treino de classificadores baseados em redes neuronais. Em ambas as abordagens, a defini¸c˜ ao de entropia utilizada foi a proposta por R´enyi. Neste trabalho progrediu-se em dois sentidos: Primeiro, num ˆ ambito mais pr´ atico, considerou-se a entropia de Shannon como funcional de risco no princ´ıpio MEE, para o treino de classificadores baseados em redes neuronais. Deduzimos um estimador para este caso e prov´amos algumas das suas propriedades. Baseados na experiˆencia adquirida com as medidas entr´ opicas, propus´emos tamb´em duas novas fun¸c˜oes de custo para o treino de redes neuronais: a) a maximiza¸c˜ao da densidade na origem (Z-EDM); b) a sua vers˜ ao generalizada sob a forma de uma fun¸c˜ao exponencial (EExp ) dependente de um u ´nico parˆ ametro, podendo este ser ajustado por forma a emular uma fam´ılia infinita de funcionais de risco.
V´arios procedimentos experimentais
foram realizados por forma a se avaliar os m´etodos propostos, tendo estes obtido uma melhor performance na maior parte dos casos. Em segundo e por u ´ltimo, efectu´amos um estudo cuidado do princ´ıpio da mii
nimiza¸c˜ ao da entropia do erro em classifica¸c˜ao de dados, analisando os casos de m´ aquinas tipo parti¸c˜ ao u ´nica e perceptr˜ao.
Esta an´ alise permitiu uma
melhor compreens˜ ao dos comportamentos e evidenciar as diferen¸cas entre o MEE te´ orico e o MEE pr´ atico. Um grande conjunto de resultados novos e talvez surpreendentes s˜ ao apresentados, tanto para o caso do MEE com erros discretos como para o caso do MEE com erros cont´ınuos.
ii
Abstract The principle of minimum error-entropy - MEE - has been recently proposed as a new learning paradigm, where a measure of error entropy is used as risk functional. This principle can be used, for example, for neural network training. MEE was first applied in regression-type tasks and in more recent years, within our team, to the training of neural network classifiers. In both these approaches, R´enyi’s definition of entropy was used. In this work we have progressed in two ways: First, in a more practical approach, we considered the use of Shannon’s entropy as the risk functional in the framework of MEE, for the training of neural network classifiers. We derived an estimator for this case and proved some of its properties. Also, and guided by the experience gained from entropic criteria, we derived and proposed two new cost functions for neural network training: a) the zero-error density maximization (Z-EDM); b) its generalized version in the form of an exponential function (EExp ) with a single parameter, which can be tuned to emulating an infinite family of risk functionals. Several practical experiments were conducted providing the necessary assessment of the proposed methods, which often outperform the conventional ones. Second and finally, we performed a careful study of the minimum error-entropy principle for data classification, by analyzing the case of univariate single splits and perceptron-based machines. This analysis provided the needed insight to iii
understanding the behavior and the differences between the theoretical and practical MEE in data classification. A large set of new interesting and probably surprising results, both for the case of MEE with discrete errors and MEE with continuous errors, were established.
iv
R´ esum´ e Le principe de la minimisation de l’entropie de l’erreur - MEE - a ´et´e r´ecemment propos´e comme un nouveau paradigme d’apprentissage au sein duquel la mesure de l’entropie de l’erreur est utilis´ee comme fonctionnel de risque. Ce principe peut ˆetre utilis´e, par exemple, pour l’apprentissage de r´eseaux de neurones. Initialement, MEE a ´et´e apliqu´ee `a des probl`emes de regression et, plus r´ecemment, au sein de notre groupe de recherche, elle a ´et´e apliqu´ee a` l’apprentissage de classificateurs bas´es sur des r´eseaux de neurones. Dans les deux approches, la d´efinition d’entropie utilis´ee a ´et´e celle propos´ee par R´enyi. Dans ce travail, nous avons progress´e dans deux sens: D’abord, d’un point de vue plus pratique, nous avons envisag´e l’entropie de Shannon comme un fontionnel de risque dans le principe MEE pour l’apprentissage de classificateurs bas´es sur des r´eseaux de neurones. Nous avons d´eduit un estimateur pour ce cas particulier et nous avons soumis quelques de ses propri´et´es `a des tests. En nous basant sur l’exp´erience acquise avec les mesures entropiques, nous proposons aussi deux nouvelles fonctions de coˆ ut pour l’apprentissage de r´eseaux de neurones: a) la maximisation de la densit´e dans l’origine (Z-EDM); b) sa version g´en´eralis´ee sous forme d’une fonction exponentielle (EExp ) d´ependante d’un seul param`etre, qui peut ˆetre adapt´e de fa¸con `a ´emuler une famille infinite de fonctionnelles de risque.
Nous avons utilis´e plusieures proc´edures
exp´erimentales pour faire une ´evaluation des m´ethodes propos´ees. Les r´esultats v
d´emontrent que ces m´ethodes ont, g´en´eralement, une meilleure performance. Puis, nous avons fait une ´etude soigneuse du principe de la minimisation de l’entropie de l’erreur dans la classification des donn´ees, en analysant les machines ` a division simple et les machines bas´ees en perceptrons. Cette analyse a permis une meilleure compr´ehension des comportements et a mis en ´evidence les diff´erences entre MEE th´eorique et MEE pratique. Un grand ensemble de r´esultats nouveaux et peut-ˆetre surprennants est pr´esent´e, non seulemente pour MEE avec des erreurs discr`etes, mais aussi pour MEE avec des erreurs continus.
vi
Acknowledgments It is not always easy to find the appropriate words to express how much we are thankful to all the persons that somehow contribute to our success. Nevertheless, I would like to thank the collaboration and help demonstrated by everyone surrounding me in the last four years. Special words have to be directed to my supervisors, Professor Marques de S´ a and Professor Lu´ıs Alexandre. I thank Professor Marques de S´ a for receiving me at NNIG in INEB, for giving me a research direction and for all the help, ideas and comments given during this work. His enthusiasm is inspiring to all of us. I also thank Professor Lu´ıs Alexandre, for his important contributions, valuable opinions, discussions and ideas. I would like to thank also to my colleagues at INEB, for their friendship, support and valuable discussions about the topics of this work. It is a pleasure to be part of this team. A special thank to my parents and Ana. Without them, nothing of this would be possible. Finally, I would like to thank the support from FCT - Funda¸ca˜o para a Ciˆencia e a Tecnologia, grant SFRH/BD/16916/2004.
vii
Contents
1 Introduction
1
2 Basic Concepts
9
2.1
Statistical Decision Theory vs. Learning from Data . . . . . . . . 2.1.1
2.3
2.4
Optimal Decision Rules: Minimum Error Probability and Minimum Risk . . . . . . . . . . . . . . . . . . . . . . . .
10
The Classifier Problem . . . . . . . . . . . . . . . . . . . .
16
The PDF Estimation Problem . . . . . . . . . . . . . . . . . . . .
19
2.2.1
Histogram-based Estimators . . . . . . . . . . . . . . . . .
21
2.2.2
Kernel Density Estimators . . . . . . . . . . . . . . . . . .
23
Artificial Neural Networks . . . . . . . . . . . . . . . . . . . . . .
27
2.3.1
The Perceptron . . . . . . . . . . . . . . . . . . . . . . . .
28
2.3.2
Feed-forward Multilayer Perceptrons . . . . . . . . . . . .
31
2.3.3
Cost functions . . . . . . . . . . . . . . . . . . . . . . . .
38
Entropy and its Estimation . . . . . . . . . . . . . . . . . . . . .
44
2.1.2 2.2
10
ix
2.4.1
Basic Definitions and Properties . . . . . . . . . . . . . .
44
2.4.2
The Principle of Minimum Error Entropy . . . . . . . . .
48
2.4.3
Estimating Entropy from Data . . . . . . . . . . . . . . .
51
2.4.3.1
Estimating Shannon’s Entropy . . . . . . . . . .
51
2.4.3.2
R´enyi’s Quadratic Entropy Estimation
54
. . . . .
3 Neural Networks with Error PDF Estimation 3.1
3.2
3.3
55
The Principle of Minimum Error Entropy . . . . . . . . . . . . .
55
3.1.1
The MEE Approach using R´enyi’s Entropy . . . . . . . .
56
3.1.2
The MEE Approach using Shannon’s Entropy . . . . . . .
59
3.1.2.1
Algorithm Optimization . . . . . . . . . . . . . .
61
3.1.2.2
Analysis of Shannon’s Entropy Estimator . . . .
62
3.1.2.3
Experiments . . . . . . . . . . . . . . . . . . . .
66
The Principle of Density Maximization . . . . . . . . . . . . . . .
68
3.2.1
The Zero-Error Density Maximization . . . . . . . . . . .
68
3.2.2
An Exponential Cost Function: Generalizing Z-EDM . . .
75
3.2.3
Experiments . . . . . . . . . . . . . . . . . . . . . . . . .
77
3.2.3.1
Procedure 1 . . . . . . . . . . . . . . . . . . . .
77
3.2.3.2
Procedure 2 . . . . . . . . . . . . . . . . . . . .
80
Overall Comparison . . . . . . . . . . . . . . . . . . . . . . . . .
82
4 Theoretical Analysis of MEE: the Discrete Errors Case x
87
4.1
General Setting . . . . . . . . . . . . . . . . . . . . . . . . . . . .
87
4.2
Split-type Setting . . . . . . . . . . . . . . . . . . . . . . . . . . .
88
4.2.1
MEE Splits for Uniform Distributions . . . . . . . . . . .
89
4.2.2
MEE Splits for Mutually Symmetric Distributions . . . .
94
4.2.3
MEE Splits in Practice
4.3
. . . . . . . . . . . . . . . . . . . 100
Perceptron Setting . . . . . . . . . . . . . . . . . . . . . . . . . . 108 4.3.1
The General Setting . . . . . . . . . . . . . . . . . . . . . 109
4.3.2
The Case of Two Gaussian Classes . . . . . . . . . . . . . 113
5 Theoretical analysis of MEE: the Continuous Errors Case
123
5.1
General Setting . . . . . . . . . . . . . . . . . . . . . . . . . . . . 123
5.2
Split-type Setting . . . . . . . . . . . . . . . . . . . . . . . . . . . 125 5.2.1
Linear Activation Function . . . . . . . . . . . . . . . . . 126
5.2.2
Squashing Activation Function . . . . . . . . . . . . . . . 127
5.3
Perceptron-type Setting . . . . . . . . . . . . . . . . . . . . . . . 134
5.4
Estimating the Error Density . . . . . . . . . . . . . . . . . . . . 138
6 Conclusions
147
A Maximum Likelihood and Kullback-Leibler Divergence
153
A.1 Maximum Likelihood . . . . . . . . . . . . . . . . . . . . . . . . . 153 A.2 Kullback-Leibler Divergence . . . . . . . . . . . . . . . . . . . . . 154 xi
A.3 Unifying Approach . . . . . . . . . . . . . . . . . . . . . . . . . . 155
B A Simple Monotonic Cost Function
157
ˆS C Gradient and Hessian of H
161
D A Result on the H¨ older Exponent
167
E Data Sets
169
E.1 Artificial Data Sets . . . . . . . . . . . . . . . . . . . . . . . . . . 169 E.2 Real-world Data Sets . . . . . . . . . . . . . . . . . . . . . . . . . 171
Bibliography
185
xii
List of Tables 2.1
Efficiency values (as defined in [105]) of several kernels. . . . . .
3.1
Mean test error (%) and standard deviations (in brackets) in five
27
ˆ S , EM SE and ECE . Best results of each UCI data sets using H method are in bold. . . . . . . . . . . . . . . . . . . . . . . . . . 3.2
67
Convergence success rates in 100 repetitions of different MLP’s trained with Z-EDM and MSE for the Pb12 data set. Below are the mean training errors and standard deviations. . . . . . . . . .
3.3
Results from the application of Procedure 1 to six data sets given in the form “%test error(standard deviation)-number of epochs”.
3.4
70
79
Results from the application of Procedure 2 to six data sets given in the form “%test error(standard deviation)-number of epochs”.
81
3.5
Number of hidden neurons, hid, used for each data set. . . . . . .
83
3.6
Results for 2×2 and 4×4 checkerboard data sets. Significantly best results underlined. . . . . . . . . . . . . . . . . . . . . . . .
3.7
85
COR results for real-world data sets. Significantly best results underlined. . . . . . . . . . . . . . . . . . . . . . . . . . . . . . . xiii
86
4.1
Test error (%) and standard deviations (in parenthesis) obtained with MEE and MSE for the simulated Gaussian data. Different values of d were used and the Bayes error was determined for each case. Underlined results are not statistically different from the Bayes error. . . . . . . . . . . . . . . . . . . . . . . . . . . . . 103
4.2
Test error (%) and standard deviations (in brackets) obtained with MEE (maximization approach) and MSE for the simulated Gaussian data (d = 1.5). Underlined results are not statistically different from the Bayes error. . . . . . . . . . . . . . . . . . . . . 106
4.3
Description of the univariate two-class problems used from real data. x is the input variable used and classes is the two classes used from each data set. The last two rows show the p-values for the normality and homogeneity of variances tests. . . . . . . . . . 107
4.4
Percentage of test error (standard deviation in brackets) for the univariate split problems of Table 4.3 with MEE and MSE. The last row presents the p-values of the test of equality of means. . . 107
E.1 The artificial checkerboard data sets, where k = 2, 4. . . . . . . . 170 E.2 The real-world data sets used in this work.
xiv
. . . . . . . . . . . . 171
List of Figures
1.1
The pattern recognition problem from the machine learning point of view. . . . . . . . . . . . . . . . . . . . . . . . . . . . . . . . .
1.2
(a) Variance as a function of α. (b) R´enyi’s entropy as a function of α. . . . . . . . . . . . . . . . . . . . . . . . . . . . . . . . . . .
2.1
2
5
Examples of two-class problems. At the left, a single split is sufficient to solve the problem. The shadowed areas represent the error probabilities for each class. At the right, the problem needs two splits to be optimally solved. . . . . . . . . . . . . . .
2.2
12
Possible no-intersection or intersection situations in a two-class problem with continuous class-conditional density functions. The light shadowed areas in (b) and (c) represent P e(x0 ) where x0 is the abcissa of the intersection point. The dark shadowed area in (b) represents the amount of error probability added to P e(x0 ) when the splitting point is deviated to x0 − δ. The dashed area in (c) is the amount of error probability subtracted from P e(x0 ) when the splitting point is deviated to x0 − δ. . . . . . . . . . . . xv
14
2.3
A three-class problem with bivariate Gaussian distributions. The class-conditionals pdf’s (with equal priors) are represented at the left, while the corresponding decision boundaries are represented at the right. Three decision regions are defined. . . . . . . . . . .
2.4
16
From left to right we compare fˆH (x), fˆR (x) and fˆ(x) respectively. The dashed line is the true density (Gaussian). In the top figures, N = 20 (random points), m = 5 and hN = 0.3, while at the bottom figures N = 2000, m = 30 and hN = 0.3. . . . . . . . . .
24
2.5
Graphical representation of a single perceptron. . . . . . . . . . .
29
2.6
Graph representation of a feed-forward MLP with d inputs, n hidden neurons in a single hidden layer and C outputs. . . . . . .
2.7
32
Support space (shadowed cubes) for the error distribution in a three-class problem, e = (e1 , e2 , e3 ). . . . . . . . . . . . . . . . . .
38
2.8
Contours of EM SE for a C1 pattern. . . . . . . . . . . . . . . . . .
43
2.9
Surface and contours (filled with a grayscale colormap where brighter colors correspond to higher values) for HS as a function of the probabilities. . . . . . . . . . . . . . . . . . . . . . . . . . .
3.1
45
At the left: Mean test error curves (10 runs) as functions of h for Sonar (solid) and New Thyroid (dashed). At the right: Mean training error curves (25 runs) for variable and fixed learning rate. 63
3.2
Decision boundaries for Pb12. Solid dark line was obtained with Z-EDM and dashed light line with MSE. . . . . . . . . . . . . . .
3.3
71
Mean training curves with Z-EDM for different values of h in two data sets. . . . . . . . . . . . . . . . . . . . . . . . . . . . . . . . xvi
72
3.4
ϕ(e) as in (3.24) for different values of N and h. . . . . . . . . .
73
3.5
Plot of the functions defined in (3.29). . . . . . . . . . . . . . . .
74
3.6
Plot of ϕExp = exp(e2 /τ )e for different positive values of τ . . . .
76
3.7
Choice of τ in EExp for New Thyroid. . . . . . . . . . . . . . .
78
4.1
Schematic drawing of the simple problem of setting w0 to classify two uniform overlapped classes. . . . . . . . . . . . . . . . . . . .
4.2
Shannon entropy (dashed line) and probability of error (solid line) plotted as functions of w0 . . . . . . . . . . . . . . . . . . . . . . . .
4.3
90
91
(a) Contours of HS (filled with a gray colormap where brighter colors correspond to higher values) and a general path, Ppath , produced by P . Also shown, some contours for P = P-1 + P1 = const. (b) P and HS plotted as functions of w0 for the Ppath in (a). . .
4.4
The lognormal distribution case.
93
(a) If the distributions are
distant the Stoller split is an entropy minimum at the inner intersection. (b) The inner intersection is still an entropy minimum but the Stoller split is at one of the outer intersections. . . . . . . 100 4.5
Error entropy for different values of h in the Gaussian distribution example with d = 1.5. . . . . . . . . . . . . . . . . . . . . . . . . 105
4.6
Density estimates of a training set for the two class problem of iris-petal length with h = 0.16 in (a) (minimization procedure) and h = 1 in (b) (maximization procedure). xvii
. . . . . . . . . . . 109
4.7
HS for different values of µ11 = −µ-11 . From left to right we decrease the distance between the classes. The top figures were drawn with w2 = 0, while the bottom ones were drawn with w0 = 0. . . . . . . . . . . . . . . . . . . . . . . . . . . . . . . . . 115
4.8
Surface levels of HS (values of c also shown). Figure (c) is split into three subfigures with increasing value of c from left to right. 117
4.9
Probability mass functions for close (top) and distant (bottom) classes in the Stoller split setting. Figures from left to right correspond to the split position at the left, at the location and at the right of the optimal split, respectively. . . . . . . . . . . . . . 120
5.1
Illustration of the transformation E = T − Y , emphasizing the fact that fE (0) = 0 for continuous class conditionals. . . . . . . . 125
5.2
Shannon (solid) and R´enyi (dashed) entropies as a function of w0 for the case of uniform classes. . . . . . . . . . . . . . . . . . . . 131 dHS dw0
5.3
Contour level
5.4
Shannon (solid) and R´enyi’s (dashed) entropies as a function of
= 0 as a function of c and k. . . . . . . . . . . 132
w0 for the case of Gaussian classes. 5.5
. . . . . . . . . . . . . . . . 133
Surfaces and contour plots of HS (w1 , w0 ) for different values of [c, d]. . . . . . . . . . . . . . . . . . . . . . . . . . . . . . . . . . . 135
5.6
At the top: HS (w1 , w0 ) for fixed values of w1 and different locations of the Gaussians. At the bottom: Surface and contour plot of HS (w1 , w0 ).
. . . . . . . . . . . . . . . . . . . . . . . . . . . . 137 xviii
5.7
The kde smoothing effect. The top figures show the class conditional pdf’s with the split location (solid vertical line). The middle and bottom figures show the theoretical (solid line) and kde (dashed line) error pdf’s for the corresponding split for two different values of h. . . . . . . . . . . . . . . . . . . . . . . . . . 139
5.8
Effect of the kde in Shannon’s (dashed) and R´enyi’s (solid) error entropies for the single split setting. . . . . . . . . . . . . . . . . 141
5.9
Minimum mean value (20 repetitions) of h that produces a minimum of Shannon’s entropy within a neighborhood of the optimal split no greater than 10% of the distance ∆µ between the classes. The value is computed only if the procedure is successful in more than half of the repetitions. Classes have 50 (solid), 200 (dashed) and 500 (dotted) data points each and equal unit variance. . . . 142
5.10 Joint effect of the kde and the perceptron in Shannon’s entropy. Figures show contour lines filled with a grayscale colormap: higher values of HS correspond to brighter tones. The solid white line represents the set of optimal solutions. . . . . . . . . . . . . . . . 143
B.1 At the top: Error surface and contour plots of ESM F in the presence of a pattern from C1 ; At the bottom: The same but for a pattern from C2 . . . . . . . . . . . . . . . . . . . . . . . . . 158 B.2 Effect of increasing the power of a polynomial function xγ . . . . . 159
D.1 Local behavior of f for different values of α . . . . . . . . . . . . 168 xix
E.1 An example of the 4×4 checkerboard data set with 400 points (100 elements in the minority class: dots). Dotted lines are for visualization purpose only. . . . . . . . . . . . . . . . . . . . . . . 170 E.2 The PB12 data set. . . . . . . . . . . . . . . . . . . . . . . . . . 179
xx
Symbols and Abbreviations Symbols C
number of classes
N
number of patterns of a data set
d
vector dimension
w
weight vector
w0
bias weight
x
input vector
xT
transpose vector
w∗
optimal value
h, hN
smoothing parameter
Ck
class k
min P e
minimum probability of error
E
cost function
E{·}
expected value
ϕ
activation function
η
learning rate
ˆS HS , H
Shannon entropy, estimator
ˆ Rα HRα , H
R´enyi’s entropy, estimator
I[a,b] (x)
indicator function
xxi
Abbreviations NN
neural networks
MLP
multilayer perceptron
MEE
minimum error entropy
MSE
mean square error
Z-EDM
zero-error density maximization
SMF
simple monotonic cost function
pdf
probability density function
UCI
machine learning repository at Univ. California Irvine
ROC
receiver operating characteristic
AUC
area under the (ROC) curve
BCR
balanced correct
COR
classification correct rate
ML
maximum likelihood
KL
Kulback-Leibler
xxii
Chapter 1
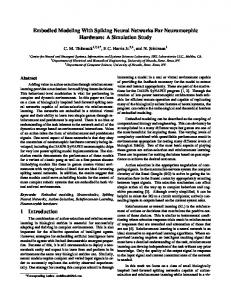
Introduction Pattern recognition is a daily task performed by every human being. We are constantly being requested to recognize the face of our relatives, to recognize our car among dozens in a parking lot, to recognize the song whistled by someone in the bus. Obviously, this is only possible because we learned how to do it. However, there are several more complex recognition tasks in the real world that we would like (and need) to perform with precision and as fast as possible. A good example are mail services where the need to automate the correspondence distribution has led to the construction of machines capable of recognizing text. These and other necessities gave rise to a new computer science discipline, machine learning, concerned with the design and development of algorithms and strategies to allow computer-like machines to learn and take decisions. In pattern recognition, learning is often driven by a desired response, also called target, (as if we were watching (studying/learning) some set of objects and someone was telling us what they are), which describes a set of classes or groups. This supervised learning paradigm can be understood under the general principle of statistical inference [109]:
1
2
CHAPTER 1. INTRODUCTION
Functional dependency Real World
t
x
Learning Machine
y
e L(e)
Figure 1.1: The pattern recognition problem from the machine learning point of view.
Given a collection of empirical data originating from some functional dependency, infer this dependency.
The functional dependency for pattern recognition relates the characteristics measured from the objects and the desired response. This is illustrated in Figure 1.1. From a real world problem we measure a set of appropriate characteristics (variables or features) x. For example, in the problem of recognizing our car in a parking lot, we could measure the color, the brand, some characteristics of the shape (if it is a van or a hatchback) and so on. An appropriate functional dependency or relationship between those variables (usually a statistical one) will influence the desired response t (is it mine or not?). The goal of the learning machine is to appropriately model the functional relationship and to substitute us in the recognition process. Several types of learning machines have been proposed. From the most simple, like Rosenblatt’s perceptron [87] or Widrow’s ADALINE [113] to the more complex multilayer perceptrons or support vector machines [109]. A learning machine is basically a parameterized model that receives the information x and produces an output y. This is compared to the
3 desired target t, usually as e = t − y, and a cost function L(e) controls the adaptation (performed by some algorithm) of the parameters such that y will be closer to t. This means that the machine, here designated as a classifier, is learning the relationship. Therefore, one can consider three main aspects that influence the learning process: the machine’s capability (related to the model complexity), the algorithm’s capability and the cost function. This work is concerned with the latter, that is, we assume a given complexity of the model, fix some training algorithm and study the performance of (or propose) different cost functions. Since the early times that the mean square error (MSE), a second order statistic, is the popular choice. Several reasons can be given to explain this choice, including the belief that most real-life random processes can be modeled by the Gaussian distribution (which is solely described by its first and second order moments) or the fact that when using linear machines, the exact solutions can be obtained and several theoretical results derived. Due to its simplicity and tractability, MSE has thus been chosen as the default optimality criterion, even for nonlinear machines. However, more complex problems appeared in areas like signal processing that could not be solved by mere use of second order statistics. Moreover, when dealing with classification, the Gaussianity assumption is not valid. This has influenced the development of other optimality criteria like the cross-entropy (CE) cost function [106]. In this sense, researchers made an effort to derive more appropriate measures capable of extracting more information from the data and capable of constraining high-order moments. An important step in this way was given in 1948 by Claude Shannon, when the concept of information entropy in communication systems was introduced. This brought a new area of research, information theory, which was enriched by contributions of many researchers, where probably one of the most important was Alfred R´enyi. The scientific community rapidly understood that the applicability of information theory was not restricted to communication systems.
Entropy and
related concepts of mutual information and Kulback-Leibler divergence have
4
CHAPTER 1. INTRODUCTION
been used in learning systems (supervised or unsupervised) in several ways. The principle of minimum cross-entropy enunciated by Kulback [62] was introduced as a powerful tool to build complete probability distributions when only partial knowledge is available. The maximization of mutual information between the input and the output of a neural network (the Infomax principle) was introduced by Linsker [69] as an unsupervised method that can be applied, for example, to feature extraction. Applications to blind source separation or independent component analysis have also been proposed with the principles of maximum entropy and minimum mutual information [9, 67, 116, 117]. Recently, Pr´ıncipe and co-workers proposed new approaches on the application of entropic criteria to learning systems, introducing the terminology information theoretic learning (ITL) [82]. The first works started with Fisher [30, 31] and Xu [83, 114, 115]. Whereas Fisher studied subspace projections and nonlinear principal component analysis (and not directly the adaptation problem), Xu provided the first applications to learning systems and the derivation of the nonparametric estimator of R´enyi’s quadratic entropy. These works were fundamental for the later work of Erdogmus [19, 21, 24], from which one of the main contributions was the principle of minimum error entropy (MEE) for learning systems. The principle is as follows: one should minimize the entropy of the difference (error) between the output and the target of a learning system, E = T − Y . The minimization
of error entropy1 implies a reduction on the expected information contained in
the error, which leads to the maximization of the mutual information between the desired target and the system output [21]. This means that the classifier is learning the target variable. Entropy-based cost functions, as functions of the probability density functions, reflect in some sense the global behavior of the error distribution; therefore, learning systems with entropic cost functions are expected to outperform those 1
Notice that the distribution with minimum entropy (continuous random variable) is the
δ-Dirac.
5
10
2 H
Var 5
1
1
alpha
2
3
(a)
2
4
alpha
6
8
10
(b)
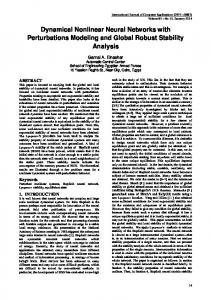
Figure 1.2: (a) Variance as a function of α. (b) R´enyi’s entropy as a function of α. that use the popular MSE rule, which only reflects the second order statistics of the error. In fact, concerning MSE, the main and often mentioned results are that for Gaussian distributions MSE yields the optimal regression solution and that the outputs of a neural network trained with MSE correspond to Bayesian posterior probabilities [11, 86], which allow some confidence that MSE will also perform well in classification problems. However, MSE may fail for some families of error pdf’s where MEE performs in the optimal way. As an example of how that might happen, suppose that E has a continuous distribution defined by a sum of triangular distributions f (e) =
1 [T r(e, 0, α) + T r(e, −α, 0) + T r(e, 0, 1/α) + T r(e, −1/α, 0)] , 4
where, for α > 0,
T r(x, a, b) =
4(x−a)2 (b−a)
4(b−x) (b−a)2
a ≤ x ≤ (b + a)/2
.
(1.1)
(b + a)/2 < x ≤ b
Figure 1.2 shows the variance and R´enyi’s quadratic entropy of E plotted as functions of α. We observe that the variance has a minimum at α = 1 while entropy attains its minimum value for α → 0 or α → +∞, that is when
6
CHAPTER 1. INTRODUCTION
the family converges to a δ-Dirac function at zero, the optimal error solution. Another type of problem where the practical application of MSE may completely fail is when the error data is characterized by a fat-tail distribution, such as sometimes encountered in financial time series. Take the Cauchy distribution. Empirical variances computed in a Cauchy time series vary erratically, since the Cauchy distribution has no variance; however, it does have a finite Shannon entropy; so the application of MEE to such time series is not a problem. The outperformance of MEE over MSE has been shown in the cited works, a good example of which is the prediction of the Mackey-Glass temporal series described in [24]. An objection that could be raised to using the MEE principle is the need to estimate the probability density function (pdf) of E, in the case of continuous error distributions. Now, it is a well-known fact that accurate pdf estimation may be a tougher problem than having to solve a related regression or classification problem. However, it turns out that when applying the MEE principle using R´enyi’s quadratic entropy, pdf estimation is shortcircuited altogether [82]. Even if one uses Shannon’s entropy usually a simple and coarse pdf estimate is all that is needed [104]. The application of MEE to classification tasks was developed at our team by Jorge Santos [90]. The training of MLP classifiers with R´enyi’s quadratic entropy as well as several optimization improvements were divulged in several papers [91, 93, 94, 96]. Entropic quantities were also adopted to define a new dissimilarity matrix and a new clustering algorithm, LEGClust [95], that was applied to task decomposition in modular neural network classifiers [92]. The application to recurrent networks was also provided in [4] as well as with classifiers using a kernel-based approach [42]. All these approaches provided good results, showing that entropic measures are good alternatives to MSE. The previous works motivated several issues, including the question of whether Shannon’s entropy could also be used for the training of MLP classifiers. Also,
7 and despite the practical evidence on the performance of the aforementioned methods, it was important to understand what is really happening and whether or not MEE solutions are able to provide optimal solutions in the minimum probability of error sense. These were major concerns focused by our work, whose main contributions presented in this thesis can be enumerated as follows:
1. The use of an estimator of Shannon’s entropy of the errors as the risk functional for training MLP classifiers [104]. An analytical study of the estimator is presented. 2. The proposal of the Z-EDM (zero-error density maximization) cost function, which results from ideas of entropy minimization [99, 101]. 3. The generalization of Z-EDM, providing a new parameterized exponential cost function capable of emulating a wide range of behaviors, including the one obtained with MSE, CE and Z-EDM [100]. 4. An analytical study of the single perceptron with threshold activation function in light of the MEE principle.
Several interesting (and probably
unexpected) results are found [102]. 5. The extension of the previous study to the case of continuous errors, that is, perceptron-like machines with continuous activation functions [103].
Along the development of our work several new theoretical results were found and are described, namely the demonstration of about ten new Theorems and Lemmas. The present thesis is organized as follows: In Chapter 2 we review the main concepts used in this work. Most of the topics, like the pdf estimation problem and artificial neural networks, are well known and established theories and may be skipped. Nevertheless, they are used to
8
CHAPTER 1. INTRODUCTION
introduce the main notation used throughout the text. In the first section, about statistical decision theory, we demonstrate a first Theorem, while the section about entropy introduces the minimium error-entropy principle. Chapter 3 contains the discussion and application of error-pdf-based cost functions using MLP’s: Shannon’s entropy, the zero-error density maximization and the generalized exponential function. Some new results regarding Shannon’s entropy are also demonstrated. Comparative studies of the proposed methods are presented. In Chapter 4, the MEE principle is studied from the theoretical point of view of data classification when the available machines are threshold-type. This amounts to the study of the case of discrete errors. We present and demonstrate several new results. In Chapter 5, we extend the previous analysis to the more realistic setting of learning machines with continuous activation functions, providing a necessary and insightful analysis of the case of continuous errors. The final discussions and conclusions are presented in Chapter 6, ending with the outline of future work. Finally, this Thesis ends with a few appendices covering some topics taken off from the main track of the text for the sake of reading simplicity. The data sets used in this work are described in the last appendix.
Chapter 2
Basic Concepts This chapter is devoted to introducing basic concepts and notation needed throughout the following chapters. We start with the fundamental notions of statistical decision theory and progress to presenting an important theorem concerning optimal single classification splits and the notion of classifier problem. Both the theorem and the notion were introduced by us elsewhere [102, 103]. The problem of learning from data is also introduced and linked to the previous theory. We also discuss probability density estimation, artificial neural networks and introduce entropy and its related concepts.
9
10
2.1
CHAPTER 2. BASIC CONCEPTS
Statistical Decision Theory vs.
Learning from
Data 2.1.1
Optimal Decision Rules: Minimum Error Probability and Minimum Risk
Statistical (or Bayesian) decision theory is a formal way of describing a classification problem using its probabilistic nature and is used to derive optimal decision rules. Consider, for simplicity, a two-class problem, that is, the problem of assigning a given pattern described by a feature vector x to one of two classes, C1 or C2 . There is an a priori probability of x being from C1 , denoted P (C1 ), as well as an a priori probability of being from C2 , denoted P (C2 ), such that P (C1 ) + P (C2 ) = 1. For example, if we would like to classify a given car from an hotel parking lot as being expensive (e.g. above 20,000 euros) or cheap, we expect, without prior looking, that it is more probable to find an expensive one in a five star hotel! So, a priori probabilities can be seen as “predisposition” probabilities. In this sense, we could easily establish a simple, although inefficient, classification/decision rule: “assign x to: C1 if P (C1 ) > P (C2 ); C2 otherwise”. This is in fact an inefficient rule because it does not depend on the particular value of x. Moreover, any other x would always be classified in the same class. A smarter idea is to observe x and then make a decision based on its probabilistic properties. Thus, what we are looking for is a posteriori probabilities P (C1 |x) or P (C2 |x), the probabilities that a given/observed x belongs to class C1 or C2 , respectively. Using Bayes formula one can write P (Ci |x) =
P (Ci )p(x|Ci ) , p(x)
i = 1, 2
(2.1)
where p(x|Ci ) is the class-conditional probability density function (pdf) for class Ci and p(x) is the overall or mixture density function of x which acts simply
2.1. STAT. DECISION THEORY VS. LEARNING FROM DATA
11
as a scaling factor to ensure that posterior probabilities sum up to 1. Looking at (2.1) one can interpret the posterior probabilities as a modification of the prior probabilities resulting from the observation of x, as if extra knowledge was added. Hence, the rule can be updated to: “assign x to: C1 if P (C1 |x) > P (C2 |x); C2 otherwise”. But is this an optimal rule? The answer is positive. It is possible to demonstrate that using this rule we are taking decisions that minimize the average probability of error [18, 34]. In fact, for each x being classified with the above rule, the probability of error is given by P (error|x) = min{P (C1 |x), P (C2 |x)} and the average probability of error is Z P (error) = P (error|x)p(x)dx,
(2.2)
(2.3)
which is minimized if P (error|x) is chosen as in (2.2). The above rule is usually known as the Bayes decision rule or Bayes test for minimum probability of error 1 . This is illustrated in Figure 2.1 for the single x-feature case. The shadowed area in Figure 2.1a represents the probability of error P e divided into the probabilities of error for each class, P e1 and P e2 . Notice that moving the decision border from the abcissa corresponding to the intersection implies an increase of P e. Thus to obtain a min P e rule one should assign x to Ci whenever P (Ci )p(x|Ci ) is maximum. This simple but elegant theory can be extended and generalized in several ways, encompassing the multi-class problem as well as the fact that some classification errors may be more costly than others (for example, in cancer diagnosis, there is a higher cost in assigning “non-cancer” to a “cancer” case, than the reversal). In the first case, the extension is straightforward. For a C-class classification problem the rule becomes Assign x to Ck if P (Ck |x) = max P (Ci |x). i=1,...,C
1
From now on we denote minimum probability of error as min P e.
(2.4)
12
CHAPTER 2. BASIC CONCEPTS
P(C )p(x|C ) 2
P(C )p(x|C ) 1
P(C )p(x|C )
2
2
2
1
P(C )p(x|C ) 1
1
Pe
Pe
1
2
R
R
R
2
1
1
(a)
R
2
R1
(b)
Figure 2.1: Examples of two-class problems. At the left, a single split is sufficient to solve the problem. The shadowed areas represent the error probabilities for each class. At the right, the problem needs two splits to be optimally solved. A classifier based on the above rule is usually known as a maximum a posteriori (MAP) classifier. In the second case, to each decision we associate a cost or loss. If λij represents the loss of deciding Ci when it should be Cj , the average loss (also known as risk ) of deciding Ci in the presence of x is given by R(Ci |x) =
C X j=1
λij P (Cj |x).
(2.5)
The associated decision rule becomes Assign x to Ck if R(Ck |x) = min R(Ci |x), i=1,...,C
(2.6)
where mini=1,...,C R(Ci |x) is designated as Bayes risk. This rule is proven to achieve the best performance possible [18]. Note that the min P e decision rule is retrieved if we set λij = 1 − δij (where δij is Kronecker’s delta). In subsequent chapters we will devote our attention to the min P e rule. In particular, we study whether a given learning machine is capable of performing in such a way that min P e is attainable. A classifier or a classification problem can be formulated in a different but equivalent way by using discriminant functions. These are functions gi (x), i = 1, . . . , C, such that the decision rule is defined as follows:
13
2.1. STAT. DECISION THEORY VS. LEARNING FROM DATA
“assign x to Ci if gi (x) > gj (x), ∀j 6= i”. Geometrically, discriminant functions define in the feature space a set of C decision regions R1 , . . . , RC associated with each class. These regions are separated by decision boundaries defined by gi (x) = gj (x). In Figure 2.1a the x-space is divided into two decision regions R1 and R2 such that we assign Ci whenever x ∈ Ri , i = 1, 2. Moreover, each region is not necessarily contiguous as Figure 2.1b illustrates. Of course, a single split is not sufficient in this case to achieve min P e. Nevertheless, the optimal single split is always in an intersection of the posterior probabilities, as shown in the following theorem: Theorem 1. (Lu´ıs Silva et al. [102]) Consider a two-class problem in a univariate x-space and the classifying function family represented by a single split. If the class-conditional density functions are continuous, then the min P e split either occurs at an intersection of P (C1 )p(x|C1 ) with P (C2 )p(x|C2 ) or at +∞ or −∞. Proof. For notation simplicity, let us consider q = P (C1 ), p = P (C2 ) and fi = p(x|Ci ), i = 1, 2. First, assume that there is no intersection of qf1 with pf2 (Figure 2.2a). Then, min P e = min(p, q) ≤ 1/2 occurs at +∞ or −∞. For intersecting posterior densities, one has to distinguish two cases. First assume that, for δ > 0 pf2 (x) < qf1 (x)
x ∈ [x0 − δ, x0 ] and
pf2 (x) > qf1 (x)
x ∈ [x0 , x0 + δ], (2.7)
where x0 is an intersection point (Figure 2.2b). The probabilities of error at x0 and x0 − δ are P e(x0 ) = p P e(x0 − δ) = p
�Z Z
x0 −δ
−∞ x0 −δ
−∞
f2 (t)dt +
f2 (t)dt + q
Z
x0
�
f2 (t)dt + q
x0 −δ �Z x0
x0 −δ
f1 (t)dt +
Z
Z
+∞
x0 +∞
f1 (t)dt, (2.8) �
f1 (t)dt . (2.9) x0
14
CHAPTER 2. BASIC CONCEPTS
pf
qf
2
1
qf
pf
1
2
x ŦG x0
x Ŧ G x0
(b)
(c)
0
(a)
0
Figure 2.2: Possible no-intersection or intersection situations in a two-class problem with continuous class-conditional density functions. The light shadowed areas in (b) and (c) represent P e(x0 ) where x0 is the abcissa of the intersection point. The dark shadowed area in (b) represents the amount of error probability added to P e(x0 ) when the splitting point is deviated to x0 − δ. The dashed area in (c) is the amount of error probability subtracted from P e(x0 ) when the splitting point is deviated to x0 − δ. Hence, P e(x0 ) − P e(x0 − δ) = p
Z
x0
x0 −δ
f2 (t)dt − q
Z
x0
f1 (t)dt < 0,
(2.10)
x0 −δ
by condition (2.7). Using similar arguments, P e(x0 ) − P e(x0 + δ) < 0. Thus x0 is a minimum of P e(x). Now, suppose that (see Figure 2.2c) pf2 (x) > qf1 (x)
x ∈ [x0 − δ, x0 ] and
pf2 (x) < qf1 (x)
x ∈ [x0 , x0 + δ]. (2.11)
Then x0 is a maximum of P e(x). This can be proven as above or just by noticing that this situation is precisely the same as above but with a relabeling of the classes. For relabeled classes, the probability of error P e(r) (x) is given by (r)
(r)
P e(r) (x) = p(1 − F1 (x)) + qF2 (x) = 1 − [q(1 − F1 (x)) + pF2 (x)] = 1 − P e(x) (2.12)
2.1. STAT. DECISION THEORY VS. LEARNING FROM DATA
15
Thus, P e(r) (x) is just a reflection of P e(x) around 1/2, which means that P e(x) maxima are P e(r) (x) minima and vice-versa. The optimal split is chosen as the minimum up to a relabel. Discriminant functions for min P e can be written in several ways. One that is particularly useful is2 gi (x) = ln p(x|Ci ) + ln P (Ci ).
(2.13)
A particular case arises when the class distributions are (assumed) Gaussian. In this case, the class-conditional pdf’s are written as � � 1 1 T −1 exp − (x − µ ) Σ (x − µ ) , p(x|Ci ) = i i i 2 (2π)d/2 |Σ|1/2
(2.14)
where µi and Σi are the mean vector and covariance matrix for class Ci , respectively. The discriminant functions then become 1 d 1 gi (x) = − (x − µi )T Σ−1 ln 2π − ln |Σi | + ln P (Ci ). i (x − µi ) − 2 2 2
(2.15)
If the classes in comparison have the same covariance, say Σi = Σj = Σ for some i and j then the quadratic terms present in (2.15) can be neglected and the corresponding discriminants can be written as linear functions of x (dropping other unnecessary terms not dependent on i) gi (x) = wiT x + wi ,
(2.16)
with wi = Σ−1 µi and wi = − 12 µTi Σ−1 µi + ln P (Ci ). Clearly, the decision boundary obtained with gi (x) = gj (x) is a hyperplane. On the other hand, if the covariance matrices are different for each class then (2.13) can be written (again dropping unnecessary terms) as gi (x) = xT Wi x + wiT x + wi , 2
(2.17)
Note that the decisions are not affected by applying a monotonically increasing function
to all the discriminants.
16
CHAPTER 2. BASIC CONCEPTS
R
3
R
R2
1
(a)
(b)
Figure 2.3: A three-class problem with bivariate Gaussian distributions. The class-conditionals pdf’s (with equal priors) are represented at the left, while the corresponding decision boundaries are represented at the right. Three decision regions are defined.
for appropriate Wi , wi and wi [18], which is a quadratic function of x. In this case, the decision boundaries are hyperquadrics. Figure 2.3 shows a three-class Gaussian problem having linear and quadratic decision boundaries between the classes.
2.1.2
The Classifier Problem
The theory discussed above can only be used if one knows the distribution of the classes. In this case, the optimal decision rule for each problem could be readily determined. In practice, however, it is not typical to know those distributions and all that is provided is a set of patterns sampled from the situation at hand that we hope to be representative of the underlying distributions. Thus, the problem has to be taken from a different point of view. The solution is to use a mathematical device such as a neural network, with the capability of implementing a sufficiently rich family of decision functions, Φ, for the problem at hand, with the hope that it will be able to reach the min P eΦ for that set by
2.1. STAT. DECISION THEORY VS. LEARNING FROM DATA
17
using an appropriate algorithm capable of extracting the important information from the available data. Recall Figure 1.1 where we illustrate the pattern recognition problem. The statistical nature of the relation between the features and the target variable T (which describes the set of classes Ω = {C}), can be represented, assuming it exists, by a joint distribution F (x, t). We now have a learning machine, designated as a classifier, depending on some parameters (parameter set W = {w}) which performs a mapping Y = ϕw (X) where X and Y are the input and output spaces, respectively. The objective is to train the machine such as to model F (x, t). So, as stated by Vapnik [109], “the learning process is a process of choosing an appropriate function from a given set of functions”. Following this author, the classifier can choose one of two ways. Either by “imitating the supervisor’s operator” that is, by choosing the function that gives the best predictions for the environment provided by the data at hand or by “identifying the supervisor’s operator” which is more general and usually more difficult. We follow the former approach. The process of choosing an adequate function by the learning machine is performed by some algorithm in order to minimize a risk functional on the parameter set W of the function family Φ = {ϕw } implemented by the classifier, which is often written for continuous data distributions as min RΦ = min W
W
X Ω
P (C)
Z
X,T
E(t, y)dF (x, t|C)
with y = ϕw (x),
(2.18)
where F (x, t|C) ≡ FX,T (x, t|C) is a joint cumulative distribution and the P (C) are prior probabilities. Hence, we choose a function from Φ that minimizes the expected loss (or cost) for the particular function E(·) used3 . This target-
output distance, designated cost function4 , can be chosen in various ways. For instance, for MSE, E = (t − y)2 and for cross-entropy and two-class problems
with Y ∈ [0, 1] and T ∈ {0, 1}, E = t ln y + (1 − t) ln(1 − y). Minkowski and 3 4
Rigorously we should write E (w). Also designated as loss or error function.
18
CHAPTER 2. BASIC CONCEPTS
exponentially weighted distances have also been proposed. The risk functional for MEE is written not as a distance functional but instead as a functional of the error E = T − Y pdf f (e) ≡ fE (e) (assuming it R exists), namely as - E ln f (e)dF (e) for Shannon’s entropy of the error, or as R 1 α−1 dF (e) for R´ enyi’s entropy. Thus, the MEE functional reflects 1−α ln E f (e)
the whole error pdf, whereas the popular MSE functional only reflects the error variance.
The main problem in data classification called from now on the classifier problem is the possibility of attaining the minimum probability of error afforded by the machine architecture, that is, by the family of functions Φ, for some w∗ , the so-called optimal solution. Let us denote the minimum probability of error, achievable in Φ by minW P eΦ 5 . From now on whenever we talk of optimal solution, w∗ , we always mean optimal in the minW P eΦ sense. The classifier problem corresponds to the following question: does minW RΦ imply minW P eΦ ? (Note that minW P eΦ corresponds in the distance functional to setting E(t, y) = {0, if t = y ; 1, otherwise}; however we are only interested in risk functionals with continuous integrands, for which efficient optimization algorithms exist.) For instance, if hypothetically minW RΦ does not lead to minW P eΦ , one has to conclude that a risk functional is being used which fails to adequately take into account the whole Φ set complexity. One should then turn to another risk functional. It is obvious that (2.18) cannot be minimized by itself because the distributions are unknown. Instead, one minimizes an empirical version, the empirical risk functional (Vapnik [109] provides an extensive discussion on the conditions for consistency of the empirical risk minimization principle). Given some training data in the form (x1 , t1 ), . . . , (xN , tN ) one must
5
For some architectures minW P eΦ may correspond to the optimal Bayes error. However,
this issue will not occupy us here.
2.2. THE PDF ESTIMATION PROBLEM
minimize
19
N 1 X ˆ RΦ = E(ti , yi ). N
(2.19)
N X ˆΦ = 1 (ti − yi )2 . R N
(2.20)
i=1
As an example, if one uses the MSE cost function, the empirical risk functional becomes
i=1
In the following chapters we propose some new cost functions and study with detail entropy-based costs in the framework of the classifier problem.
2.2
The PDF Estimation Problem
The pattern recognition problem can be readily solved if the class-conditional pdf’s are known. Even if not completely known, as for example by assuming Gaussian classes but with unknown parameters, a simple estimation of the parameters can solve our problem. In general, these approaches are not possible (in the former case) or are quite restrictive (in the latter case). Another alternative could be to replace the true class-conditionals by accurate estimates. In fact, as noticed by Devroye et al. [16], if one computes estimates pˆ(x|Ci ) and Pˆ (Ci ) and use the “estimated” rule “assign x to: C1 if Pˆ (C1 )ˆ p(x|C1 ) > Pˆ (C2 )ˆ p(x|C2 ); C2 otherwise” the error probability is no more than 2 Z X i=1
|P (Ci )p(x|Ci ) − Pˆ (Ci )ˆ p(x|Ci )|dx
(2.21)
from the optimal (the min P e), which is obtained with the non-estimated rule (the min P e rule (2.4)). So, if good estimates are provided, the estimated rule can be made almost optimal. However, density estimation suffers from the well known curse of dimensionality [10], which in this case amounts to the need of a huge amount of data to construct high-dimensional accurate estimates6 (and 6
Example: sampling density is proportional to N 1/p , where p is the dimension of the input
space and N is the sample size [43].
20
CHAPTER 2. BASIC CONCEPTS
as we know, most real problems are high-dimensional). Our interest in density estimation does not come from the need to directly estimate the class-conditionals but from the use in MEE of a risk functional dependent on the density f (e) of the error E = T − Y . It is obvious that f (e) is not known in general and has to be estimated from the available data. Thus, the problem can be stated as follows: From a set {xi }i=1,...,N of i.i.d samples of a random variable X with unknown density f (x), compute an estimate fˆ(x) with asymptotic convergence properties. We can consider two main approaches to solve this problem: parametric density estimation and non-parametric density estimation. For the former, a model is assumed for f (x) and the data is simply used to estimate the parameters intrinsic to f (x). As an example, we could assume a Gaussian model and obtain the maximum likelihood estimates for µ and σ 2 from the data, N 1 X xi , µ ˆ= N i=1
N 1 X σ ˆ = (xi − µ ˆ)2 N 2
(2.22)
i=1
and the density estimator would be written as 1 1 exp − fˆ(x) = √ 2 2πˆ σ
�
x−µ ˆ σ ˆ
�2 !
.
(2.23)
Note however that parametric density estimation is very restrictive, because it assumes a predefined model for the data distribution without knowing whether or not the assumption holds true. Also, in our previous example we are assuming a symmetric distribution which is surely not the general case. Thus, nonparametric density estimation is usually preferred because it does not assume any particular model and all the information is extracted from the data (as stated by Silverman [105], the data will be allowed to speak for themselves). Moreover, with a model assumption we would loose the main advantage of the
21
2.2. THE PDF ESTIMATION PROBLEM
MEE approach, because we would not be allowed to constrain all the moments of the error distribution.
2.2.1
Histogram-based Estimators
The histogram is known as the oldest method for density estimation. Its first use is dated from 1661 [108]. We first notice that a histogram estimates a truncated version of a pdf f (x) on an interval [a, b] (usually a = mini xi and b = maxi xi ). The interval [a, b] is partitioned into m bins defined by the intervals Tj = [tj , tj+1 [ for j = 0, . . . , m − 1, such that t0 = a and tm = b. The bins have width l(Tj ) = tj+1 − tj and need not be equally spaced. For each bin we count the P number of samples that fall on it by qj = N i=1 ITj (xi ) (IA (x) is the indicator
function). The histogram is built by assigning to each bin a height proportional to the probability; normalizing by the bin width to have a total area of 1 we get the histogram-based density estimate qj /N l(T ) j fˆH (x) = qm−1 /N l(Tm−1 ) 0
x ∈ Tj ; x = b;
.
(2.24)
x∈ / [a, b]
This estimator has several interesting properties. First, it is a maximum likelihood estimator within all estimators that assign values to the Tj intervals. Also,
for f bounded and continuously differentiable up to order three (except at the endpoints of [a, b]), if we consider l(Tj ) = 2hN (equal bin width), N → ∞ and
hN → 0 such that N hN → ∞, for x ∈ [a, b], then fˆH (x) is a consistent estimator for f (x), that is
7
7
�� �2 � � � fˆH (x) − f (x) M SE fˆH (x) = E → 0.
(2.25)
Condition N hN → ∞ is used to guarantee that N converges more rapidly to ∞ than hN
to 0. These two parameters must be related in such a way that, when N grows, it must grow faster than the decreasing of hN .
22
CHAPTER 2. BASIC CONCEPTS
This result, stated and proved in [108], leads to other results mainly in terms of rate of convergence of the histogram estimator. More precisely, if we choose hN =
�
f (x′ ) 4(f ′ (x′ ))2
�1/3
N −1/3 ,
(2.26)
where x′ is the midpoint of the interval containing x, we obtain convergence throughout the k-th interval of order N −2/3 . An extension of the previous method was proposed by Rosenblatt [88]. In this approach, the interval is shifted and centered at the point of interest, that is, # of sample points in ]x − hN , x + hN ] . fˆR (x) = 2N hN
(2.27)
This is also a consistent estimator but with a higher rate of convergence. In fact, by choosing hN =
�
9f (x) 2(f ′′ (x))2
�1/5
N −1/5 ,
(2.28)
one achieves a rate of N −4/5 , higher than the N −2/3 for the fixed histogram estimator. This shifted histogram estimator (also called naive estimator in [105]) can also be written as a sum of weight functions centered at the point of interest
� � N X x − x 1 i fˆR (x) = z , N hN hN
(2.29)
i=1
where z is defined as z(u) =
1/2, 0,
|u| < 1
.
(2.30)
otherwise
A major drawback of histogram-like estimators is the discontinuity characteristic of the estimated function which can raise several problems mainly if the estimation procedure is to be taken as an intermediate step of another procedure or if derivatives are to be computed. In this sense, the more general kernel density estimators developed in the late 1950’s is the sensible choice. These are the topic of the next section.
23
2.2. THE PDF ESTIMATION PROBLEM
2.2.2
Kernel Density Estimators
In 1957, Parzen [80] proposed a generalization of the shifted histogram density estimate (2.29) by using a kernel function K with the following properties 1. supR |K| < ∞ (boundedness) 2.
R
R |K|
< ∞ (K ∈ L1 )
3. limx→∞ |xK(x)| = 0 (K decreases faster than 1/x) 4. K(x) ≥ 0 and
R
RK
= 1.
Note that the above conditions make usual probability density functions good choices for kernel functions. The estimate of f (x) can be obtained by the convolution between the kernel and the (derivative of) empirical distribution FN fˆ(x) =
Z
1 K hN
�
x−y hN
�
� � N x − xi 1 X K dFN (y) = . N hN hN
(2.31)
i=1
This estimator can be proved to be unbiased and consistent if hN → 0 and N hN → ∞ as N → ∞ [80, 108], the same conditions as for the histogram-based estimators. Basically this means that we can recover f (x) if we decrease hN in the presence of an increasing number of samples; however, the rate of increase in N must be greater than the rate of decrease in hN . It is interesting to note that if the kernel function is an even function8 the mean and variance of fˆ(x) will (almost) recover the sample estimates of mean and variance µ ˆ= 2
σ ˆ = 8
N 1 X xi = x ¯, N
Z
xfˆ(x)dx =
Z
(x − µ ˆ) fˆ(x)dx = s2 + h2N
(2.32)
i=1
2
Parzen designated even kernels as weighting functions.
Z
x2 K(x)dx.
(2.33)
24
CHAPTER 2. BASIC CONCEPTS 0.5
0.5
0.5
f(x)
0 Ŧ3
0
3
0 Ŧ3
0
3
0 Ŧ3
0
3
0
4
(a)
0.5
0.5
0.5
f(x)
0 Ŧ4
0
4
0 Ŧ4
0
4
0 Ŧ4
x (b)
Figure 2.4: From left to right we compare fˆH (x), fˆR (x) and fˆ(x) respectively. The dashed line is the true density (Gaussian). In the top figures, N = 20 (random points), m = 5 and hN = 0.3, while at the bottom figures N = 2000, m = 30 and hN = 0.3.
Figure 2.4 shows a comparison between the three methods presented. It is obvious that the kernel density estimate is the best choice: it is smoother and provides a better estimate even for a low number of available data. In what concerns the rate of convergence of these kernel-based estimators, we get an order of N −2r/(2r+1) , where r is the so-called characteristic exponent of the Fourier transform k(u) of the kernel K(x), that is, the positive number such that 1 − k(u) u→0 |u|r
kr = lim
(2.34)
25
2.2. THE PDF ESTIMATION PROBLEM
is nonzero and finite. kr is designated by characteristic coefficient. Choosing a pdf for K requires that r ≤ 2. In particular, for any symmetric density
K such that x2 K(x) ∈ L1 , the characteristic exponent is r = 2 [108]. The Gaussian pdf is an example. Thus, the best one can achieve in terms of rate of convergence is N −4/5 which is also achieved by the shifted histogram-based estimator. However, we stress that one of the advantages of a kernel estimator is its differentiability essential in optimization strategies. We may also obtain an optimal global value for hN by minimizing the integrated mean square error R (IMSE), min (f − fˆ)2 , leading to 1
h∗N = N − 2r+1 α(K)β(f ),
with α(K) =
"
R
K 2 (x) dx
#1/(2r+1)
�2 xr K(x)dx/r! �−1/(2r+1) �Z (r) 2 . |f (x)| dx β(f ) = 2r
R
(2.35)
and
Unfortunately, as f (x) is usually unknown, h∗N can be difficult to obtain due to β(f ). Nevertheless, if f is a Gaussian density one can determine (for r = 2 as discussed above) Z |f ′′ (x)|2 dx ≈ 0.212σ −5 ⇒ β(f ) ≈ 1.3637 ⇒ h∗N ≈ 1.06σn−1/5 .
(2.36)
Note that the choice of hN , called kernel bandwidth or smoothing parameter in the literature, is crucial for density estimation. From (2.33) we see that hN controls the smoothness of the estimate in the following way: taking a large hN results in an oversmoothed estimate that may mask particular characteristics of interest; for a small hN , and if the available data does not increase, the estimate becomes more local (due to the small window of the kernel) and every spurious behavior can be detected (like an overfit to the data) obtaining a high variability estimate. It also depends on the particular shape of f , skewness, kurtosis, modality, etc. This is why the choice of a good hN has drawn so much
26
CHAPTER 2. BASIC CONCEPTS
attention in the literature. Silverman [105] proposed hN = 0.79RN −1/5 for skewed distributions, where R is the interquartile range. He also proposes what he claims as a more general-purpose estimate for hN able to cope with several shape properties of f , by modifying appropriately9 formula (2.36) hN = 0.9 A N −1/5 ,
A = min(σ, R/1.34).
(2.37)
These and other estimators are also extensively discussed in [111]. The authors “classify” bandwidth selectors (methods to estimate hN from the data) as quick and simple and hi-tech. Quick and simple selectors are essentially based on simple formulas dependent on the distribution’s scale (estimated from the data) as is the case of the above Silverman’s proposals and the ones in [54]. On the other hand, hi-tech bandwidth selectors are computationally more demanding procedures that, although more theoretically driven and expected to perform better, may not be appropriate if density estimation is an intermediate step of a bigger procedure. Of course, we could try a simple trial-and-error procedure and visually guess an optimal bandwidth, but for high dimensional distributions this is not a good approach. In conclusion, the bandwidth selection has no unique answer and is not a solved problem. We will discuss it further in a following chapter. The Gaussian kernel is the usually preferred but we could question if this is the best choice. In fact, IMSE is minimized for h∗N above if the Epanechnikov kernel is used KE (x) =
3 √ 4 5
0,
� 1 − 51 x2 , |x| ≤ 5
.
(2.38)
otherwise
So, in theory, this is the best kernel function to use. In this sense, Silverman defines an efficiency measure relative to this kernel (see [105] for details). Table 2.1 shows the efficiency of some kernels. 9
By using heuristics to account for skewness and multimodality.
27
2.3. ARTIFICIAL NEURAL NETWORKS
Table 2.1: Efficiency values (as defined in [105]) of several kernels. Kernel
K(x)
Efficiency
Epanechnikov
formula 2.38
1
Biweight
15 16 (1
− x ) , |x| < 1
≈ 0.9939
exp−x
≈ 0.9512
2 2 2
/2
Gaussian
√1 2π
Rectangular
1/2, |x| < 1
≈ 0.9295
Although the Epanechnikov kernel is seen as the best choice, it has a major drawback: it is not differentiable. This brings about further problems when using backpropagation for neural network training. The algorithm uses the derivatives of the cost function to update the parameters of the machine and thus the need for a differentiable kernel. Moreover, and as we will see in section 2.4.3.2, the choice of a Gaussian kernel allows important simplifications when manipulating R´enyi’s quadratic entropy. To end this section we just refer that density estimation may also be defined and studied within the framework presented by Vapnik [109] on the minimization of a risk functional.
2.3
Artificial Neural Networks
We devote our attention to a special type of learning machine based on simple processing units: the artificial neural network (ANN). We start by presenting the most simple type of ANN, the perceptron, that will be studied in chapters 4 and 5 in the MEE framework and follow to its generalization, the multilayer perceptron, used in chapter 3.
28
2.3.1
CHAPTER 2. BASIC CONCEPTS
The Perceptron
The perceptron is the most simple type of ANN and is based on a single unit or neuron. The working operation of the perceptron is based on the model proposed by McCulloch and Pitts [76]: it takes a vector of real-valued inputs, produces a linear combination and performs a binary decision. More precisely, given the inputs x1 , . . . , xd the output y(x1 , . . . , xd ) becomes
y(x1 , . . . , xd ) =
1,
Pd
i=1 wi xi
+ w0 > 0
,
(2.39)
−1, Pd
i=1 wi xi + w0 ≤ 0
where each wi ∈ R, i = 1, 2 . . . , d, determines the contribution of input xi to the output of the perceptron and w0 ∈ R is designated as bias. These parameters are called weights. If we take x0 = 1 and define the extended input vector ˜ = [x1 , . . . , xd , 1]T and the weight vector w = [w1 , . . . , wd , w0 ]T the perceptron x output can be written as ˜ ), y(x1 , . . . , xd ) = ϕ(wT x
(2.40)
where ϕ is the sign function
ϕ(s) =
1,
−1,
s>0
.
(2.41)
s≤0
Note that we could also use equivalently the Heaviside function with codomain in [0, 1]. These functions, designated as activation functions, have however the disadvantage of not being continuous, bringing difficulties when computing derivatives. It is preferable, namely in more complex problems, to use a continuous monotonically increasing function to make a continuous and differentiable transition between the saturated parts (where ϕ(s) = 1 or ϕ(s) = −1), allowing a vast panoply of optimization algorithms for continuous objective functions to be used. Hence, its popular use. The following are the most used in neural
29
2.3. ARTIFICIAL NEURAL NETWORKS
x1
x2
w1 w2
wd xd
M ( wT ~x )
y
w0 1
Figure 2.5: Graphical representation of a single perceptron. networks and are respectively the sigmoid and hyperbolic tangent activation functions ϕ(s) =
1 1 + e−αs
α > 0,
ϕ(s) = β tanh(αs)
α, β > 0,
(2.42) (2.43)
with codomain [0, 1] and [−β, β], respectively. The parameters α and β control the steepness and amplitude of the activation function. Usual values are α = β = 1. The perceptron can be represented as an oriented graph, as illustrated in Figure 2.5. Representational ability of perceptrons Let us consider, for simplicity, a two-class problem. One can attach a decision ˜ ) = −1; C2 to the output of the perceptron in (2.39): “assign x to: C1 if y(wT x otherwise”. In this sense, the perceptron defines a discriminant hyperplane on the space defined by the variables x1 , . . . , xd . Moreover, the x-space is divided into two decision regions corresponding to each side of the hyperplane: ˜ ≤ 0}. Of course, a zero ˜ > 0} and R2 = {x ∈ Rd : wT x R1 = {x ∈ Rd : wT x misclassification error is only achieved with linearly separable sets of examples, i.e, those where the two classes are completely separated by a hyperplane. For example, the perceptron can represent many boolean functions like AND or
30
CHAPTER 2. BASIC CONCEPTS
OR as well as their negations. However, boolean functions like XOR cannot be represented by a perceptron because they do not correspond to a set of linearly separable examples. Minsky and Papert [77] famous work brought about this and several other limitations of perceptrons. Nevertheless, the ability to represent the simpler boolean functions is important because every boolean function can be represented by some network of perceptrons only two levels deep (multilayer perceptron with a single hidden layer) [78]. Note that an equivalent decision rule can be attached if the activations are continuous squashing functions. In this case, there is a need to set a threshold that depends on the particular function. For example, using the hyperbolic tangent for α = β = 1 ˜ ) ≤ 0; C2 otherwise”. we set a threshold at zero10 : “assign x to: C1 if y(wT x Perceptron learning The idea behind the perceptron learning is to find an optimal weight vector w that causes the network to output the correct class for each training example. A simple algorithm used to adjust the perceptron weights is the perceptron training rule [87] that revises the weight wi according to wi = wi + ∆wi ,
(2.44)
∆wi = η(t − y)xi . where t is the target of the actual training example, y is the output of the perceptron as defined in (2.39) and η is a positive constant called learning rate. The latter controls the rate of change of the weights at each step. Note that the weight adjustments are only made when t 6= y and in this case we have an adjustment proportional to the corresponding input. The famous perceptron convergence theorem shows that this training rule is capable of finding a solution in a finite number of iterations, provided the training examples are linearly separated [11, 18, 45, 87].
Unfortunately this training rule is not assured
to converge in the case where the two classes are not linearly separable. To 10
For the sigmoid function it would be set at 0.5.
2.3. ARTIFICIAL NEURAL NETWORKS
31
overcome this problem, another training rule called delta rule is used to achieve the best fit approximation to the input-output mapping of the training examples. So, although no hyperplane exists that completely separates the two classes (with 100% correct classification), the delta rule converges to a hyperplane that minimizes some measure E(w) (like the ones discussed before). The derivation of the delta rule is quite simple and basically uses gradient descent to find the optimal set of weights. The need for derivatives requires the use of continuous activation functions. Starting with an initial arbitrary weight vector, the delta rule uses the gradient descent search to adjust the weights in the direction that produces the largest steepest descent along the error surface (towards the minimum), or in other words, in the opposite direction of the gradient vector. w = w + ∆w,
(2.45)
∆w = −η∇E(w). This procedure is proven to converge at least to a local minimum of the error surface, whether the training examples are linearly separable or not, provided that η is small. The learning rate η controls the amount of change in each weight. If η is too large, the algorithm may overpass the minimum and convergence may not be achieved; if η is too small, convergence may be too slow.
2.3.2
Feed-forward Multilayer Perceptrons
Feed-forward multilayer perceptrons (MLP) are natural extensions of the single perceptron to network architectures with more than one layer of units or neurons. These networks consist of an input layer constituted by a set of sensory units or source nodes (input variables), one or more hidden layers (with one or more neurons) and an output layer with one or more neurons. The network is used in a simple manner: each pattern is propagated in a forward direction on a layer-by-layer basis. Figure 2.6 shows the architectural graph of a MLP
32
CHAPTER 2. BASIC CONCEPTS
x1
w11(1)
w11( 2)
(1) 12
w
y1
x2 yC
xd
( 2) wnC (1) wdn
Figure 2.6: Graph representation of a feed-forward MLP with d inputs, n hidden neurons in a single hidden layer and C outputs. with one hidden layer and an output layer. It presents the model of a fully connected network where each neuron is connected to all the neurons in the previous layer (or input nodes in case of the first hidden layer). The left to right arrow direction shows the way every pattern is propagated through to obtain the network’s output. For classification problems we consider nonlinear activation functions, which means that, mathematically speaking, an MLP is a parameterized composition of nonlinear functions. For example, the k-th MLP output of Figure 2.6 can be written as ! d N X X (1) (1) (2) (2) yk = ϕ w xi + w w ϕ + w . ij
jk
j=1
0j
0k
(2.46)
i=1
The parameters may be iteratively determined using the well known backpropagation learning algorithm (BP) [89, 112], which is just a generalization of the delta rule discussed before. Several other optimization procedures exist, like conjugate gradient and Levenberg-Marquardt among others, but we will not consider them here (for an extensive discussion of other procedures see [11, 45]). BP consists in two passes through the network. The first, in a forward direction, propagates a pattern from the input to the output layer, producing the response
2.3. ARTIFICIAL NEURAL NETWORKS
33
of the network. In practice, each neuron in the network behaves like the single perceptron with a smooth nonlinear activation function applied to the linear combination. The difference between the actual output of the network and the desired one, produces an error signal that is propagated backward through the network; the network weights are adjusted in accordance with an errorcorrection rule (based on the error signal obtained), in a way that the output becomes closer to the desired response. This is the second pass. Each hidden neuron or output neuron is designed to perform two computations
1. Apply the nonlinear activation function to the linear combination obtained from the inputs to that neuron and weights connected to it. This is the forward pass. 2. Compute an estimate of the gradient vector (in terms of local gradients of the error surface with respect to the weights connected to the inputs of that neuron) used to make weight adjustment. This is needed for the backward pass.
Basically, the computation of the weight updates is performed using the chain rule of differentiation (recall that an MLP is just a parameterized composition of functions) ∂E (l) ∂wij
=
∂E ∂ej ∂yj . ∂ej ∂yj ∂w(l) ij
(2.47)
In the above expression, ∂E/∂ej depends on the particular cost function used, (l)
∂ej /∂yj = −1 and ∂yj /∂wij depends on the location of the weight (if it belongs to the output or an hidden layer). A complete description of the BP algorithm can be found in [11, 45, 78]. Representational ability of MLP’s The representational ability of an MLP depends mainly on the type of inputs and activation functions used. For binary data and step activation functions for
34
CHAPTER 2. BASIC CONCEPTS
all units, a two-layer network is capable of representing any boolean function [78]. However if the input data is continuous-valued one can have convex decision regions for a two-layer MLP or even arbitrary regions (non-convex and disjoint) if a three-layer MLP is used [11, 70]. In all cases, the decision boundaries are piecewise linear. The representational ability of MLP’s is increased if sigmoidlike activation functions are used. Several well known results concerning three and two layer MLP’s appeared in the literature. Lapedes and Farber [65] proved that any smooth mapping could be approximated with arbitrary accuracy with a three-layer network. However, the most important result states that a twolayer MLP can approximate arbitrarily well any functional continuous mapping from a finite-dimensional space to another, provided the number of hidden units is sufficient [15, 48]. This is an important result as we can conclude that ANN classifiers (with sigmoid-like activations functions) provide universal non-linear discriminant functions. In conclusion and comparing to the single perceptron, the class of functions that an MLP can generate is much richer. Some issues about BP learning The BP algorithm is a powerful algorithm capable of implementing an approximation to gradient descent search through the space of possible network weights. However, because the error surface may contain several local minima, backpropagation is only assured to converge to a local minimum of E. Fortunately, in practice, having a minimum with respect to some weight doesn’t mean that it is also for the other weights and so, gradient descent can proceed. Some practical guidelines are usually used to overcome (or at least to reduce the effect of) this problem 1. Initial weight values. Initialization is an important issue of MLP training. A suitable choice for the initial conditions can be of extreme importance, not only leading to a good final solution but also to an improvement in the learning speed. Usually, the initial weight values are taken randomly
2.3. ARTIFICIAL NEURAL NETWORKS
35
from a certain distribution with a prespecified mean and standard deviation. Taking small initial weight values causes BP to operate on a very flat area around the origin which is a saddle point [11, 45]. Otherwise, large initial values could leave the neurons into saturation. We should take for initial weights (including bias), values from a zero-mean uniform [45] or spherical Gaussian [11] distribution with variance chosen to make the standard deviaton of the linear combinations lie at the transition between linear and saturated parts of the activation function. Both methods are used in our experiments. 2. Learning Rate. The learning rate parameter η controls the rate of convergence (or divergence, in some cases) of the BP algorithm. A smaller η causes smaller weight changes as we can see from (2.45). This causes the trajectory in the weight space smoother and closer to the one computed by the method of steepest descent. Of course in this case we have a slower rate of learning. On the contrary, if η is large, weight changes will be greater and the speed of learning will be increased. The problem is that if η is too large the network may become unstable and convergence isn’t guaranteed. Several methods to choose appropriately the value of η are discussed in the literature, including versions of BP with an adaptive learning rate, or with different learning rates for different weights, among others [5, 53, 72, 98]. In practice, it is known that η should be chosen small and in the interval [0, 1]. A form of adaptive learning rate adopted in our work can be described by the following u η (m−1) , E (m) ≤ E (m−1) (m) , 0 < d < 1 ≤ u. η = d η (m−1) ∧ restart, otherwise
(2.48)
If E does not increase11 from one epoch to another, the algorithm is in 11
We are considering the minimization of the cost function, but a similar rule can be derived
for maximization problems.
36
CHAPTER 2. BASIC CONCEPTS
the right direction, so η is increased by a factor u in order to speedup convergence. However, if η is large enough to increase E, then the algorithm makes a restart step and decreases η by a factor d to ensure that E is being minimized. This restart step is just a return to the weights of the previous epoch. The values of u and d used are 1.2 and 0.2, respectively, as suggested in [90]. 3. Training Mode. There are also some issues concerning the network’s training mode. If sequential mode of training is used (also referred as online or stochastic mode) weight updating is performed after each pattern is presented to the network. With this type of training a caution must be taken: the randomization of the training set. This allows a random presentation of the patterns to the network, preventing some cycling behaviors (like presenting all patterns of class 1, then all patterns of class 2, etc.) that tend to speed down the algorithm or bias the weights estimates. The randomization tends to make the search in weight space stochastic over the learning cycles [45]. In the batch mode of training weight updating is done after one epoch of training examples is presented to the network. The question then is: which method to choose? While sequential mode requires less storage for each weight and has the possibility of escaping from local minima because of the stochastic search in weight space, the batch mode provides an accurate estimate of the gradient vector and is easier to establish theoretical conditions for convergence. Our choice of training mode is dictated by the use of entropy as cost function as we will see later. 4. Activation function. Two examples were already given: the logistic function and hyperbolic tangent function. Which of them is the best? Haykin [45] states that it is preferable to use an antisymmetric activation function (i.e, odd function) because, in general, the learning process is
2.3. ARTIFICIAL NEURAL NETWORKS
37
faster. The output of each neuron is permitted to assume both positive and negative values in intervals of the type [−a, a], whereas in the case of the logistic function, the output is restricted to [0, 1], introducing a source of systematic bias for those neurons beyond the first hidden layer. The hyperbolic tangent function (2.43) is an example of an antisymmetric activation function, and is the one (with α = β = 1) considered in this work. 5. Target encoding. One should clearly distinguish between the set of classes Ω = {Ck }C k=1 and the target variable used to describe it. The latter can be encoded in several ways, depending on the number of classes. It also influences the number of output neurons. Probably the most used encoding scheme is the 1-out-of-C, where C is the number of classes. The number of outputs is made equal to the number of classes and the target vector for class Ck is12 [−1, . . . , −1, 1, −1, . . . , −1] where the single 1 appears in the k-th position. A particular case arises for two-class problems. In this case it is preferable to set a single output unit and set t = −1 for class C1 and t = 1 for class C2 , because otherwise the second output would be performing redundant computations. An important property arises from this encoding: the errors, or more specifically, the differences between the targets and outputs of the network, e = t − y, regarding each class lie in disjoint hypercubes, with the origin as their unique common point. The three-class case is represented in Figure 2.7. 6. Pre-processing of input data. Also important in practice is the normalization of the training set inputs. Zero mean and uncorrelated inputs, covariance equalization of the decorrelated inputs (to allow an approximately equal learning speed of each weight) are among the proposed procedures. Simpler and also effective methods like the normalization of each input to 12
For the hyperbolic tangent activation function.
38
CHAPTER 2. BASIC CONCEPTS
Figure 2.7: Support space (shadowed cubes) for the error distribution in a threeclass problem, e = (e1 , e2 , e3 ). the interval [−1, 1] or the mean and standard deviation normalization given by x ˜i =
xi − x ¯i , si
where x ¯i and si are the mean and standard deviation respectively of input variable xi , are usually used. Our choice falls into the latter form.
2.3.3
Cost functions
Consider an MLP trained using a set of training pairs (xi , ti ), i = . . . , N , where each ti = (t1,i , . . . , tC,i ) is a realization of a variable t = (t1 , . . . , tC ) that describes the class to which xi belongs in an 1-out-of-C coding, with tk ∈ {0, 1} or tk ∈ {−1, 1} for k = 1, . . . , C. Hence, the MLP has an output layer described by a vector y = (y1 , . . . , yC ) that produces for each xi its corresponding output yi = (y1,i , . . . , yC,i ). We now discuss some of the most used cost functions.
2.3. ARTIFICIAL NEURAL NETWORKS
39
Mean square error The mean square error (MSE) function is probably the most common cost function used for MLP training and is expressed as
EM SE
N 1 X = kti − yi k2 . N
(2.49)
i=1
Originally derived for regression problems, the MSE function is obtained by using the principle of maximum likelihood and assuming the independence and Gaussianity of the target data. Specifically, each component tk , k = 1, . . . , C is expressed as tk = hk (x) + ǫk , where hk is a deterministic function and the random (noise) variable ǫk follows a Gaussian distribution with zero mean and variance σ 2 (see [11] for a detailed derivation of EM SE ). Note, however, that the Gaussianity assumption of the target data in classification is not valid, due to its discrete nature (representing discrete class labels). Nevertheless, it can be shown (see below) that when using an 1-out-of-C coding scheme for the targets, the MSE trained outputs of the network approximate the posterior probabilities of the class membership, yk = Pˆ (Ck |x). Cross-entropy The cross-entropy (CE) cost function can also be derived from the maximum likelihood principle. Each component yk , k = 1, . . . , C of the output vector is interpreted as an estimate of the posterior probability that input pattern x belongs to class Ck , yk = Pˆ (Ck |x) associated with a “true” distribution p = (p1 , . . . , pC ) with pk = P (Ck |x), k = 1, . . . , C. Assuming that the classes are mutually exclusive, the true p(t|x), and neural network pw (t|x) probabilistic models for t can be described by the multinomial
40
CHAPTER 2. BASIC CONCEPTS
distributions: p(t|x) = pt11 pt22 . . . ptCC ,
(2.50)
tC pw (t|x) = y1t1 y2t2 . . . yC .
(2.51)
We would like the model in (2.51) to approximate the true distribution (2.50). This can be achieved by maximum likelihood or using Kulback-Leibler’s divergence, although, as discussed in Appendix A they are equivalent. Thus, from (A.11) and considering a set of observed pairs {(xi , ti )|i = 1, . . . , N } we expect to minimize N X i=1
log
�
p(ti |xi ) pw (ti |xi )
�
=
N X
log
i=1
=−
t
t
t
t
1,i C,i p1,i . . . pC,i 1,i C,i y1,i . . . yC,i
N X C X
!
tk,i log (yk,i ) +
i=1 k=1
N X C X
tk,i log (pk,i ) .
(2.52)
i=1 k=1
Note that, as the values pk,i = P (Ck |xi ) are unknown, (2.52) cannot be used as an error function. However, the pk,i do not depend on the parameters w of the MLP which means that the minimization of (2.52) is equivalent to the minimization of ECE = −
N X C X
tk,i log (yk,i ) .
(2.53)
i=1 k=1
Expression (2.53) is known in the literature as the cross-entropy cost function. For the two-class case we only need one output such that y = Pˆ (C1 |x) (while 1 − y = Pˆ (C2 |x)) and the Bernoulli distribution is used for p(t|x) and pw (t|x). A word of caution regarding cross-entropy The designation cross-entropy associated to expression (2.53) may cause some P confusion. Despite the similarities between (2.53) and − x p(x) log q(x), the
cross-entropy between two discrete distributions represented by probability mass functions p and q, one must note that the tk,i , or more precisely ti , are not probabilities (but are in fact random vectors with multinomial distribution). The role of p(x) in cross-entropy is played by the unknown p(t|x) as defined
2.3. ARTIFICIAL NEURAL NETWORKS
above.
41
Since it is not dependent on the network’s parameters, it is of no
consequence for the minimization process, and thus, can be disregarded. Of course, there may be the tendency to “interpret” the tk,i as P (Ck |xi ) and some literature is misleading in that sense. However this is incorrect since as tk,i ∈ {0, 1} (it could be also tk,i ∈ {−1, 1} by a linear mapping) this would mean that a pattern would always be correctly classified! Briefly, the tk,i do not form a valid probability distribution. In fact, the tk,i in (2.53) are just acting as switches. When a particular tk,i = 1 (which means that xi belongs to class Ck ), then yk,i must be maximum and thus we just minimize − log(yk,i ) (all the other tj,i = 0, j 6= k). Mean square error or cross-entropy From the above discussion it seems natural to choose the cross-entropy cost function to train neural network classifiers, because when interpreting the outputs as probabilities this is the optimal solution (in a maximum likelihood sense). In fact, ECE takes into account the binary characteristic of the targets. Several authors have studied the conditions that the outputs of a neural network must satisfy in order to use them as estimators of the posterior probabilities. In [35, 86] it is shown that for an 1-out-of-C coding scheme, with large N and a number of samples in each class that reflects the prior probabilities, networks trained with MSE provide outputs that are approximations to posterior probabilities. These authors also derived ECE from the maximum likelihood or maximum mutual information principles and have arrived to the same conclusions.
Hampshire and Pearlmutter [49] go further and derive a general
condition that any cost function must satisfy so that yk = Pˆ (Ck |x). They assume independence of the target components tk and furthermore that the cost function is written as a distance functional between outputs and targets
E=
XX i
k
f (|yk,i − tk,i |).
42
CHAPTER 2. BASIC CONCEPTS
Given these conditions, f must satisfy 1−y f ′ (1 − y) = . ′ f (y) y
(2.54)
It can easily be shown that EM SE satisfies this condition, while ECE as in (2.53) does not (there is a different expression for ECE with independent targets, that satisfies (2.54) [7, 35, 47, 49, 106]). Note that the assumption of independence between target variables to derive (2.54) is not present in the derivation of (2.53), because when using the multinomial distribution we are assuming dependence (in the form of mutually exclusive classes). There are other reasons to choose ECE . Several authors reported marked reductions on convergence rates and density of local minima [75, 106] due to the characteristic steepness of ECE . In fact, it is easy to see that slight changes on the output of the network have more effect when using ECE than EM SE , because cancelations in the error gradients generate high error gradients for outputs very distant from their targets. As a function of the absolute errors, EM SE tends to produce large relative errors for small output values. As a function of the relative errors, ECE is expected to estimate more accurately small probabilities [7, 11, 35, 47, 106]. In conclusion, if the training size is large enough and BP doesn’t converge to a local minimum, we can use the MLP output as an approximation of the posterior class probabilities. In this sense, one can regard an MLP as a network of (universal) discriminant functions and derive a decision rule associated with this classifier assign x to Ck if yk (x) > yj (x) ∀j 6= k. Two final notes. First, we observe that in order to interpret the outputs of the network as probabilities one should set the outputs with the logistic activation, to have a range in the interval [0, 1]. Nevertheless, even using the hyperbolic tangent we can always perform a simple mapping to [0, 1] and still interpret outputs as probabilities.
43
2.3. ARTIFICIAL NEURAL NETWORKS
1
1
1.2
8
1.
1.4
1
0.8
6
1.
.2
1
y(x2) 0.6
1
0.8 1.
4
0.6
y2
0.4
6 0.
0. 8
1
1.2
0.5
y(x1) 4
0.2
0.4
0.2
0.6
0.8
1
0.
0 0
0.5 y1
1
Figure 2.8: Contours of EM SE for a C1 pattern. Second, as argued in [50, 71], minimization of the cost function does not necessarily imply misclassification minimization in practice (especially for small data sets or in the presence of local minima). Sub-optimal solutions may occur due to flat regions in weight space. This can be seen with a simple example. Let us assume a two class problem with one output per class. The squared error for a particular pattern x from class C1 can be written as (for t ∈ {0, 1} and y ∈ [0, 1]) EM SE = (t1 − y1 )2 + (t2 − y2 )2 = (1 − y1 )2 + y22 .
(2.55)
The contours of EM SE are shown in Figure 2.8. Using the rule that x belongs to class C1 if y1 (x) > y2 (x) we can see that while x2 is correctly classified, x1 is misclassified. However, x1 has a lower EM SE than x2 , which reinforces the idea that sub-optimal solutions may occur. The same happens with ECE . Thus, minimization of these cost functions does not imply misclassification minimization. For this reason, they were designated non monotonic in [50].
44
CHAPTER 2. BASIC CONCEPTS
In the same work, a monotonic cost function is proposed: classification figures of merit (CFMmono ). This cost function focuses mostly on the reduction of misclassification (this is known as differential learning) and not on achieving an exact convergence to the target values. However, training with CFMmono was found to be much slower than with EM SE or ECE . In Appendix B, we define a simple monotonic function, ESM F , for two-class problems which is used in the experiments of Chapter 3.
2.4
Entropy and its Estimation
It was the fundamental work made during the second world war on radar communication by Claude Shannon that culminated with the publication of the 1948 classic paper A Mathematical Theory of Communication [97]. It was in this paper that the famous source coding theorem was proved and used to define entropy as a measure of information content of a set of messages. This can be considered the starting point of all we know as information theory.
2.4.1
Basic Definitions and Properties
Given a discrete random variable X taking values in a finite set {x1 , . . . , xL } with probabilities pk = P (X = xk ), the Shannon entropy of X is defined as HS (X) = −
L X
pk log pk ,
(2.56)
k=1
where the logarithm base defines the abstract units of measure. Shannon used base 2 and entropy comes in bits. If the natural logarithm is used, entropy is measured in nats (this is the units considered in this work). Entropy can be understood as a measure of uncertainty. When the system is the most “unpredictable” or uncertain, i.e, all values of X are equiprobable (pk = 1/L)
45
2.4. ENTROPY AND ITS ESTIMATION
1 1
p
2
0.5
0 1
1 p2
0.5
0.5 0
(a)
p1
0 0
0.5
p1
1
(b)
Figure 2.9: Surface and contours (filled with a grayscale colormap where brighter colors correspond to higher values) for HS as a function of the probabilities.
then entropy is maximum while if there is some k such that pk = 1 entropy is minimum (the system is totally predictable). Figure 2.9 shows HS (X) and its contours for the case of L = 3. Note that we can take p3 = 1−p1 −p2 and HS (X) comes as a function of two variables. The figure evidenciates two properties of entropy, that is, a continuous and concave function of the probabilities. Entropy has several other interesting properties that we briefly enumerate. For that purpose consider the alternative notation: HS (p1 , . . . , pL ) = HS (X). Then:
1. 0 ≤ HS (X) ≤ log(L). HS (X) = 0 if pk = 1 for some k and pj = 0 ∀j 6= k; HS (X) = log(L) for the equiprobable case, where pk = 1/L, ∀k. 2. HS (p1 , . . . , pL ) = HS (p2 , p1 , . . . , pL ) = . . . . Entropy is independent of the order of the outcomes; entropy is said to be symmetric.
3. The entropy of independent variables is additive, i.e, given two independent random variables X and Y , the entropy of the joint event (X, Y ) is HS (X, Y ) = HS (X) + HS (Y ).
46
CHAPTER 2. BASIC CONCEPTS
Several other entropy-related quantities can be defined in an intuitively manner. Consider a pair of discrete random variables (X, Y ) with joint distribution p(x, y) and marginal distributions p(x) and p(y) for X and Y , respectively. We may define Joint entropy:
HS (X, Y ) = −
Conditional entropy: Mutual information:
XX x
HS (Y |X) = − I(X; Y ) =
p(x, y) log p(x, y),
(2.57)
y
XX x
XX x
p(x, y) log p(y|x),
(2.58)
y
p(x, y) log
y
p(x, y) . p(x)p(y)
(2.59)
Several formulas relate these quantities and HS (X) (for example, mutual information can be written as I(X; Y ) = HS (X) − HS (X|Y )) and have an information theoretic interpretation [13]. In this particular case, mutual information is the reduction in the uncertainty of X due to the knowledge of Y . Another important quantity is the Kullback-Leibler (KL) divergence or relative entropy [63]. This is defined for two probability functions p(x) and q(x) as KL(p||q) =
X x
p(x) log
p(x) q(x)
(2.60)
and can be seen as a distance (not a metric) measure between p(x) and q(x) (see section A.2 of Appendix A for more details). R´enyi designates KL(p||q) as gain of information [84]. From (2.59), one can write I(X; Y ) = KL(p(x, y)||p(x)p(y)) and mutual information comes as a measure of independence between two random variables. It is worth noting (in fact, it will be important later) that most of these quantities can be seen as expected values. For example, entropy and KL divergence come as HS (X) = −E{log p(X)} and KL(p||q) = E{log p(X) q(X) }. Hence, reliable estimates can be obtained if one uses the usual sample mean estimator. Different definitions of entropy can be found in the literature. Examples are Havrda and Charvat’s [44], Alfred R´enyi’s [84, 85] and Kapur’s [58, 59, 60]
47
2.4. ENTROPY AND ITS ESTIMATION
families of entropies (see Kapur’s books for an extensive discussion of several entropy definitions). We pay more attention to R´enyi’s definition given by ! L X 1 α HRα (X) = log α > 0, α 6= 1 (2.61) pk , 1−α k=1
which has a particular relation to Shannon’s definition. In fact, it can be proved that HRα (X) ≥ HS (X) ≥ HRβ (X),
0 < α < 1, β > 1
(2.62)
lim HRα (X) = HS (X)
α→1
Thus, Shannon entropy can be seen as a particular case of R´enyi’s entropies. It is important to emphasize, contrarily to the approach followed here and in many textbooks, that Shannon’s entropy can be deduced from a set of postulates that establish a set of “reasonable” characteristics that an information measure should have. Moreover, it can be proved that HS (X) is the only measure that satisfies all those postulates (see [1, 85] for a detailed discussion). The gain of information (or Kullback-Leibler divergence) is then derived. In [84], HRα (X) is obtained in the opposite way. The gain of information is assumed as a basic concept (based on a set of postulates) and the corresponding measure of information is posteriorly derived. This culminates in the parameterized (by α) family of entropies above. Similar measures are defined for continuous random variables where as usual sums are substituted by integrals. However, this generalization is not completely straightforward. In fact, one can show that for a continuous random variable X, Shannon’s entropy comes as Z HS (X) = − f (x) log f (x) dx − lim log δx, δx→0
where δx is the bin width of a discretization of the range of X and f (x) is the pdf of the random variable X. From the above formula, one sees that the
48
CHAPTER 2. BASIC CONCEPTS
entropy of a continuous random variable is infinitely large, which really makes sense given the fact that X can assume any value of its support. To avoid this problem, the term limδx→0 log δx is ignored (rigourously, it can be interpreted as a reference), and differential entropy comes as (the same notation, HS (X) or HRα (X), will be used) HS (X) = −
Z
f (x) log f (x) dx, �Z � 1 α log f (x) dx , HRα (X) = 1−α
(2.63) α > 0, α 6= 1.
(2.64)
For notation simplicity we shall denote formulas (2.63) and (2.64) simply as entropies (without the word differential) and by HS and HRα , respectively. Note that the relations in (2.62) are still valid and that the distribution with minimum entropy is the δ-Dirac.
2.4.2
The Principle of Minimum Error Entropy
Since the establishment of a more concise theory on information measures after the important contributions made by Shannon, several entropy-related principles have been proposed and used with different applications. Probably the first one is due to Jaynes [55] and was designated maximum entropy (MaxEnt) principle, stating that When an inference is made on the basis of incomplete information, it should be drawn from the probability distribution that maximizes the entropy, subject to constraints on the distribution. This results in a constrained optimization problem. MaxEnt has been applied in several areas such as thermodynamics and statistical mechanics, statistical inference or speech and signal processing. For example, it is possible to show that for a given variance (constraint on the distribution), the Gaussian distribution
2.4. ENTROPY AND ITS ESTIMATION
49
is the one with largest entropy. The principle of minimum discrimination was introduced by Kulback [62] as a powerful tool to build complete probability distributions when only partial knowledge is available. The first application to a self-organizing system is due to Linsker and his maximum mutual information (Infomax ) principle [69]. The basic idea is to maximize the mutual information between the inputs and outputs of an adaptive system. As an example, we could perform feature extraction if the outputs are in less number than the inputs and in a way that the information passed from the inputs to the new features is maximized. Several variants have been proposed since then. Two of the most known are the approach of Comon [12] to independent component analysis and the maximum entropy method for blind source separation of Bell and Sejnowski [9]. In recent years, the use of information-theoretic measures in system adaptation has gained a great impulse due to the works of Pr´ıncipe’s group. In fact, it was this author that first termed this paradigm as information theoretic learning (ITL). It all started with Fisher’s work [30, 31] on subspace projections and nonlinear principal component analysis. A great advance was obtained by Xu [83, 114, 115] who introduced the estimator for R´enyi’s quadratic entropy. The great novelty here was the obtention of a nonparametric estimator of entropy using the kernel density estimator (Gaussian kernel). The principle of minimum error entropy (MEE) was posteriorly proposed by Erdogmus [19, 21, 24]. Instead of minimizing MSE, the adaptive system must be trained such as to minimize the entropy of the error (difference between the target and the output of the system), that is, in a way such that the amount of information lost to the error is minimized. The first approach was to utilize R´enyi’s quadratic entropy, because an estimator was already known from Xu’s work. An error-entropy minimization algorithm for MLP training in regression was proposed [21, 24] and shown to outperform MSE trained MLP’s in the prediction of the Mackey-Glass temporal
50
CHAPTER 2. BASIC CONCEPTS
series. A generalized estimator for R´enyi’s entropy of any order was posteriorly proposed and analyzed, allowing both the use of any entropy order and any kernel function [22, 25]. Erdogmus and Pr´ıncipe not only presented practical evidence but also theoretical results about MEE for regression-type problems. The authors proved that searching for the parameters w of a learning machine by minimizing the error entropy is equivalent to minimizing a Csisz´ar distance [14] (with convex function (.)1−α ) between the joint pdfs of the input-target and input-output distributions when R´enyi’s α-order entropy is used 1 log min w 1−α
Z
α fe,w (e)de
≡ min w
Z Z
fxy,w (x, y)
�
fxt (x, y) fxy (x, y)
�1−α
dxdy
or minimizing the Kullback-Leibler divergence in the case of Shannon’s entropy � � Z Z Z fxy (x, y) dxdy. min − fe,w (e) log fe,w (e)de ≡ min fxy,w (x, y) log w w fxt(x, y) This amounts to the reduction of the expected information contained in the error, which leads to a maximization of the mutual information between the desired target and the model output [24]. In other words, the network is learning the target variable and the concept is proved as optimal in a statistical sense. In the same work, it was also shown that the use of the kernel density estimator to obtain the estimator for R´enyi’s quadratic does not affect the location and globalness of the optimal solution. These results in conjunction gave rise to a wide panoply of practical applications. Similar results have been obtained for the generalized estimator of R´enyi’s entropy [25] and convergence properties have also been studied [26]. The connection to classification has been performed in [23, 27] where the wellknown Fano’s bound for the probability of error [29] of a classifier is extended. Whereas Fano’s version only provides a lower bound based on Shannon’s entropy, Erdogmus provides several lower and upper bound based on R´enyi’s definitions of entropy. The application of the MEE principle for the training of neural
2.4. ENTROPY AND ITS ESTIMATION
51
networks classifiers was performed in our team and is the topic of discussion in Chapter 3.
2.4.3
Estimating Entropy from Data
In the previous section we constantly referred to some estimators of entropy without directly presenting them. This will be the theme of the present section. Let us consider from now on, the problem of determining the entropy of a continuous random variable. If f (x) is known, one can directly determine the integral (when it is possible and tractable). For example, if f (x) is a Gaussian √ univariate density with variance σ 2 then HS = log(σ 2πe) while for a uniform random variable in the interval [a, b] one has HS = log(b − a). Several other formulas for univariate and multivariate densities can be found in the literature [3, 37, 66]. The problem arises when the density is not known and all that is provided is a set of data points. In this case entropy estimators have to be derived. Note that most of the literature is concerned with Shannon’s entropy estimators. We start by discussing some HS estimators and afterwards we present a recently proposed estimator for R´enyi’s entropy.
2.4.3.1
Estimating Shannon’s Entropy
This section follows the overview presented in [8]. To set terminology, let us ˆ S as an estimator13 of HS obtained from an i.i.d. random sample consider H X1 , X2 , . . . , XN . The authors classify the estimators in three categories: Plugin, Sample-spacing based and Nearest Neighbor Distances based estimators. We will just consider the former group as they use a consistent density estimate of f (x), like the kernel density estimate. For information on the other categories 13
ˆ S,N to emphasize the dependency on the (size of the) data, but In fact, we should write H
we rely that for the hat symbol and adopt the simpler notation.
52
CHAPTER 2. BASIC CONCEPTS
of entropy estimators see [28, 41, 61, 110]. Plug-in Estimates These entropy estimators are based on a consistent density estimation fˆ of f provided by, for example, the kernel density estimator (2.31). There are four different plug-in estimators: integral estimator, resubstitution estimator, splitting data estimator and cross-validation estimator. Although our choice fall into the resubstitution version, we briefly present all the approaches. • The integral estimator is of the form Z ˆ fˆ(x) log fˆ(x) dx, HS = −
(2.65)
An
where, in the set An one usually excludes tail values of fˆ.
The first
integral estimator was proposed in [17], to estimate (2.65) for the case of an unidimensional pdf and used the kernel density estimator to obtain fˆ. The strong consistency of this estimator was shown, that is ˆ S = HS lim H
n→∞
a.s..
(2.66)
However, the evaluation of the integral in (2.65) requires numerical approximation which is not easy if fˆ is computed by a kernel density estimator and particularly if fˆ is a multivariate pdf [57]. The integral can be easily calculated if fˆ is an histogram. Strong consistency of such an histogram based estimator under some conditions was proved in [38]. • The resubstitution estimator is of the form
N X ˆS = − 1 H log fˆ(Xi ). N
(2.67)
i=1
The resubstitution estimator was first proposed in [2], where fˆ is obtained by kernel density estimation. The mean square consistency of such an estimator can be shown under mild regularity conditions.
53
2.4. ENTROPY AND ITS ESTIMATION
Estimation of HS for multivariate pdf’s, using (2.67) and kernel density estimation, was also studied in [57] where was pointed out that the sample size needed for good estimates increases rapidly with the dimension of the multivariate density. Asymptotic bias and variance terms where obtained under some smoothness and tail conditions on f and it was shown that nonunimodal kernels satisfying certain conditions can reduce the mean square error. • In the splitting data estimator the data is split in two sub-samples with sizes
∗ , N = L + M . First, using L and M : X1 , X2 , . . . , XL and X1∗ , X2∗ , . . . , XM
one sub-sample (for example, the L-sized), the estimation fˆ is computed, and then, using this estimation and the other sub-sample, the entropy is estimated by: M X ˆS = − 1 I[Xi∗ ∈AL ] log fˆ(Xi∗ ). H M
(2.68)
i=1
This approach was proposed in [38], [39] and [40] with fˆ being, respectively, the histogram density estimate, the kernel density estimate and any L1 -consistent density estimate. Strong consistency was shown for general dimension d, under some mild tail and smoothness conditions. Of course, this estimator requires more data. • The cross-validation estimator is based on cross-validation, or leave-one
out, density estimation. If fˆ˜i denotes a density estimation based on the sub-sample X1 , X2 , ..., Xn leaving Xi out, entropy will be estimated by: N 1 X ˆ HS = − I[Xi ∈AN ] log fˆ˜i (Xi ). N
(2.69)
i=1
A cross-validation entropy estimation based on kernel density estimation was proposed in [51] and [41]. In [51] the strong consistency of the estimator is shown and the rate of convergence properties were also presented. In [41] the root-N consistency is shown for 1 ≤ d ≤ 3.
54
CHAPTER 2. BASIC CONCEPTS
2.4.3.2
R´ enyi’s Quadratic Entropy Estimation
We now discuss the estimation of R´enyi’s entropies. As previously discussed, R´enyi’s quadratic entropy was the first to be studied. The proposed estimator uses the Parzen window estimator for the pdf with a (standardized) Gaussian kernel [114, 115]. This estimator differs from the approaches used for Shannon’s entropy because in reality the only estimate made is in the pdf. If G(x) is the standardized Gaussian kernel then14 ˆR H 2
� � !2 N x − xi 1 X dx G = − log Nh h −∞ i=1 � � � � N N Z x − xj 1 X X +∞ x − xi = − log 2 2 G G dx N h h h i=1 j=1 −∞ � � N N X X xi − xj 1 1 √ G √ . = − log 2 2 N h 2 2h i=1 j=1 Z
+∞
(2.70)
where the last expression is derived by the fact that the integral of the product of two Gaussians is again a Gaussian with variance equal to the sum of the original variances [114]. The generalized estimator posteriorly proposed by Erdogmus for the general αorder R´enyi’s entropy [19, 25] considers the fact that (2.64) can be expressed as an expectation and the usual sample mean approximation is used to bring (for a general kernel) N iα−1 1 1 Xh ˆ log f (xi ) 1−α N i=1 � � α−1 N N X X xi − xj 1 1 log α α−1 K = . 1−α N h h
ˆ Rα = H
i=1
(2.71)
j=1
These estimators were proven to preserve the global minimum, that is, when the distribution of the samples is a δ-Dirac. 14
For notation simplicity we shall denote from now on hN simply as h.
Chapter 3
Neural Networks with Error PDF Estimation In this chapter we discuss the implementation of neural network classifiers using cost functions that optimize some measure of the error pdf. We start by discussing R´enyi’s entropy and proceed to introducing Shannon’s entropy and to presenting some experiments [104]. Guided by the ideas of entropy minimization we derive the Z-EDM cost function as well as a generalization to an exponential cost function both of which we have recently developed [99, 100, 101].
3.1
The Principle of Minimum Error Entropy
The most commonly used cost function for adaptive systems has been the mean square error, EM SE . This choice is justified by the assumption that most real-life random processes can be explained by the Gaussian distribution and its first and second order statistics. However, this Gaussianity assumption is very restrictive. As we have already discussed, the cross-entropy cost function appears to be more 55
56
CHAPTER 3. NN WITH ERROR PDF ESTIMATION
appropriate for classification than MSE. It has also been a major concern to utilize more appropriate criteria able to take advantage of higher-order statistical behaviors. Entropy and related measures have thus been proposed as more powerful alternatives. We devote this section to the principle of minimum error entropy (MEE) (introduced in section 2.4.2) applied to the training of neural networks classifiers.
3.1.1
The MEE Approach using R´ enyi’s Entropy
The first applications of the MEE principle used R´enyi’s definition of entropy. A wide panoply of theoretical results and applications concerning this entropy measure have been developed by Pr´ıncipe and co-workers, namely in time series prediction [24], feature extraction, clustering [36, 56] and blind source separation [20, 46]. The extension of MEE to classification problems with feedforward MLP’s was performed in our team by Santos et al. [90, 91, 93, 96] as well as with recurrent networks [4]. The experimental results presented by Santos et al. showed that R´enyi’s entropy generally performs better than MSE in terms of minimum classification test error. Consider E = T − Y as the error r.v.1 between the output Y of the neural network and the desired target T . R´enyi’s quadratic entropy of the error can therefore be estimated using (2.70) as � � N N X X 1 e −e ˆ R = − log 1 √ G i√ j = − log VˆR2 . H 2 2 2 N h 2 2h
(3.1)
i=1 j=1
The term VˆR2 is called information potential and an analogy to physical systems (interaction between particles, forces, etc) is given in [82].
An interesting
practical aspect arises here when we are dealing with a regression-type problem (or more specifically, when the output activation is linear): the final set of 1
We are considering, for notation simplicity, the case of a single output, but the extension
for multiple outputs is straightforward.
3.1. THE PRINCIPLE OF MINIMUM ERROR ENTROPY
57
weights may not yield zero-mean error, giving rise to a biased estimate of the input-desired mapping. This is related to the theoretical fact that entropy is mean invariant, and is reflected in practice by the impossibility to train the bias term at the output. To better illustrate what we are saying, consider a single perceptron with activation function ϕ(x) and output given by y = ϕ(wT x+ w0 ). Taking the information potential one derives ∂ VˆR2 1 XX ′ G = ∂w0 a i
j
�
ei − ej h
�
�
� ϕ′ (wT xj + w0 ) − ϕ′ (wT xi + w0 ) ,
(3.2)
where a is an appropriate constant. Thus, if ϕ(x) = x, the above derivative is always zero, and it is not possible to train the bias term. The first solution proposed by the authors was to properly modify the bias weight of the output unit after training [24]. Later, in [64], a modified version of (3.1) was proposed by minimizing the divergence between the error pdf and a δ-Dirac distribution located at zero. The result was the term in (3.1) plus another quantity that allows the automatic training of the bias weight. This issue is not found in classification, where ϕ(x) is a squashing activation function like tanh. Looking to expression (3.2) we see that the derivatives of ϕ do not cancel in general. It should also be noticed that driving e = t − y to zero, although essential for regression as we have seen above, is not necessary to make classification work in the sense of using MEE and reaching a δ-Dirac error pdf. Indeed, it is only needed that all the errors are equal. Let us consider an unidimensional two-class problem where yi is the output of pattern xi . One can prove: Theorem 2. (new in this work) An MLP trained with N cases xi , i = 1, . . . , N from two classes C-1 and C1 with targets t-1 and t1 , respectively, will be able to reach a δ-Dirac distribution of the error (the minimum error entropy) if and only if for all cases the MLP outputs are constant within each class and their inter-class output differences are equal to the respective target differences.
58
CHAPTER 3. NN WITH ERROR PDF ESTIMATION
Proof. The minimum of entropy corresponds to a δ-Dirac function for the error variable, thus one can assume ei = ǫ, ∀i. Then it is easy to see that for xi ∈ Cc , with c ∈ {−1, 1},
ei = tc − yi ⇒ yi = tc − ǫ,
(3.3)
i.e., within each class we have constant output. Furthermore, for any pair (xi , xj ) such that xi ∈ C-1 , xj ∈ C1 , one must have ei = ej ⇔ t-1 − yi = t1 − yj ⇔ yi − yj = t-1 − t1 .
(3.4)
Of course, it is more appropriate (and desirable) to have e = 0. But this amounts to a particular case of the above Theorem. We state it as a trivial Corollary [90]: Corollary 1. Consider a two class supervised classification problem with a unidimensional output vector. Let y ∈ [r, s] be the output of the network and t ∈ {a, b} be the target set. If r = a, s = b and a = −b then the least possible error entropy will be reached when all the errors are zero. Thus, in light of this Corollary, if the family of functions implemented by the classifier is rich enough to allow the convergence of the error pdf to a δ-Dirac distribution and the training algorithm assures such convergence, then the MEE algorithm will provide the best classification solution. One can conclude from this result that it would be necessary to have an activation function in the output neuron of the form (a < 0)
ϕ(x) =
−a
x ≥ c1
g(x) x ∈]c0 , c1 [ , a x ≤ c0
(3.5)
for some c0 , c1 ∈ R and g(x) such that ϕ(x) is continuous. We note that in the case of the usual continuous activation functions it is never possible to have
3.1. THE PRINCIPLE OF MINIMUM ERROR ENTROPY
59
constant output for each class. In practice, as we choose the hyperbolic tangent for activation function, we encode the targets with a = 1 for a single output or with an 1-out-of-C scheme for multiclass problems (described in section 2.3.2). The work of Jorge Santos provided the first application of MEE to the training of neural network classifiers [91] (the principle was coined EEM in his work). The comparison with MSE trained MLP’s showed increased performance of the proposed methodology both for artificial and real data sets. Several optimization strategies have been implemented. The variable learning rate was studied and adopted in [96] (which also influenced the present work to use it). Variable smoothing parameter was also studied, although with no success due to the instability of the algorithm for small values of h. Nevertheless, a formula for h was provided [94]. The final optimization strategy was to develop a batchsequential method to reduce the complexity and the time of training with MEE [93]. Finally, the application of both MLP trained classifiers with MEE in conjunction with the LEGClust (clustering) algorithm [95] was successfully applied in modular neural network task decomposition [92].
3.1.2
The MEE Approach using Shannon’s Entropy
Neural network classification by minimization of Shannon’s entropy of the error is quite similar to the previous approach. The proposed backpropagation algorithm does not use expression (2.63) directly as a cost function, but instead it uses the resubstitution estimator as discussed in section 2.4.3.1 � � N N N X X X e − e 1 1 i j ˆS = − 1 log fˆ(ei ) = − log K . H N N Nh h i=1
i=1
j=1
(3.6)
60
CHAPTER 3. NN WITH ERROR PDF ESTIMATION
Note that Shannon’s entropy can be seen as the expected value of log f (x), thus the approximation of the integral by the mean value over a sample. Also, as we don’t know the distribution of the error variable, we must rely on nonparametric estimates as before, using the nonparametric kernel estimator with a standardized Gaussian kernel (K(x) = G(x)). In order to use the steepest descent training rule and the backpropagation algorithm, we need to derive an analytic expression for the gradient. Using the usual notation where
ˆS ∂H ∂wkl
ˆ S related to denotes the partial derivative of H
the weight connecting neuron k in a previous layer to neuron l in the next layer, we have N N ˆS 1 X ∂ 1 X 1 ∂ fˆ(ei ) ∂H =− log fˆ(ei ) = − . ˆ(ei ) ∂wkl ∂wkl N ∂wkl N f i=1 i=1
(3.7)
Now, ∂ fˆ(ei ) ∂wkl
N
=
∂ 1 X 1 1 √ exp − Nh 2 2π ∂wkl j=1 N
=
−1 X 1 G Nh h2 j=1
�
ei − ej h
�
ei −ej h
�
�
ei − ej h
�2 !
�
� ∂ei ∂ej − (ei − ej ) . ∂wkl ∂wkl
(3.8)
Thus ˆS ∂H 1 = 2 3 ∂wkl N h The computation of
∂ei ∂wkl
N N X X i=1 j=1
G
fˆ(ei )
�
�
� ∂ei ∂ej (ei − ej ) − . ∂wkl ∂wkl
(3.9)
is as usual for the backpropagation algorithm. We just
have to take care whether wkl is an input-hidden or an hidden-output neuron. Having determined (3.9) for all network weights, the weight update is given, for the m-th iteration, by the gradient descent rule (m)
(m−1)
wkl = wkl
−η
ˆS ∂H . ∂wkl
(3.10)
61
3.1. THE PRINCIPLE OF MINIMUM ERROR ENTROPY
Note that (3.9) can be expressed as a total sum of an element-by-element product of four matrices as follows � � � � � � 1 1 1 1 e1 −e1 2 1 e1 −eN 2 1 . . . . . . G − G − 2 h h 2 h fˆ(e1 ) fˆ(e1 ) h . .. .. .. .. . × . . . � � � � � � 2 1 eN −e1 2 1 1 N ... ˆ 1 . . . h1 G − 12 eN −e hG −2 h h fˆ(eN ) f (eN ) ∂eN ∂e1 ∂e1 ∂e1 − . . . − e1 − e1 . . . e1 − eN ∂wkl ∂wkl ∂wkl ∂wkl .. .. .. .. .× . .× . . . . ∂eN ∂eN ∂eN ∂e1 − . . . − eN − e1 . . . eN − eN ∂wkl ∂wkl ∂wkl ∂wkl
The second matrix is symmetric whereas the third and fourth are anti-symmetric (in particular the diagonal elements are zero). Thus, the computations can be reduced and (3.9) re-written in the form � � � � ei − ej ∂ej ∂ei 1 X1 ∂HS = 2 2 G − (ei − ej ) ∂wkl N h h h ∂wkl ∂wkl j>i
1 fˆ(ei )
+
1 fˆ(ej )
!
.
The first matrix is not present when R´enyi’s quadratic entropy is used, showing ˆ S and H ˆ R is the need, in the former, to compute that the difference between H 2 reasonable estimates of f (e) at N points (but not the whole error pdf).
3.1.2.1
Algorithm Optimization
The algorithm has two parameters that one should optimally set: the smoothing parameter, h, of the kernel density estimator and the learning rate, η. As the training process evolves, it is expected that the errors get more concentrated around the origin. This means that, in what concerns pdf estimation, one should decrease the smoothing parameter h to avoid an oversmoothed estimate. As we have seen, adaptation of h along the training process was tried in previous works for R´enyi’s quadratic entropy [90]. We also utilized similar methods, like decreasing h proportionally to the variance of the errors at each epoch. However, the experimental results have shown that at a certain stage of training the
62
CHAPTER 3. NN WITH ERROR PDF ESTIMATION
algorithm becomes unstable and incapable of reaching the optimal solution. We note that h not only controls the smoothness of the density estimate but also ˆ S as well. If h is too small, the error pdf estimate may have high variability H ˆ S many spurious minima. If h is (appropriately) high, both the density and H ˆ S are smoothed and the spurious behaviors cleaned. This is estimate and H referred as the dilatation property in Erdogmus work [25]. The strategy followed in this work was to use a fixed h chosen by performing several runs with different h values to determine the best for each data set and network configuration. Figure 3.1a shows the mean (over 10 repetitions) test error for the data sets Sonar and New Thyroid as a function of h. As one can see, if h is too small the algorithm does not perform well. On the other hand, for a sufficiently high value of h we achieve good results and these are not particularly sensitive to that value. We also investigated the benefits of adjusting η along the training process. The strategy used was already described in formula (2.48) of section 2.3.2. Figure 3.1b shows the training curves for variable and fixed learning rate, where each curve is a mean over 25 repetitions of the corresponding experiment (for the Sonar dataset). As we can see, with a typical value of η = 0.1 (dashed-dot line) the convergence is very slow when compared with the variable learning rate curve (dotted line). The solid line, for η = 2 shows a fast convergence but an unstable behaviour during the training process (remember that each curve is an average curve). Thus, the procedure of variable learning rate not only solves the problem of choosing η, but also ensures a stable training.
3.1.2.2
Analysis of Shannon’s Entropy Estimator
It has been shown in a previous work that the minimization of Shannon’s entropy of the error is equivalent to the minimization of Kullback-Leibler’s
63
3.1. THE PRINCIPLE OF MINIMUM ERROR ENTROPY
0.4 Mean % Training Error
Mean % Test Error
0.8
0.6
0.4
0.2
0 0
2
4
6
8
10
variable K K = 0.1 K=2
0.2
0 0
100
h
200
300
Epochs
(a)
(b)
Figure 3.1: At the left: Mean test error curves (10 runs) as functions of h for Sonar (solid) and New Thyroid (dashed). At the right: Mean training error curves (25 runs) for variable and fixed learning rate.
divergence between the joint input-target and input-output pdfs. This means that the artificial system is learning the input-target relation in a distributional statistical sense. It was also shown that the integral estimator (2.65) where fˆ is the pdf estimate obtained with Parzen windowing, has minima in the directions where all the samples are equal, i.e, where only the mean varies [24]. However, the above estimator is not used due to the need to compute the integral. This, problem is overcome with the use of the resubstitution estimator that we discussed earlier. Hence, it is important to know if this estimator also preserves the minima and what is its nature. We start by showing that ˆ Rα = H ˆS. Lemma 1. (new in this work) limα→1 H
Proof. Assume a general kernel Kh (ei − ej ) ≡ K(
ei −ej h ).
The result follows from
L’Hˆ opital’s rule. As ˆ Rα = log(N/N ) = 0 , lim H 0 0
α→1
(3.11)
64
CHAPTER 3. NN WITH ERROR PDF ESTIMATION
we apply the rule giving
ˆ Rα = lim lim H
α→1
d dα
log
1
N α hα
i
d dα (1
α→1
log(1/N h) + =
1 N
�α−1 K (e − e ) i j h j
P �P P
i log
−1
− α) �P
� K (e − e ) i j h j
X X X 1 1 1 Kh (ei − ej ) log log − = N Nh N j i i X 1 X 1 ˆS. =− log Kh (ei − ej ) = H N Nh i
(3.12)
(3.13) (3.14)
(3.15)
j
ˆ Rα for α = 1, which in practice, amounts to This result allows the study of H the estimator for Shannon’s entropy. Also, to study Shannon’s entropy we do not need the suggested scheme of taking values of α close to 1. We just use the proposed estimator. Now, the same analysis made in [25] for R´enyi’s entropy can be extended for α = 1. We also extend the analysis for the case of d outputs and explicitly use the standardized multivariate Gaussian kernel ! � � d 1 1 1 T 1X 2 G(x) = x . exp − x x = exp − 2 2 s=1 s (2π)d/2 (2π)d/2 Lemma 2. (new in this work) The nonparametric estimator of Shannon’s error entropy has a minimum when all the errors ei , ∀i = 1, . . . , N are null.
Proof. Consider the d-dimensional error vectors e1 , . . . , eN such that for some ¯ = (e11 , . . . , ed1 , e12 , . . . , edN ). Thus, i one has ei = (e1i , . . . , edi ) and let e ˆS ≡ H ˆ S (¯ ˆ S by analyzing ¯ = 0 is a minimum of H H e). We shall demonstrate that e its gradient and Hessian. Due to their length, the corresponding expressions of these quantities can be found in Appendix C. In what concerns the gradient,
3.1. THE PRINCIPLE OF MINIMUM ERROR ENTROPY
65
¯ = 0 is a critical point of the estimator because one can determine that e ˆ S ∂H ∂eki
¯=0 e
1 (N − 1)G(0) × 0 X G(0) × 0 = − = 0. N h2 N G(0) N G(0) l6=i
In a similar fashion, we obtain the entries of the Hessian matrix ˆ S 2(N − 1) ∂2H , = 2 N 2 h2 ∂eki ¯=0 e ˆ S −2 ∂2H = 2 2, m 6= i, ∂ekm ∂eki N h e¯=0 2 2 ˆ ˆ ∂ HS ∂ HS = = 0, m 6= i, s 6= k. ∂esi ∂eki ∂esm ∂eki ¯=0 e
¯=0 e
We recognize this Hessian as a generalization of the one obtained in [25] for R´enyi’s order α = 1. The eigenvalues and eigenvectors are given in Appendix
C. One can conclude that the Hessian is positive semi-definite. We notice that ¯ = (a1 , a2 , . . . , ad , a1 , . . . , ad , . . . , ad ), that is, the correany solution of the form e sponding components of all errors are equal, would provide the same solutions in terms of gradient and Hessian (this can be seen by looking to the eigenvectors of the zero eigenvalue). However, due to the coding of the outputs and the targets, ¯ = 0. Thus, e ¯ = 0 is a we know from section 2.3.2 that the only possibility is e ˆS. minimum of H
We can now proceed to proving the globalness of the minimum. Theorem 3. (new in this work) The Shannon’s entropy estimator minimum, ¯ = 0, is global. e
Proof. We must prove that ˆ S (¯ ˆ S (0) ⇔ H e) ≥ H
X i
X G(0) 1 G(ei − ej ) ≤ N log . log Nh h
j
(3.16)
66
CHAPTER 3. NN WITH ERROR PDF ESTIMATION
Now X i
� � X X 1 1 log log G(ei − ej ) ≤ N max G(ei − ej ) j Nh Nh i j � � X G(ei − ej ) = log max j h i X G(ei − ej ) = max log j h i X G(0) G(0) ≤ log = N log . h h
(3.17) (3.18) (3.19) (3.20)
i
With these results we have shown that the use of the kernel density estimator ˆ S can be used as a cost function does not affect the optimal solution and thus, H for training neural network classifiers. This is shown in the following section.
3.1.2.3
Experiments
In [104] we presented a comparison between MLP classifiers trained with EM SE , ECE and Shannon’s entropy with five two-class datasets obtained from the UCI repository [79]: Sonar, Liver, Ionosphere, Wdbc and Pima. For each dataset we trained several one hidden layer MLP configurations, varying the number of hidden units. The following procedure (holdout) was performed 20 times: divide the data in two subsets, half for training and half for testing; train the network during 150 epochs and compute the test set error; interchange the roles of the training and test sets; perform training and test again. The results obtained are shown in Table 3.1. ˆ S performs very well when compared to EM SE and ECE . In As one can see, H
ˆ S are better than the best Ionosphere and Pima data sets, all the results for H ˆS EM SE result, being the latter obtained with higher hid values than the best H
67
3.1. THE PRINCIPLE OF MINIMUM ERROR ENTROPY
Table 3.1: Mean test error (%) and standard deviations (in brackets) in five UCI ˆ S , EM SE and ECE . Best results of each method are in bold. data sets using H Sonar hid
2
3
4
7
8
9
10
12
ˆS H
23.3(2.1)
23.2(2.6)
22.1(3.0)
21.6(2.6)
21.1(2.2)
21.6(2.2)
20.9(2.5)
20.0(2.2)
EM SE
22.0(2.8)
21.4(3.4)
21.4(2.5)
22.2(2.4)
20.9(3.2)
22.1(2.2)
20.8(2.6)
20.9(2.9)
ECE
24.9(2.6)
24.1(2.8)
23.7(3.1)
21.9(3.1)
22.0(2.8)
23.4(2.9)
22.4(2.4)
21.5(2.6)
3
4
7
8
9
10
12 30.2(1.6)
Liver hid
2
ˆS H
30.6(1.5)
31.3(1.9)
30.4(2.1)
30.9(2.2)
20.4(1.6)
29.7(1.7)
30.3(2.1)
EM SE
30.3(1.9)
29.7(2.0)
30.4(1.8)
30.9(2.4)
3.9(2.3)
29.9(2.0)
29.9(2.1)
30.4(1.6)
ECE
32.3(2.3)
32.8(1.9)
30.7(2.2)
30.0(1.4)
29.7(1.8)
30.0(1.8)
30.3(1.6)
30.8(2.5)
Ionosphere hid
2
3
4
7
8
9
10
12
ˆS H
12.4(1.7)
12.2(1.4)
12.0(1.2)
12.1(1.3)
12.4(1.3)
12.1(1.3)
12.4(1.2)
12.2(1.4)
EM SE
13.7(1.9)
13.1(1.6)
13.2(1.6)
12.7(1.7)
13.4(2.0)
13.1(1.5)
13.9(3.1)
13.2(1.2)
ECE
11.7(2.0)
11.7(1.7)
12.7(2.2)
12.1(1.5)
12.1(1.6)
12.1(1.4)
11.4(1.4)
12.2(1.5)
3
4
7
8
9
10
12
Wdbc hid
2
ˆS H
3.40(0.59)
3.49(0.47)
3.34(0.88)
3.36(0.53)
3.29(0.66)
3.08(0.57)
3.32(0.77)
3.29(0.51)
EM SE
3.80(0.85)
3.34(0.65)
3.35(0.63)
3.30(0.70)
3.59(0.62)
3.26(0.61)
3.58(0.72)
4.36(4.45)
ECE
3.53(0.94)
3.86(0.90)
3.59(0.54)
3.66(0.74)
4.10(0.78)
3.71(0.74)
3.44(0.62)
3.44(0.58)
Pima hid
2
3
4
7
8
9
10
12
ˆS H
24.5(1.2)
24.9(0.8)
25.6(1.5)
25.6(1.0)
25.8(1.3)
25.8(1.3)
25.6(1.1)
25.9(1.4)
EM SE
26.9(1.5)
26.5(1.0)
26.2(1.2)
26.6(1.2)
26.4(1.2)
26.0(1.1)
26.2(1.4)
26.5(1.2)
ECE
24.4(1.1)
24.8(1.2)
24.8(1.3)
24.3(1.0)
24.2(0.9)
24.3(1.2)
24.1(0.9)
23.4(0.7)
results. ECE performed very well here, with lower error but higher hid. For Sonar and Liver, the best EM SE results are obtained with smaller hid values; still, the smallest misclassification error and/or standard deviation are obtained ˆ S . Moreover, ECE performed poorly in Sonar. Wdbc is the only data with H set where the best results were achieved with equal number of hidden units, ˆ S and EM SE , but again H ˆ S outperforms EM SE . Also, only two EM SE both for H
68
CHAPTER 3. NN WITH ERROR PDF ESTIMATION
results are better for Wdbc (hid=3,7). Again, ECE has a worse performance.
ˆ S has lower standard deviations which could One can also see that, in general, H mean a more stable learning procedure. In conclusion, Shannon’s MEE also reveals itself as a good alternative for the usual risk functions used in the training of neural network classifiers. However we should stress that the algorithm’s complexity is higher which implies more time to perform the same experiments.
3.2
The Principle of Density Maximization
In the following we derive two new cost functions for neural network training. The first one, the Zero-Error Density Maximization (Z-EDM), is derived from the ideas gained from entropic criteria discussed above. We follow to build a new exponential cost function, which generalizes Z-EDM and is able to emulate the behaviors of classical criteria.
3.2.1
The Zero-Error Density Maximization
From all that was discussed in the previous section, we expect from the training process of an MLP, that the output y gets closer to the target t and thus the errors e = t−y will converge to the origin (again, under the assumption that the family of functions implemented by the MLP is rich enough). For a given data set {(xi , ti )|i = 1, . . . , N }, we would get in a limit scenario that ei = ti − yi = 0 ∀i, which amounts to a δ-Dirac distribution of the error variable centered at the origin. This means that, as training evolves, a distribution with a higher peak at the origin is induced in the errors. This idea led us to the adaptive criteria of adjusting the weight vector w by maximizing the error density at the origin w∗ = arg max f (0; w), w
(3.21)
3.2. THE PRINCIPLE OF DENSITY MAXIMIZATION
69
where w∗ is the optimal weight vector for the MLP and f is the error density. In practice, the error distribution is not known and making parametric assumptions would be very restrictive. Again, we rely on nonparametric density estimation by using the kernel density estimation procedure of Parzen windows with a standardized Gaussian kernel (a similar analysis to the one performed in section ˆ S , shows that the Gaussian kernel satisfies the conditions to ensure 3.1.2.2 for H that the use of kernel density estimation does not affect the optimal solution [99]). The final expression to be optimized becomes: � � N e2i 1 X 1 ˆ √ exp − 2 . f (0) = Nh 2h 2π
(3.22)
i=1
This new procedure, coined Zero-Error Density Maximization (Z-EDM) [99, 101], can be easily plugged in the usual backpropagation scheme. The gradient of (3.22) with respect to a particular parameter w is derived as �� � � N ∂ei 1 X ei e2i ∂ fˆ(0) √ =− . exp − 2 2 ∂w Nh 2h ∂w h 2π
(3.23)
i=1
We conducted some preliminary experiments where the convergence capability of several MLP’s (2, 6 and 10 hidden units) trained using Z-EDM and MSE cost functions is evaluated. The data set used was Pb12, a vowel discrimination problem. The MLP’s were trained 100 times with the whole dataset and a convergence success was counted whenever the final training error was below 9%. We varied the number of training epochs, initial learning rate η and smoothing parameter (h = 2 and 5) in the case of Z-EDM. Table 3.2 shows the convergence success rates for Z-EDM and MSE. Below these values, the mean training errors and standard deviations (over the 100 repetitions) are presented. The results show that the proposed method is clearly more powerful in classifying this dataset. In fact, we encounter already a very good performance for the case of 2 hidden units, while MSE has a global poor performance. By inspecting the training errors and standard deviations, we also find a higher stability of
70
CHAPTER 3. NN WITH ERROR PDF ESTIMATION
Table 3.2: Convergence success rates in 100 repetitions of different MLP’s trained with Z-EDM and MSE for the Pb12 data set. Below are the mean training errors and standard deviations. Z-EDM
MSE
hid
2
6
10
2
6
10
200
71%
100%
100%
6%
87%
90%
9.54(4.38)
7.31(0.19)
7.22(0.08)
37.9(21.1)
9.78(8.26)
9.11(8.88)
96%
100%
100%
21%
97%
99%
7.61(2.05)
6.62(0.28)
6.58(0.22)
28.6(18.3)
7.77(6.83)
6.61(4.72)
99%
100%
100%
38%
96%
100%
7.51(2.03)
6.07(0.21)
5.83(0.29)
20.7(12.8)
7.80(7.21)
5.83(0.29)
500
1000
Z-EDM. We’ve also noted that Z-EDM was not influenced by the initial value of the learning rate, while MSE became very unstable for very high values of η. For 2 hidden units and 200 training epochs, Z-EDM preferred h = 5 while for higher training epochs h = 2 worked better. This can be related to the smoothness of the performance surface and the dilatation property mentioned earlier. With a small h and consequently a less smoother surface, the number of training epochs (200) may not be sufficient in most cases. This can be surpassed by increasing h at a cost of biasing the optimal solution. Thus the results of Table 3.1 were obtained with an initial η = 0.5 and h = 2 except for epochs = 200 where h = 5. Figure 3.2 shows decision boundaries obtained with Z-EDM and MSE in different situations. The top figures were obtained with hid = 2 and the bottom with hid = 10; the left figures used epochs = 200 and the right ones epochs = 500. The figures show evidence of the stability of Z-EDM and the poor performance of MSE for hid = 2. Also, we encounter a higher adaptation of MSE decision lines to the data for hid = 10, which can be a drawback in terms of generalization. These results also show some dependence on the value of h. As this parameter controls the smoothness of the density estimate and consequently the smooth-
3.2. THE PRINCIPLE OF DENSITY MAXIMIZATION
1
71
1
Ŧ1 Ŧ1
1
Ŧ1 Ŧ1
(a) hid = 2, epochs = 200
1
(b) hid = 2, epochs = 500
1
1
Ŧ1 Ŧ1
1
Ŧ1 Ŧ1
(c) hid = 10, epochs = 200
1
(d) hid = 10, epochs = 500
Figure 3.2: Decision boundaries for Pb12. Solid dark line was obtained with Z-EDM and dashed light line with MSE.
ness of the cost function and in order to better understand its influence in the training process, several data sets were used for training 100 times (full data set) using several different values of h. Figure 3.3 shows the mean training curves for the Olive and Ctg16 data sets. We found that values of h smaller than 1 do not work, independently of the data set, number of classes and/or the number of training examples. When h is increased, the curve is basically shifted forward and a flat region appears in the earlier epochs. This general behavior was found to be the same for all tested data sets, regardless of the number of classes and
72
CHAPTER 3. NN WITH ERROR PDF ESTIMATION
h=0.5 h=1 h=2 h=5 h=100
0.8
0.9 % Misclassification (train)
% Misclassification (train)
1
0.6
0.4
0.2
0.8 0.7 0.6 0.5 0.4 0.3 0.2
0 0
200
400 600 epochs
800
0.1 0
1000
200
400 600 epochs
800
1000
(a) Olive: 9 classes, 8 features and 572 pat-(b) Ctg16: 10 classes, 16 features and 2126 terns
patterns
Figure 3.3: Mean training curves with Z-EDM for different values of h in two data sets.
number of examples available for training. If we take the expression for the gradient, formula (3.23), we define the function
ϕ(e) =
e √
N h3
e2 exp − 2 2h 2π �
�
,
as a weight function of the gradient “particle”
e ∈ [−2, 2], ∂e ∂w .
(3.24)
Figure 3.4 shows ϕ(e) for
some values of N and h. We can see that gradient particles corresponding to larger absolute values of e get larger weights, whereas gradient particles corresponding to smaller values of e will have a small contribution to the update value (3.23) of the parameter w. Of course, if we increase N or h, then ϕ(e) → 0 and this is the reason for the initial flat platforms encountered in the first epochs of the training error. If we also look to the order of magnitude of the values given by (3.23), one can conclude that this behavior is due to the initial convergence “effort” being done by the adaptive learning rate procedure while attempting to compensate those minuscule orders of magnitude. We can therefore introduce some modifications into our cost function in order to avoid this problem. Note
73
3.2. THE PRINCIPLE OF DENSITY MAXIMIZATION
−3
4
−3
x 10
4
2
2
0
0
−2
−2 N=200 h=1 N=1000 h=1
−4 −1
0
1
x 10
N=200 h=1 N=200 h=3
−4 −1
0
1
Figure 3.4: ϕ(e) as in (3.24) for different values of N and h. that the minimization of (3.22) is equivalent to the minimization of � � N X e2i 2 h exp − 2 , EZEDM = 2h
(3.25)
i=1
in the sense that the same solutions are encountered, because
1 √ N h 2π
and h2 are
just positive scaling factors (we keep the factor h2 to allow a simplification of the gradient). This new expression for Z-EDM no longer suffers from the above problems. Let us now compare the gradients of EM SE , ECE and EZEDM . We have N
X ∂yi ∂EM SE ei =− , ∂w ∂w ∂yi ei , yi (1 − yi ) ∂w i=1 � � N X e2i ∂yi exp − 2 ei = , 2h ∂w
∂ECE =− ∂w ∂EZEDM ∂w
(3.26)
i=1 N X
(3.27)
(3.28)
i=1
and we can consider the following weight functions ϕMSE (e) = e, e t−y = , y(1 − y) y(1 − y) � � e2 ϕZ-EDM (e) = exp − 2 e. 2h ϕCE (y) =
t ∈ {0, 1},
(3.29)
74
CHAPTER 3. NN WITH ERROR PDF ESTIMATION
100
1
0
0
Ŧ1 Ŧ1
0
0 0
1
1
(a) ϕMSE (e)
Ŧ100 0
(b) ϕCE (y) with t = 1
(c) ϕCE (y) with t = 0
0.03
0.3
0.4
0
0
0
Ŧ0.03 Ŧ1
0
(d) ϕZ-EDM (e) with h = 0.1
1
Ŧ0.3 Ŧ1
0
(e) ϕZ-EDM (e) with h = 1
1
1
Ŧ0.4 Ŧ1
0
1
(f) ϕZ-EDM (e) with h = 10
Figure 3.5: Plot of the functions defined in (3.29).
Figure 3.5 shows these functions for some values of their corresponding parameters. From this figure we can see the linear behavior of ϕMSE : the gradient particles
∂yi ∂w
have a weight equal to the corresponding error. The ϕCE function
also confers larger weights to gradient particles corresponding to larger errors. Note that, when t = 1 (t = 0) larger errors correspond to y closest to zero (one). However, the weight assignment is not linear but hyperbolic. For ϕZ-EDM we can distinguish three basic behaviors. When we let h → 0 then ϕZ-EDM → 0. If the parameters of the network are initialized in [−b, b] with b close to zero, then in the early phase of the training process, all the errors are around the values -1 and 1. Thus, with h too small, the algorithm will have difficulties to converge (or even will not be able to start at all!) because ϕZ-EDM gives weights close to zero. For moderate h (h ≈ 1), ϕZ-EDM is a nonlinear function (similar to a sigmoid) where, again, gradient particles corresponding to larger errors get larger weights. Note, however, the contrast with ϕCE : for larger errors ϕCE “accelerates” the weight
75
3.2. THE PRINCIPLE OF DENSITY MAXIMIZATION
value while ϕZ-EDM “decelerates”. Finally, when h is large, ϕZ-EDM behaves like ϕMSE . In fact, it is easy to see that limh→+∞ ϕZ-EDM = ϕMSE .
3.2.2
An Exponential Cost Function: Generalizing Z-EDM
The previous analysis suggested that it might be possible to create a parameterized cost function capable of “emulating” the behaviors of MSE, CE and Z-EDM. This new cost function can be derived from a generalization of (3.25) by allowing positive arguments in the exponential function. Formaly, one defines EExp =
N X
τ exp e2i /τ
i=1
�
(3.30)
or, for C outputs, EExp =
N X i=1
τ exp
C 1X 2 eki τ k=1
!
,
(3.31)
where τ is a real number different from zero. It is easy to see that if τ < 0, EExp recovers the (negative) Z-EDM cost function. Thus, we may also say that for τ → −∞, EExp behaves like EM SE . When τ > 0, EExp behaves like ECE .
This can be seen in Figure 3.6 where the function ϕExp = exp(e2 /τ )e (in the same sense as formulas (3.29)) is plotted for different positive values of τ . From small to moderate values of τ , the function has a marked hyperbolic shape, in the same sense as ECE : smaller errors get smaller weights with an “accelerated” increasing when the errors get larger. Also for τ → ∞, EExp behaves like EM SE . In summary, EExp has the appropriate flexibility to emulate the whole range of EZEDM - EM SE - ECE behaviors. This new cost function resembles (for β = 0) the one proposed by Møller [71] and defined by (for a C-class problem) N
EM oller
C
1 XX exp (−α(yki − tki + β)(tki + β − yki )) . = 2
(3.32)
i=1 k=1
The parameters β and α are positive; β is the width of a region, R, of acceptable error around the desired target and α controls the steepness of the cost function
76
CHAPTER 3. NN WITH ERROR PDF ESTIMATION 10
0
W =0.2 W =0.5 W =1
Ŧ10 Ŧ1
0 e
1
Figure 3.6: Plot of ϕExp = exp(e2 /τ )e for different positive values of τ .
¯ outside that region (R). If we increase α then EM oller becomes more steep
¯ forcing the outputs towards the boundary of R. By decreasing β, the in R, outputs are pulled towards the desired targets (see [71] for a detailed discussion). This cost function was proposed in the framework of monotonic cost functions, briefly discussed in section 2.3.3. Møller defines his function as soft-monotonic, where the degree of monotonicity is controled by α becoming monotonic when α → +∞. There is a significant difference between EM oller and our EExp. In the former, we sum the exponentials of the squared errors (the sum in k) whereas in the latter we compute the exponential of the sum of those quantities. This implies a fundamental difference in terms of the gradients (for β = 0) " !# C X ∂EExp 1X 2 = −2 exp eki , eki ∂yki τ i k=1 X � �� ∂EM oller =− α exp +αe2ki eki . ∂yki
(3.33) (3.34)
i
We see that with EExp , the backpropagated error through the output yk uses � � P 2 ), while E e information from all other outputs (present in exp τ1 C M oller k=1 ki � only uses the error associated to that particular output (present in exp +αe2ki ).
In the following section we compare all these cost functions.
3.2. THE PRINCIPLE OF DENSITY MAXIMIZATION
3.2.3
77
Experiments
In [100], we presented an extensive experimental design where the above cost functions were compared using several data sets. We performed two different procedures depending on the number of patterns available in each data set, that we present in the next sections.
3.2.3.1
Procedure 1
Data sets with a small number of patterns (less than 600) were randomly divided in training (50%) and test set (50%). The training set was used to train the MLP during l epochs and the test set error was recorded for each of the l epochs. The training and test sets interchange their roles and the train and test procedure is again performed. This is repeated 100 times, using different initial weights and randomized training and test sets. The minimum mean test error over the 100 repetitions is then reported. The number of hidden units in the MLP architecture is varied from 2 to 20. For a fair comparison, the initial weights and train/test set partitions of the 100 repetitions were equal for the different cost functions.
Choosing the value of τ , α and γ To use EExp , EM oller and ESM F 2 one must set values for τ , α and γ, respectively. In what concerns EExp and EM oller , the experiments were repeated for several values of |τ | and α, ranging from 0.1 to 10 (usually by steps of 0.5). Figures like Figure 3.7 were produced to help in the choice of the best value. Some data sets “prefer” smaller values of those parameters, while others “prefer” higher ones, with an obvious and expected reversed behavior between EExp and EM oller . However, there is no evident pattern for this behavior. The EExp experiments 2
ESM F is defined in Appendix B. See also section 2.3.3
78
CHAPTER 3. NN WITH ERROR PDF ESTIMATION New Thyroid
Test set error
0.044 W =0.1 W =0.5 W =1.0 W =1.5 W =2.0 W =2.5 W =3.0 W =3.5 W =4.0 W =4.5 W =5.0
0.038
0.032 2
4
6 hidden units
8
10
Figure 3.7: Choice of τ in EExp for New Thyroid.
were performed with positive and negative values (denoted τ + and τ − ). Note that the EExp results with τ − corresponds to applying the Z-EDM algorithm.
We found that, in general, the best choices for τ − were low values (usually
τ − = −10), with the exception of Wdbc, where τ − = −1.2. This was also the best result (with 2 hidden units) among all the cost functions, a result that was already found and reported in [99]. These findings show that the flexibility of EExp provides a valuable option to the usual cost functions. We also used τ + = 100 and τ − = −100 to verify if EExp behaves like MSE. These results are
denoted Exp ↔ M SE(+) and Exp ↔ M SE(−), respectively. We also varied γ in ESM F . The values used were {2, 4, 6}, but we found no evident advantage in higher values than γ = 2. Table 3.3 shows the results for selected numbers of hidden units (denoted hid) in [2, 20] with the aim of better illustrating the similarities and differences between the several cost functions. The results are reported in this way: “test error(std. deviation)-epoch”. We start by observing that the results of EExp for τ + = 100 and τ − = −100
79
3.2. THE PRINCIPLE OF DENSITY MAXIMIZATION
Table 3.3: Results from the application of Procedure 1 to six data sets given in the form “%test error(standard deviation)-number of epochs”. Ionosphere τ + = 2, τ − = −10, α = 0.5, γ = 4 hid
2
7
10
Wine τ + = 5, τ − = −10, α = 0.5 2
3
6
EM SE
12.60(0.90)-15
12.50(0.89)-11
12.63(0.98)-10
2.37(1.06)-17
2.13(1.00)-16
1.99(0.91)-14
ECE
12.26(1.38)-89
12.23(1.28)-81
12.21(1.15)-57
2.64(1.25)-23
2.10(1.03)-20
2.02(0.95)-18
EExp
12.32(1.38)-63
12.31(1.21)-37
12.30(0.98)-24
2.38(1.11)-15
2.12(0.95)-13
1.96(0.89)-13
EM oller
12.33(1.34)-67
12.29(0.98)-28
12.35(1.04)-28
2.33(1.03)-20
2.12(0.92)-18
1.95(0.88)-18
EZEDM
12.66(0.89)-17
12.53(0.91)-12
12.66(0.97)-12
2.46(1.01)-22
2.17(1.02)-17
2.01(0.91)-16
ESM F
12.56(1.03)-10
12.54(0.87)-10
12.54(0.89)-9
-
-
-
Exp ↔ M SE(−)
12.59(0.89)-15
12.52(0.90)-11
12.61(0.94)-11
2.35(1.12)-17
2.11(0.98)-16
1.97(0.91)-15
Exp ↔ M SE(+)
12.63(0.95)-15
12.50(0.90)-11
12.61(0.95)-13
2.35(1.01)-17
2.16(0.94)-15
1.97(0.91)-14
New Thyroid τ + = 0.1, τ − = −10, α = 5
Liver τ + = 10, τ − = −10, α = 0.1, γ = 2
hid
2
4
8
17
18
19
EM SE
4.69(1.63)-137
4.23(1.40)-126
4.17(1.16)-108
28.89(1.85)-81
28.86(1.89)-83
28.75(1.73)-75
ECE
4.26(1.28)-109
4.07(1.06)-44
3.98(1.00)-39
29.37(1.93)-65
29.15(1.91)-66
29.26(1.88)-55
EExp
3.25(1.04)-48
3.21(0.78)-48
3.22(0.89)-47
28.99(1.84)-84
29.05(1.94)-68
28.76(1.87)-76 28.71(1.84)-90
EM oller
3.97(1.04)-148
3.80(0.99)-120
3.81(0.98)-129
28.90(1.88)-93
28.94(1.98)-98
EZEDM
5.46(2.64)-200
4.45(2.04)-149
4.39(1.40)-136
29.01(2.09)-97
28.91(1.75)-91
28.87(1.80)-83
ESM F
-
-
-
29.10(1.87)-60
28.87(1.80)-71
28.86(1.78)-76
Exp ↔ M SE(−)
4.73(1.69)-200
4.22(1.38)-135
4.19(1.20)-129
28.81(1.86)-74
28.83(1.93)-89
28.74(1.69)-74
Exp ↔ M SE(+)
4.54(1.55)-186
4.16(1.13)-117
4.13(1.09)-92
28.89(1.83)-77
28.78(1.83)-73
28.94(1.75)-88
Wdbc τ + = 9, τ − = −1.2, α = 0.1, γ = 2
Olive τ + = 5, τ − = −10, α = 0.5
hid
2
3
4
2
3
6
EM SE
2.57(0.55)-12
2.56(0.53)-13
2.59(0.53)-13
5.55(0.62)-111
5.41(0.62)-103
5.27(0.57)-108
ECE
2.51(0.54)-14
2.58(0.53)-15
2.57(0.50)-14
5.50(0.67)-56
5.37(0.62)-65
5.29(0.65)-56 5.28(0.60)-93
EExp
2.57(0.53)-11
2.58(0.51)-12
2.59(0.53)-12
5.39(0.62)-93
5.30(0.59)-104
EM oller
2.56(0.53)-27
2.54(0.53)-29
2.56(0.54)-29
5.49(0.67)-113
5.46(0.67)-92
5.26(0.58)-94
EZEDM
2.49(0.57)-17
2.53(0.58)-19
2.55(0.60)-19
5.61(0.63)-121
5.53(0.72)-96
5.38(0.62)-103
ESM F
2.62(0.56)-10
2.62(0.54)-11
2.64(0.61)-11
-
-
-
Exp ↔ M SE(−)
2.56(0.54)-12
2.56(0.53)-13
2.59(0.55)-14
5.55(0.62)-111
5.41(0.62)-104
5.28(0.60)-113
Exp ↔ M SE(+)
2.58(0.55)-12
2.56(0.53)-13
2.58(0.55)-13
5.55(0.58)-100
5.39(0.64)-90
5.28(0.58)-104
are similar or equal to the ones obtained with MSE, which means that EExp is indeed emulating MSE. Also, by choosing an appropriate value of τ ∈ R and thus, controlling the steepness of the cost function, EExp can perform equally or even better than the CE cost function. EExp also compares favorably to EM oller .
80
CHAPTER 3. NN WITH ERROR PDF ESTIMATION
We point out the results obtained in New Thyroid: EExp achieves the best result, improving the solution at least 15% over the other methods (statistically significantly better at 5% probability level). Here, we may also see that the number of epochs used is approximately 3 times smaller than the other error functions. We should also emphasize that the EExp results exhibit similar or even lower standard deviations than the other methods, which suggests a lesser dependency on the train/test partitions. At the same time, this same aspect is an indication that EExp is not very sensitive to the choice of optimal τ . As a matter of fact, we noticed in all experiments that a change of τ of roughly 50% had no influence in the results. For instance, for the Ionosphere data set practically the same results were obtained for τ ∈ [1.5, 3]. However, each data set can have its own best value of τ . The function ESM F also performed well in the two-class problems. However, it should be extended to the multi-class case to be better evaluated.
3.2.3.2
Procedure 2
For data sets with more than 600 cases, a different procedure was applied. Now, the data set is divided in training (50%), validation (25%) and test (25%) sets. For each data set, networks with 2 to 20 hidden units are trained during 1000 epochs. This is repeated 100 times with different initial weights and train/validation/test partitions. The test set error at the epoch of minimum mean validation error is reported. The same partitions are kept through the different cost functions. For this procedure we excluded ESM F and EExp for
τ + = 100 and τ − = −100.
Choosing the value of τ and α The strategy of how to choose the best value for τ and α was the same as above. However, the choice is now ruled by the minimum validation set error.
81
3.2. THE PRINCIPLE OF DENSITY MAXIMIZATION
Table 3.4: Results from the application of Procedure 2 to six data sets given in the form “%test error(standard deviation)-number of epochs”. Pima τ + = 0.5, τ − = −10, α = 4 hid
2
Pb12 τ + = 9, τ − = −10, α = 0.1
3
6
2
4
8
EM SE
24.48(3.17)-93
25.09(2.75)-61
25.36(2.83)-46
10.49(8.22)-999
11.66(12.07)-956
13.96(16.62)-990
ECE
23.45(2.64)-31
23.61(2.41)-38
23.26(2.67)-34
7.74(1.89)-941
7.54(1.83)-380
7.19(1.70)-486
EExp
23.36(2.79)-26
23.23(2.79)-22
23.38(2.90)-23
8.02(2.24)-427
7.40(1.80)-642
7.10(1.78)-995
EM oller
23.42(2.78)-67
23.43(3.02)-110
23.30(2.80)-87
7.99(2.54)-937
7.50(1.82)-597
7.17(.189)-743
EZEDM
23.35(2.74)-67
23.44(2.65)-27
23.22(2.68)-24
8.66(4.50)-974
7.72(1.97)-253
7.56(1.92)-704
Spambase τ + = 5, τ − = −10 α = 0.1
Vowelc τ + = 3, τ − = −10, α = 2
hid
3
4
6
18
19
20
EM SE
7.85(0.77)-942
7.88(0.75)-609
8.07(0.77)-586
35.27(5.41)-1000
35.54(4.95)-991
35.48(6.30)-1000
ECE
6.86(0.58)-107
6.77(0.63)-103
6.65(0.64)-141
13.31(2.46)-340
13.00(2.34)-426
12.06(2.50)-372
EExp
6.86(0.64)-90
6.78(0.61)-129
6.78(0.64)-98
13.10(2.48)-475
12.65(2.61)-514
12.69(2.32)-519
EM oller
6.96(0.73)-306
6.79(0.61)-111
6.72(0.64)-104
13.10(2.48)-475
11.89(2.58)-965
11.53(2.15)-978
EZEDM
7.04(0.72)-249
6.87(0.64)-105
6.80(0.64)-131
18.16(2.84)-876
17.90(2.81)-989
16.56(3.08)-907
Vehicle τ + = 4, τ − = −10, α = 0.3
Ctg16 τ + = 10, τ − = −10, α = 0.1
hid
14
17
20
15
18
20
EM SE
24.15(2.90)-1000
24.32(3.25)-999
24.65(3.11)-942
21.24(4.03)-990
20.52(2.73)-1000
21.09(2.24)-996
ECE
18.57(2.23)-674
18.49(2.60)-743
18.07(2.38)-885
16.51(1.35)-307
16.10(1.47)-400
15.71(1.45)-427 15.59(1.50)-915
EExp
18.57(2.44)-954
18.07(2.50)-962
18.29(2.64)-928
15.70(1.38)-982
15.67(1.35)-974
EM oller
18.53(2.60)-868
18.53(2.46)-1000
18.22(2.57)-937
16.07(1.48)-998
15.65(1.56)-982
15.50(1.31)-967
EZEDM
19.06(2.43)-988
18.62(2.71)-988
18.74(2.24)-901
16.33(1.41)-972
16.20(1.65)-988
16.42(1.36)-783
Table 3.4 shows the results for this experimental procedure as “test error(std. deviation)-epoch of minimum validation error”. We start by observing that MSE performs badly in some data sets: Pb12, Vowelc and Vehicle. This was found to be caused by several non convergent runs of the 100 repetitions. On the contrary, the other cost functions performed well, achieving the generalization errors reported in the literature for these data sets (see the papers cited in [79]). Again, EExp is capable of achieving the best result among the other cost functions and even obtain slight improvements in some cases. For example, in Pb12 for four hidden units or Vehicle with seventeen hidden units, EExp has the lower mean error.
82
CHAPTER 3. NN WITH ERROR PDF ESTIMATION
In conclusion, the fact that EExp is able to emulate the behaviors of classic cost functions and, as a matter of fact, by adjusting only one parameter, an infinite family of cost functions can be implemented with different behavior of the error gradient weighting, reveals itself as a valuable option for practical applications. The EExp function can be plugged into the usual BP algorithm without increasing the computational complexity, revealing good perspectives for software applications. Although EExp was used in data classification with MLPs trained with the BP algorithm, there are no prior reasons precluding its successful use with other training algorithms and/or other types of neural networks in data classification or regression. Several issues concerning theoretical questions (like learning rates, optimality, etc) but also practical ones deserve future attention. A β parameter could be introduced as in EM oller and τ could also be made adaptive by analyzing predefined data properties. This would, in principle, not only extend the flexibility to the training process itself but also relieve the user of the choice of τ .
3.3
Overall Comparison
In this section we present an overall comparison of the risk functionals previously discussed. Although it is always a difficult objective to achieve, we tried as possible to rigourously control the experiments, so that any performance difference could only be attributed to the different functionals being used. We restricted this comparison to two-class problems, both with artificial (checkerboard-type) and real-world data sets. In all experiments with a given data set we used the same MLP architectures, with as many inputs as the number of features, one hidden layer and a single output. The number of hidden neurons, hid, was chosen in order to assure a not too complex network with acceptable generalization. Hence, some guidelines based on preliminary experiments and
83
3.3. OVERALL COMPARISON
Table 3.5: Number of hidden neurons, hid, used for each data set. Data set
hid
Data set
hid
Checkerboard 2×2
4
Ionosphere
4
Checkerboard 4×4
16
Sonar (10)*
10
CHD2
2
Sonar (20)*
20
Pima
9
Liver
8
Wdbc 3 (*)Same dataset but used in two hid-different series of experiments
in the well-known rule of thumb hid = w/ǫ (based on a formula given in [6]), where w is the number of weights and ǫ is the expected error rate, where taken into account. Table 3.5 shows the results of this analysis. Regularization was performed by early stopping according to the same criterion, as follows: for each data set 10 runs were performed in order to determine the optimal number of epochs, Ep, (as well as the optimal smoothing parameter h ˆ S and H ˆ R and τ for EExp ) for each method. The optimal Ep (h, τ ) were for H 2 chosen as those values achieving the minimum mean test error over the 10 runs. In all experiments we used the 2-fold cross validation method as described before. Each experiment consisted of 20 runs of the algorithm. For this purpose twenty different random splits of the data sets were generated and stored. The same twenty different random splits were used as inputs for all MLPs with different risk functionals. This guaranteed that no differences in the results were due to different splits of the data sets. After the 20 runs the mean and standard deviation of the following performance measures were computed: AUC: The area in percentage under the Receiver Operating Characteristic (ROC) curve, which measures the trade-off between sensitivity and specificity in twoclass decision tables (for details, see e.g. [74]). The higher the area the better
84
CHAPTER 3. NN WITH ERROR PDF ESTIMATION
is the decision rule. BCR: The balanced correct defined as 50
TN TP + 50 TN + FP FN + TP
in percentage (T =true; F =false; P =positive; N =negative). COR: The classification correct rate in percentage. The first two measures are based on the resulting 2×2 decision table, considering as “abnormal” class the one with lesser cases.
They are specially suitable
for unbalanced data sets, as the artificial checkerboard data sets, where an optimistically high COR could arise from a too high sensitivity or specificity. AUC and BCR give an adequate picture in those situations. All results were ranked and subject to ”multiple comparison among groups” (post-hoc one-way anova tests) statistical tests, using Tukey’s least significant difference criterion when the test probability was less that the specified significance level (0.05), i.e., when the test was significant (rejecting the null hypothesis of equal means), and the more strict Tukey’s honestly significant difference criterion, otherwise. Based on the statistical tests we were able to decide whether or not a functional that performed better was indeed significantly better (at that significance level) than others with worst performance. The results obtained for the 2×2 and 4×4 checkerboard data sets are shown in Table 3.6. In all tables average values are followed by standard deviations between parentheses. CB2×2(200, 50) means “checkerboard 2×2 data set with a total of 200 cases, 50% of them of the minority class”; likewise for the other checkerboard data sets. In all the tables the best average results are in bold; the statistically significant best are underlined. ˆ S functionals performed For the 2×2 checkerboard data sets the EExp and H better in general than all other functionals (both in average and variance). The
85
3.3. OVERALL COMPARISON
Table 3.6: Results for 2×2 and 4×4 checkerboard data sets. Significantly best results underlined. ECE
EExp
EM SE
ˆS H
ˆR H 2
AUC
97.58 (1.26)
97.89 (2.85)
98.41 (1.08)
84.85 (17.07)
97.13 (4.51)
BCR
91.25 (2.50)
92.94 (4.30)
92.87 (2.48)
86.96 (3.17)
92.48 (3.17)
AUC
98.21 (2.34)
98.89 (1.64)
96.41 (8.30)
99.03 (1.32)
91.88 (10.82)
BCR
92.87 (2.35)
93.29 (3.61)
92.47 (4.73)
94.36 (1.80)
90.70 (5.45)
AUC
97.97 (2.77)
98.94 (2.50)
62.72 (15.92)
95.07 (7.07)
96.15 (6.22)
BCR
83.40 (3.69)
94.14 (5.16)
76.97 (6.51)
90.22 (5.66)
91.80 (4.87)
AUC
85.01 (3.13)
83.89 (3.39)
80.89 (4.96)
77.32 (8.42)
74.39 (6.61)
BCR
79.40 (3.20)
78.54 (3.57)
77.94 (4.39)
73.58 (4.96)
75.59 (5.45)
AUC
89.95 (1.65)
84.11 (6.21)
76.96 (6.88)
71.41 (5.56)
70.63 (6.78)
BCR
82.98 (1.78)
80.21 (3.05)
76.56 (3.96)
70.93 (4.03)
71.20 (3.69)
AUC
91.28 (3.06)
89.72 (4.13)
70.94 (5.37)
68.15 (3.23)
75.44 (5.45)
BCR
80.49 (1.98)
81.47 (3.64)
70.77 (3.63)
67.98 (3.95)
73.04 (2.71)
Data set CB2×2(200,50)
CB2×2(400,25)
CB2×2(1000,10)
CB4×4(200,50)
CB4×4(400,25)
CB4×4(1000,10)
sum of the ranks for the BCR performance index disclosed the following order ˆS, H ˆ R , ECE and EM SE (exaequo). For the 4×4 from best to worst: EExp, H 2 checkerboard data sets the ECE and EExp functionals performed better than all other functionals. The sum of the ranks for the BCR performance index ˆ S and disclosed the following order from best to worst: ECE , EExp, EM SE , H
ˆ R (exaequo). Table 3.7 shows the results for real-world data sets. These data H 2 sets are more challenging in terms of number of features, but less challenging in terms of class unbalance and class topology. For these data sets we chose to
only look to the COR performance index. The sum of the ranks for the COR
86
CHAPTER 3. NN WITH ERROR PDF ESTIMATION
Table 3.7: COR results for real-world data sets.
Significantly best results
underlined. ECE
EExp
EM SE
ˆS H
ˆR H 2
CHD2
83.33 (1.07)
81.72 (1.29)
82.42 (1.08)
82.72 (1.11)
81.77 (1.81)
Pima
76.82 (0.77)
76.76 (0.79)
76.58 (0.88)
76.66 (0.85)
75.84 (0.78)
Ionosphere
88.04 (1.46)
88.37 (1.88)
87.81 (1.21)
87.71 (1.37)
88.50 (1.33)
Liver
69.04 (2.01)
69.80 (1.27)
68.52 (1.97)
69.08 (1.86)
70.32 (1.54)
Sonar (10)
77.93 (2.86)
78.75 (2.84)
77.91 (2.96)
77.76 (2.57)
75.50 (4.35)
Sonar (20)
78.70 (2.60)
78.82 (2.92)
78.82 (2.51)
79.18 (2.50)
77.43 (3.01)
Wdbc
97.44 (0.55)
97.21 (0.68)
97.39 (0.67)
97.36 (0.66)
96.89 (0.42)
Data set
performance index disclosed the following order from best to worst: ECE , EExp,
ˆ S , EM SE , H ˆ R . In general, taking into account the sum of ranks for the COR H 2 performance index for all data sets, the best functional was EExp .
Chapter 4
Theoretical Analysis of MEE: the Discrete Errors Case In this chapter we start a theoretical analysis of the MEE principle when applied to the classifier problem. We deal with threshold-type machines (the split-type and perceptron settings) and consequently with the case of discrete errors. Several results are obtained and demonstrated, characterizing some class configurations where MEE solves the classifier problem and others where it does not. Some important Theorems regarding the correspondence between MEE and min P e solutions are obtained [102].
4.1
General Setting
We consider two-class classification problems with class-conditional distributions given by FX|t (x) = P (X ∈] − ∞, x]|T = t), t ∈ {−1, 1}, where X and T are univariate input and target random variables, respectively, and fX|t (x) the corresponding probability density functions. The machine to be considered is 87
88
CHAPTER 4. MEE WITH DISCRETE ERRORS
equipped with a threshold-type activation function. Note that, from a previous discussion, given the definition of T the appropriate activation is defined by the sign function. We define the error variable E = T − Y , as the difference between the target and the classifier’s output and notice that E ∈ {−2, 0, 2}, that is, E = −2 and E = 2 mean a misclassification for class C-1 and C1 , respectively, and E = 0 means correct classification. As we are dealing with a discrete P random variable, the formula for discrete entropy (2.56) is used, k pk log pk .
In this case, each pk corresponds to the probability of E taking one of the values {−2, 0, 2} which are precisely the probabilities of error Pt for each class P and the probability of correct classification, 1− t Pt , that is, P-1 = P (E = −2), P1 = P (E = 2) and 1 − P-1 − P1 = P (E = 0). Thus, the Shannon entropy of E
is written as h i HS = − P-1 log P-1 + P1 log P1 + (1 − P-1 − P1 ) log (1 − P-1 − P1 ) .
(4.1)
We start by studying the case of a split-type machine.
4.2
Split-type Setting
The simplest possible linear discrimination rule corresponds to a classifier output, y, as y′ x ≤ w0 , y(x) = −y ′ x > w 0
(4.2)
where w0 is a data splitting threshold and y ′ ∈ {−1, 1} is a class label. We recognize formula (4.2) as the simplest version of the perceptron discussed in section 2.3.1 (see formula (2.39)). The theoretic optimal rule corresponds to a split point w0∗ and class label y ∗ such that: (w0∗ , y ∗ ) = arg min P (y(X) 6= T ),
(4.3)
89
4.2. SPLIT-TYPE SETTING with minimum probability of error, P ∗ , given by n
∗
P = inf I
y ′ =−1
� � pFX|1 (w0 ) + q(1 − FX|-1 (w0 )) + � �o + Iy′ =1 p(1 − FX|1 (w0 )) + qFX|-1 (w0 ) , (4.4)
for priors p and q. In (4.4), the first term inside braces corresponds to the situation where P ∗ is reached when y ′ = −1 is at the left of w0 ; the second term corresponds to swapping the class labels. A split given by (w0∗ , y ∗ ) is called a
theoretical Stoller split [16, 107]. What does it mean to minimize the error entropy in this situation? Does it lead to the optimal solution for the class of linear threshold decision rules represented by (4.2)? Denoting FX|t (w0 ) simply as FX|t and considering from now on and without loss of generality that y ′ = −1, that is, we assume that C-1 is at the left of C1 , one has P-1 = P (E = −2) = q (1 − FX|-1 ), P1 = P (E = 2) = p FX|1 ,
(4.5)
1 − P-1 − P1 = P (E = 0) = qFX|-1 + p (1 − FX|1 ). In this sense, HS is a function of w0 (although we omit this dependency for notation simplicity.
In the following we study the behavior of HS (w0 ) by
considering different situations of input distributions.
4.2.1
MEE Splits for Uniform Distributions
As a first case, we consider that the two classes have univariate uniform distributions defined by fX|-1 (x) =
1 I (x), b − a [a,b]
fX|1 (x) =
1 I (x), d − c [c,d]
(4.6)
90
CHAPTER 4. MEE WITH DISCRETE ERRORS
f−1
1/(b−a)
f1
1/(d−c)
a
c
b
d
Figure 4.1: Schematic drawing of the simple problem of setting w0 to classify two uniform overlapped classes. where IA (x) is the indicator function. We first assume that the classes overlap, such that a < c ≤ b < d. Figure 4.1 depicts this situation in terms of the density functions fX|t (x). For this problem and making use of the formulas in (4.5), it is straightforward to compute HS as in (4.1) for w0 varying on the real line. Indeed, one has HS (w0 ) = q log q + 0 log 0 + p log p , � � � � � � b−w0 w0 −a w0 −a b−w0 log q + p log q + p , + 0 log 0 + q q b−a b−a � b−a � � b−a � q b−w0 log q b−w0 + p w0 −c log p w0 −c + b−a b−a d−c � d−c � � � − w −a d−w d−w0 w0 −a 0 0 + q + p + p log q , b−a d−c b−a d−c � � � � � � 0 log 0 + p w0 −c log p w0 −c + q + p d−w0 log q + p d−w0 , d−c d−c d−c d−c 0 log 0 + p log p + q log q,
w0 < a w0 ∈ [a, c[ w0 ∈ [c, b[ w0 ∈ [b, d[ w0 ≥ d
where the usual convention1 0 log 0 = 0 is considered. Figure 4.2 (dashed line) shows some examples for p = 1/2, [a, b] = [0, 1] and different values of c and d. First, one can see that although within each interval of w0 (corresponding to the different cases above), HS is a concave function, as a whole HS is not concave. 1
Based on L’Hopital’s rule.
91
4.2. SPLIT-TYPE SETTING
0.7 0.7 0.5
0.5
HS
P
0
0
0.7 1
1.7
w0
0.3
0
0
(a)
0 3
w0
0.7 1
(b) 0.9 0.7
0.5
0.5
HS
P
0
0 0
1
(c)
1.7
w0
0
0 0.2
1
1.7
w
0.5
0
(d)
Figure 4.2: Shannon entropy (dashed line) and probability of error (solid line) plotted as functions of w0 .
Second, whenever the overlap is non degenerate (all figures of Figure 4.2 except 4.2c), we have two local minima located at the extremes of the overlapped regions. A local maximum (global in some cases, as in Figure 4.2d), say w ¯0 , is located within the overlapped region. If we have equal support for the two distributions (and equal priors), entropy is perfectly symmetric at w ¯0 and this is exactly the midpoint of the overlapped region (Figure 4.2a). In the other cases, we have a local and a global minimum and w ¯0 is deviated towards the former. Let us now determine the probability of error P for this example. Making use
92
CHAPTER 4. MEE WITH DISCRETE ERRORS
of the above expressions we have q, b − w0 q , b−a w0 − c b − w0 P (w0 ) = P-1 (w0 ) + P1 (w0 ) = +p , q b − a d − c w0 − c p , d−c p,
w0 < a w0 ∈ [a, c[ w0 ∈ [c, b[ .
(4.7)
w0 ∈ [b, d[ w0 ≥ d
Figure 4.2 (solid line) plots P as a function of w0 for the same values of a, b, c and d. One can see that the global minimum of the error entropy corresponds to the theoretical Stoller split. In fact, for this problem, it also corresponds to the optimal decision in the Bayes sense. If we take the special case where b−a = d−c (Figure 4.2a), using the minimum probability of error criteria, we may locate w0∗ anywhere in [c, b]; for entropy it is preferable to choose either w0∗ = c or w0∗ = b. The reason is that the choice w0∗ ∈]c, b[ increases the uncertainty or instability of the system. At c or b, E only takes two values of the set {−2, 0, 2}, otherwise E can assume every value in that set, which implies an increase in entropy. In other words, entropy prefers to classify correctly one class and leave all the errors to the other one. Figure 4.2 can be easily reproduced for unequal priors, where the general behavior is the same. In fact, we can show that Theorem 4. (Lu´ıs Silva et al. [102]) Suppose we have two overlapped uniform distributions as in (4.6) such that a < c ≤ b < d. HS and P have the same global minimum.
Proof. Consider the P-1 × P1 plane. First, notice that an error probability path, Ppath , produced by P as in (4.7) is always composed of 3 linear segments: two along the axes connected by the remaining one (in some situations degenerated to one point). Second, notice that HS , as a function of the probabilities (surface
93
4.2. SPLIT-TYPE SETTING
0.5 0.6 0.6
0.4 P
Ppath
P1
HS
0.4
0.2 0.1
0.1
(PA)
0
0.2 (PB)
PŦ1
(a)
0.6
0
0
2/3 1
2
w0
0.2
(b)
Figure 4.3: (a) Contours of HS (filled with a gray colormap where brighter colors correspond to higher values) and a general path, Ppath , produced by P . Also shown, some contours for P = P-1 + P1 = const. (b) P and HS plotted as functions of w0 for the Ppath in (a).
contours in Figure 4.3a), is concave and symmetric about the vertical plane P-1 = P1 . Therefore, the global minimum of HS constrained to Ppath always coincides with the global minimum of the probability of error.
The above demonstration can be illustrated using Figure 4.3, where the contour lines of HS are plotted as functions of P-1 and P1 . The solid line represents Ppath (Figure 4.3b plots P and HS as functions of w0 for this path) and the dashed lines are contours of equal probability. The solution to the problem min HS subject to Ppath corresponds to the min HS point in the curve obtained by intersecting the HS surface with the vertical plane passing through PA and PB . Thus, the sought for minimum can only occur at the curve ends (either PA or PB or both). When we have separable classes it is obvious that we should set w0∗ anywhere in ]b, c[. The minimum entropy value (HS = 0) also occurs in that interval because
94
CHAPTER 4. MEE WITH DISCRETE ERRORS
P (E = 0) = 1. Again we are led to the minimum probability of error.
4.2.2
MEE Splits for Mutually Symmetric Distributions
We now progress to the study of MEE single splits for continuous pdf’s, which was not the case of the uniform pdf’s above. In particular, we will need to define the special case of two-class problems with mutually symmetric input pdf’s. We start by characterizing the critical points (roots of the first derivative) of HS . Critical Points of the Error Entropy Suppose the two classes Ct , t ∈ {−1, 1} are represented by arbitrary continuous pdf’s, fX|t (see Figure 2.1a in section 2.1).
We define the center at of a
distribution as its median. Let us consider, without loss of generality, that class C1 is centered at 0 and the center of class C-1 lies in the non-positive part
of the real line. We are looking for the relations between the Stoller split w0∗
and the split obtained by minimizing error’s entropy. The following result is a starting point by relating w0∗ to the critical points of HS . Theorem 5. (Lu´ıs Silva et al. [102]) In the univariate two-class problem, the Stoller split w0∗ is a critical point of the error entropy if the error probabilities of each class at w0∗ are equal. Proof. From formula (4.1) one derives � dH = qfX|-1 log (P-1 ) − qfX|-1 − pfX|1 log (1 − P-1 − P1 ) − pfX|1 log (P1 ) . dw0
A critical point of HS must satisfy
� � log P /(1 − P − P ) -1 -1 1 p fX|1 dH � �. =0⇔ = dw0 q fX|-1 log P1 /(1 − P-1 − P1 )
(4.8)
If the densities are continuous the Stoller split w0∗ is obtained either at a pfX|1 vs qfX|-1 intersection, pfX|1 (w0∗ ) = qfX|-1 (w0∗ ), or at +∞ or -∞ (cf. Theorem 1,
95
4.2. SPLIT-TYPE SETTING
section 2.1). In the latter case, the error probabilities of each class are unequal. In the former case, we have, from (4.8) pfX|1 (w0∗ ) = qfX|-1 (w0∗ ) ⇔ P-1 (w0∗ ) = P1 (w0∗ ),
(4.9)
where P-1 (w0∗ ), P1 (w0∗ ) are the probabilities of error of each class with split point at w0∗ .
The above result states the conditions for a correspondence between the Stoller split and an entropy extremum. It shows that the MEE principle cannot be applied in general situations. Moreover, Theorem 5 says nothing about the nature (maximum or minimum) of the critical point. As we will see, the obtained solution is not guaranteed to be an entropy minimum. We first illustrate the above Theorem with a simple example. Example: Take the situation depicted in Figure 4.2a for uniform input distributions, restricted to the overlapped region [c, b] = [0.7, 1] (to ensure derivability). The Stoller split can be at any point of this interval but the critical point (in this case a maximum) of entropy occurs at the middle point of that interval, which corresponds precisely to the split where the two classes have equal error probabilities. To further evaluate the nature of the critical points obtained in Theorem 5, we 2 analyze the sign of ddwH2S ∗ . One has 0
dfX|-1 d2 HS log =q 2 dw0 dw0
�
w0
P-1 1 − P-1 − P1 −
�
dfX|1 log −p dw0
2 2 2 q 2 fX| -1 + p fX|1
1 − P-1 − P1
�
−
P1 1 − P-1 − P1 2 q 2 fX| -1
P-1
−
�
−
2 p2 fX|1
P1
. (4.10)
In order to deal with expression (4.10) we make a simplification by restricting to the case of mutually symmetric distributions defined by the following
96
CHAPTER 4. MEE WITH DISCRETE ERRORS
Definition 1. Two class distributions represented by probability densities g1 and g2 and priors p and q respectively, are said to be mutually symmetric if pg1 (a1 − x) = qg2 (x − a2 ) where at is the center of the density gt . It is easy to see that, if fX|-1 and fX|1 are mutually symmetric, one has dfX|1 dfX|-1 =−p . (4.11) q dw0 w∗ dw0 w∗ 0
0
In the conditions of Theorem 5 one has
pfX|1 (w0∗ ) = qfX|-1 (w0∗ ) and P-1 (w0∗ ) = P1 (w0∗ ).
(4.12)
For notation simplicity, one defines pfX|1 (w0∗ ) ≡ f and P1 (w0∗ ) ≡ P and (4.10) can be simplified and re-written as ! � d2 HS f2 P df . + log = −2 dw0 w∗ 1 − 2P P dw02 w∗
(4.13)
0
0
Therefore, for mutually symmetric distributions we only need to analyze what happens at one side of one of the distribution centers (in this case a1 ). Since we have set a1 = 0, w0∗ occurs at half distance of the median of C-1 to the origin, somewhere in ] − ∞, 0]. Let2
Q(w0∗ ) =
df P f2 log + . dw0 1 − 2P P
(4.14)
The function Q(w0∗ ) plays the key role in the analysis of the error entropy critical points. If the classes are sufficiently distant, i.e., C-1 slidding to the left (w0∗ → −∞ or w0∗ tends to the infimum of the support of C1 ), then
df dw0
> 0 and we can
rewrite expression (4.14) as Q(w0∗ )
df = dw0
f2 P + df log 1 − 2P dw0 P
!
.
(4.15)
Using the results given in Appendix D, the second term between brackets is finite, while P can be made sufficiently small such that the first term is greater 2
We let fall the dependency of the derivative on w0∗ in order to simplify notation.
97
4.2. SPLIT-TYPE SETTING
in absolute value than the second one. Thus, Q(w0∗ ) < 0 and (4.13) is positive. Hence the Stoller split w0∗ is an entropy minimum. If the classes are sufficiently close, i.e., C-1 slidding rightwards (w0∗ → 0), there are three situations to consider. Define xM and xm as the abcissas where f has the mode and the median, respectively. Then 1. xM = xm . In this case, f is symmetric and by the continuity of Q(·) df and the fact that Q(xM ) > 0 (since dw = 0), Q(w0∗ ) is positive in a 0 xM
neighborhood of xM .
2. xM < xm . Again, Q(w0∗ ) > 0 in a neighborhood of xM , because Q(xM ) > 0. 3. xM > xm . We have no guarantee on a sign change in Q(w0∗ ). The first two situations show that Q(w0∗ ) changes its sign, which means that the Stoller split turns to be an entropy maximum if the distributions are close enough. In the third situation we may have or not a sign change of Q(w0∗ ). In fact, as shown below for the special case of input lognormal distributions, we have situations where there is always an entropy minimum in an intersection of the posterior densities, but the Stoller split changes its location as the distributions get closer. Furthermore, for each probability distribution, the ratio w0∗ /∆ between the possible solution of Q(w0∗ ) = 0 and the distribution’s scale ∆, is a constant. In fact, for two variables X and Y , with Y = ∆ · X (Y is a scaled version of X), we have FY (y) = FX (y/∆), 1 fY (y) = fX (y/∆) , ∆ � �2 1 dfX dfY = . dy y ∆ dx y/∆
(4.16)
98
CHAPTER 4. MEE WITH DISCRETE ERRORS
Substituting in expression (4.14) we get fY2 (y) dfY FY (y) + = 0 ⇐⇒ log dy y 1 − 2FY (y) FY (y) ! � �2 2 (y/∆) FX (y/∆) fX dfX 1 log + = 0. ∆ dx y/∆ 1 − 2FX (y/∆) FX (y/∆)
(4.17)
Thus, the solution is w0∗ (Y )/∆ = w0∗ (X).
Critical Points for Some Distributions We present three specific examples of univariate split problems that illustrate the results of previous sections. In the first two examples, for the triangular and Gaussian distributions, we determine the minimum distance between the classes such that the Stoller split is an entropy minimum. We define d/∆ as a normalized distance between the centers of the two classes where d = a1 − a-1 and ∆ is the distribution’s scale. Remember from the end of last section that it is only needed to set ∆ = 1. We also set p = q = 1/2 in all examples. The third example shows that one can have an entropy minimum in an intersection point where the probabilities of error are equal, but it is not the location of the Stoller split. The Triangular Distribution Case The triangular density function with width (scale) ∆ is given by 0, x∆
(4.18)
Setting ∆ = 1, class C1 is centered at 1/2 and class C-1 is moving between −1/2
and 1/2. The Stoller split occurs at w0∗ = (1/2 + a-1 ) /2. Carrying out the
computation of Q(w0∗ ) one finds that w0∗ will be a minimum of entropy if 2 log
1 w0∗2 + 4 < 0 ⇔ w0∗ < √ ∗2 2 1 − 2w0 e +2
(4.19)
99
4.2. SPLIT-TYPE SETTING
and a maximum otherwise. Thus, for any ∆, the Stoller split is an entropy minimum if d 2 >1− √ ≈ 0.3473. ∆ e2 + 2
(4.20)
The Gaussian Distribution Case For Gaussian distributions one has at = µt where µt is the distribution mean of class Ct . Q(w0∗ ) can be easily re-written as a function of d. Indeed, setting ∆≡σ=1 Q(w0∗ )
d ≡ log 2
�
1 − Φ(d/2) 2Φ(d/2)
�
� exp −d 2 /8 √ , (1 − Φ (d/2)) + 2π
(4.21)
where Φ(·) is the standard Gaussian cumulative distribution function. If d is below some value, expression (4.21) will be positive and the Stoller split is an entropy maximum. If it is above, the Stoller split is an entropy minimum. This turning value was numerically determined to be tvalue = 1.405231264. The Lognormal Distribution Case The lognormal distribution has density (log x − µ)2 g (x|µ, σ) = exp − 2σ 2 xσ 2π 1 √
�
�
.
(4.22)
We consider the problem where fX|-1 (x) ≡ g(x) and fX|1 (x) ≡ g(−x + a-1 + xm ) where xm ≡ a1 is the center (median) of fX|1 . Note that this is precisely
the situation 3 (xM > xm ) mentioned in section 4.2.2, with xm = eµ and 2
xM = eµ−σ . Figure 4.4 shows the splitting problem in two different conditions: in Figure 4.4a the distributions are distant and in Figure 4.4b the distributions have the inner intersection point at their centers. We found that this intersection is always an entropy minimum (thick solid line) but the Stoller split moves to one of the outer intersections (as we can see from the minimum probability of error curve represented by the dashed line) as the distributions get closer. This illustrates the way Theorem 5 was enunciated, because one can have an
100
CHAPTER 4. MEE WITH DISCRETE ERRORS
0.98 0.6
0.6
1.06
P*
P*
HS qf
0 Ŧ2
qfŦ1
pf
Ŧ1
1
2
6
0.92 10
0 Ŧ2
(a)
H
pf
S
1
2
6
0.92 10
(b)
Figure 4.4: The lognormal distribution case. (a) If the distributions are distant the Stoller split is an entropy minimum at the inner intersection. (b) The inner intersection is still an entropy minimum but the Stoller split is at one of the outer intersections.
intersection point with equal probabilities of error and thus an entropy critical point, but it may not correspond to the Stoller split intersection.
4.2.3
MEE Splits in Practice
In this section we evaluate, in practice, the ability of the MEE principle to perform classification in a single-split setting. The results are compared with the ones obtained by using MSE. The empirical Stoller split and MSE In section 2 we discussed how to obtain a theoretical Stoller split (or any other more complex decision) for a given problem when the class-conditionals are known. However, in practice, one has only available a set of examples whose distributions are in general unknown. Stoller [107] proposed the following
101
4.2. SPLIT-TYPE SETTING practical rule to choose (w0 , y ′ ) such that the empirical error is minimal (w0 , y ′ ) =
N � 1 X I{Xi ≤x,Ti 6=y} + I{Xi >x,Ti 6=−y} . (x,y)∈R×{−1,1} N
arg min
(4.23)
i=1
The probability of error of Stoller’s rule converges to the Bayes error for N → ∞ [16]. If we take the MSE cost function EM SE = c
N X i=1
(ti − yi )2 ,
(4.24)
where c is a constant3 , it is easy to see that it is equivalent to Stoller’s rule (4.23), in the sense that the same discrimination rule (4.2) is determined. In fact,
EM SE = c
= c = 4c
X
Xi ∈C-1
X
Xi ∈C-1
N X i=1
(ti − yi )2 + 4I{Xi >x} +
X
X
Xi ∈C1
Xi ∈C1
(ti − yi )2
(4.25)
4I{Xi ≤x}
(4.26)
� I{Xi ≤x,Ti 6=−1} + I{Xi >x,Ti 6=1} ,
(4.27)
which is the same as in (4.23) if we take c = 1/4N and use the convention that class C-1 is at the left of the splitting point. Thus, the solution to (w0 , y ′ ) =
arg min (x,y)∈R×{−1,1}
EM SE
(4.28)
is the same as in (4.23). MEE Empirical Procedure We have to develop a practical rule to minimize (or maximize, depending on the conditions of the problem) the error entropy given in (4.1). Recall that � � Z −∞ Z w0 fX|-1 (s)ds , (4.29) P-1 ≡ P-1 (w0 ) = qfX|-1 (s)ds = q 1 − −∞ w0 Z w0 fX|1 (s)ds. (4.30) P1 ≡ P1 (w0 ) = p −∞
3
The value of c (which can be 1/N for MSE definition or 1/2 for derivative simplification
reasons) has no influence on the minimization of the cost function.
102
CHAPTER 4. MEE WITH DISCRETE ERRORS
The above class-conditionals are to be estimated with the (Gaussian) kernel density estimator � � (x − xi )2 1 X 1 √ exp − . fX|t (x) ≈ Nh 2h2 2π x ∈C i
(4.31)
t
Hence Z
w0
� � 1 X w0 − xi fX|t (s)ds ≈ Φ , N h −∞
(4.32)
xi ∈Ct
where Φ(x) is the standardized Gaussian cumulative distribution function at x. Expression (4.32) is used to compute and optimize HS (w0 ) and expression (4.23) is used to obtain the optimal solution for MSE. The optimization algorithm we have used in our experiments is based on the Golden Section search with parabolic interpolation [81]. Experiments Simulated data: the two-class Gaussian problem We first study how the MEE principle works with simulated Gaussian data, where all the conditions can be controlled. To ensure the conditions of Theorem 5, two classes with Gaussian distribution only differing in location (σ was set to 1) were generated. We also set p = q = 0.5. Several experiments were made varying the normalized distance d/σ between classes. Taking into account the tvalue for Gaussian classes, the distance values were chosen so as to have a maximization problem (d/σ = 1) and two minimization problems (d/σ = 1.5 and 3), one of them with d/σ very close to tvalue . We also varied the number of available training (# train) and test (# test) patterns for each class. The solution was determined both for MEE and MSE with the training set and tested with the test set over 1000 repetitions. To determine the value of h to use in each problem, we conducted preliminary experiments where we varied h in order to choose the best one. The final values used were h = 1.7, 0.1 and 0.8 for d = 1, 1.5 and 3, respectively. As these problems can be solved optimally,
103
4.2. SPLIT-TYPE SETTING
Table 4.1: Test error (%) and standard deviations (in parenthesis) obtained with MEE and MSE for the simulated Gaussian data. Different values of d were used and the Bayes error was determined for each case. Underlined results are not statistically different from the Bayes error. d=3
Bayes error: 6.68%
# train # test
100 MEE
1000 MSE
MEE
100000 MSE
MEE
MSE
50
6.79(2.41) 7.02(2.59)
6.75(2.51) 6.72(2.60)
6.75(2.51) 6.66(2.41)
500
6.82(0.83) 7.07(1.00)
6.70(0.81) 6.76(0.81)
6.66(0.81) 6.69(0.81)
5000
6.81(0.30) 7.11(0.59)
6.69(0.25) 6.72(0.27)
6.68(0.25) 6.67(0.25)
50000
6.81(0.20) 7.11(0.60)
6.69(0.08) 6.74(0.13)
6.68(0.08) 6.68(0.08)
d = 1.5
Bayes error: 22.66%
# train # test
100 MEE
1000 MSE
100000
MEE
MSE
MEE
MSE
50
25.23(4.65) 23.22(4.22)
24.67(4.58) 22.74(4.23)
22.61(4.21) 22.54(4.10)
500
25.33(2.75) 23.30(1.54)
24.82(2.48) 22.84(1.36)
22.83(1.38) 22.67(1.32)
5000
25.32(2.49) 23.22(0.84)
24.72(2.15) 22.82(0.48)
22.80(0.46) 22.68(0.42)
50000
25.46(2.54) 23.27(0.77)
24.83(2.21) 22.81(0.23)
22.82(0.24) 22.67(0.13)
d=1
Bayes error: 30.85%
# train # test
100 MEE
1000 MSE
MEE
100000 MSE
MEE
MSE
50
30.63(4.64) 31.56(4.60)
30.90(4.48) 31.05(4.61)
30.70(4.82) 30.69(4.56)
500
30.95(1.39) 31.54(1.62)
30.88(1.45) 31.01(1.46)
30.80(1.49) 30.75(1.44)
5000
30.93(0.47) 31.37(0.84)
30.87(0.47) 31.04(0.50)
30.84(0.46) 30.84(0.45)
50000
30.93(0.17) 31.39(0.70)
30.86(0.14) 31.02(0.26)
30.85(0.14) 30.86(0.15)
in the Bayes sense, by an unique split, we’ve determined the Bayes error for each experiment for comparison purposes. Table 4.1 shows the mean values and standard deviations for the test error of each experiment.
104
CHAPTER 4. MEE WITH DISCRETE ERRORS
For d = 1 and d = 3, both MEE and MSE achieve Bayes discrimination if the training sets are asymptotically large, with slightly better results for MEE. However, with small training sets, MEE outperforms MSE (statistically significant differences at level 5%). In fact, we encounter lower test error and standard deviations, which means that MEE solutions have more stability and more generalization capability. Increasing the number of test patterns has the major effect of decreasing the standard deviation of the error estimates. In this sense, the results for d = 1.5 were quite unexpected. As we can see, the results of MEE are always worse than with MSE, mainly for small sample sizes. Further investigations revealed that the problem was due to the proximity of d = 1.5 to the turning value. The estimate of entropy has high variance and the location of extrema is highly dependent on the value of h. To solve this problem we investigated the possibility of transforming the minimization problem into a maximization problem getting a more accurate and stable procedure. This is achieved by increasing the value of h. We recall that, estimating a density function using the kernel method leads to a pdf estimate with mean µ ˆ and variance σ ˆ 2 , such as µ ˆ=x ¯,
σ ˆ 2 = h2 + s2 ,
(4.33)
where x ¯ is the data sample mean, s2 is the sample variance and a pdf with variance h2 is used as kernel function (cf. formula (2.33) in section 2.2.2). When h is too small, the kernel estimate has large variance leading to a nonsmooth entropy function. When h is large, we have an oversmoothed density, but entropy is smooth and preserves the extrema. Figure 4.5 depicts this dichotomy. In Figures 4.5b and 4.5c, the values of h are given by the optimal rule for Gaussian distributions (formula (2.36) in section 2.2.2) and by expression (4.35) with c = 3 (see below), respectively. The vertical solid line shows the theoretical Stoller split for the problem. It is important to note that this is a minimization problem. In practice, the increased h has the effect of approximating the classes and thus the maximum instead of the minimum in Figure 4.5c. This means that
105
4.2. SPLIT-TYPE SETTING
0.8
0.9
1
H
S
0.5 Ŧ2
3 w
0.6 Ŧ2
(a) h = 0.2
3
w
0
0.7 Ŧ2
w
3
0
0
(b) h = 0.498
(c) h = 2.27
Figure 4.5: Error entropy for different values of h in the Gaussian distribution example with d = 1.5. it is more efficient to maximize entropy also when d/σ is close to the turning value. To set h in order to have a maximization problem, it is sufficient to ensure that d tvalue ≈ , σ c
(4.34)
where c > 1 and σ is the standard deviation of the estimated density. Thus, with straightforward calculations one has � � dc 2 2 − s2 , h ≈ tvalue
(4.35)
or h equal to some large value (empiricaly obtained) if the right hand side of equation (4.35) is non-positive. An evident choice for c may be c = tvalue , because this implies d/σ = 1. The increase in c leads to increased h and the entropy function becomes smoother.
Of course, one cannot increase h
indefinitely, because this can bring an almost flat HS and the optimization algorithm may fail to find its maximum. The results obtained by applying this strategy shows an increased performance both in terms of lower test error and lower number of iterations needed. Table 4.2 presents the comparison between MSE and the maximization approach, where h was determined by formula (4.35) with c = 3. As we can see, MEE now behaves
106
CHAPTER 4. MEE WITH DISCRETE ERRORS
Table 4.2: Test error (%) and standard deviations (in brackets) obtained with MEE (maximization approach) and MSE for the simulated Gaussian data (d = 1.5). Underlined results are not statistically different from the Bayes error. # train # test
100 MEE
1000 MSE
MEE
100000 MSE
MEE
MSE
50
22.95(3.93) 23.22(4.22)
22.78(4.01) 22.74(4.23)
22.47(4.14) 22.54(4.10)
500
22.73(1.28) 23.30(1.54)
22.71(1.32) 22.84(1.36)
22.63(1.33) 22.67(1.32)
5000
22.73(0.41) 23.22(0.84)
22.65(0.43) 22.82(0.48)
22.66(0.41) 22.68(0.42)
50000
22.75(0.17) 23.27(0.77)
22.67(0.14) 22.81(0.23)
22.67(0.13) 22.67(0.13)
similarly as for d = 1 and d = 3 above, outperforming the results of MSE. For each of the above experiments, we also tested if the mean values obtained were statistically equal to the Bayes error. The results underlined in the tables correspond to the cases were this hypothesis cannot be rejected. Again, (excluding the case d = 1.5 in Table 4.1) we observe an increased performance of MEE, being more capable of reaching the optimal value. Real data The MEE and MSE procedures were also applied to real data. We used four data sets: Corkstoppers from [73] and Iris, Wine and Glass from the UCI repository [79]. To allow the use of the results already derived for Gaussian distributions we have conducted hypothesis testing on the normality of the samples and homogeneity of variances. Table 4.3 shows a brief description of the data used and the results of these tests. All samples except the ones from Glass verify the normality assumption (for a significance level α = 0.05). The homogeneity of variance property can also be assured for the same significance level, except for Wine and Glass. Thus, it is expected a worse performance of MEE in these data sets, because the conditions
107
4.2. SPLIT-TYPE SETTING
Table 4.3: Description of the univariate two-class problems used from real data. x is the input variable used and classes is the two classes used from each data set. The last two rows show the p-values for the normality and homogeneity of variances tests.
Corkstoppers x
N
classes
1 vs 2
Iris sepal length
sepal width
petal length
2 vs 3
Wine
Glass
alcalinity of ash
Na
1 vs 2
1 vs 2
d/σ
1.474
1.036
0.629
2.341
0.717
0.068
normality
0.97; 0.76
0.58; 0.91
0.45; 0.53
0.25; 0.29
0.18; 0.43
0.04; 0.00
hom. var.
0.72
0.15
0.85
0.26
0.01
0.02
of Theorem 5 are not assured. Taking into account the d/σ values we have two minimization (Corkstoppers and Iris-petal length) and four maximization problems. The train and test procedure was a simple holdout method: half of the data set for training and half for testing. This was repeated over 1000 times varying the train and test sets. The results obtained are shown in Table 4.4. Table 4.4: Percentage of test error (standard deviation in brackets) for the univariate split problems of Table 4.3 with MEE and MSE. The last row presents the p-values of the test of equality of means.
Corkstoppers
Iris
Wine
Glass
MEE
22.94(4.50)
27.25(4.62)
41.25(8.30)
8.15(2.73)
33.64(4.13)
52.64(3.22)
MSE
26.19(4.84)
30.24(5.43)
40.77(8.2)
8.52(3.17)
35.43(4.50)
52.81(3.29)
p-value
0.00
0.00
0.098
0.005
0.00
0.122
The results show that MEE outperforms MSE in most cases with definitely better results in four of the six data sets (according to the p-value). Even in
108
CHAPTER 4. MEE WITH DISCRETE ERRORS
Wine MEE outperformed MSE. In Corkstoppers, the minimization of error entropy performed poorly. This is in agreement with the results obtained for the Gaussian simulated problem with d = 1.5. Thus, the results of Corkstoppers in Table 4.4 were obtained with the maximization procedure using (4.35) with c = 3 to set h. In Iris-petal length we used the minimization approach with better results than MSE, but it was interesting to notice that the maximization approach achieved even better results (!): test error of 7.18% and standard deviation 2.78%. We sought an explanation for the difference of the maximization and minimization results and found it on the small number of patterns used each time in the training sets, where each class density is estimated with approximately 25 patterns. Also, the optimal value used for the minimization was a mere h = 0.16 (empirically found), which in conjunction with the small number of patterns produces very rough density estimates (see Figure 4.6a), constrasting with those obtained with a large h (Figure 4.6b for the maximization procedure). Furthermore, as the training sets (remember that each experiment is repeated 1000 times) may vary a lot, the same value of h = 0.16 for all of them is certainly not an optimal choice. On the other hand, as the maximization approach uses larger h, the possible differences between different training sets are smoothed out and have less influence on the final result. This explains the difference between the minimization and maximization results. In conclusion, for very small data sets (when the sample may not be representative of the distribution) one should consider the maximization approach.
4.3
Perceptron Setting
The previous setting of univariate input distributions and single split decisions was obviously simplistic but important to show that MEE (with discrete errors)
109
4.3. PERCEPTRON SETTING
0.5
0.2
f(x)
0 3
7
0.1 3
7
x
x
(a) h = 0.16
(b) h = 1
Figure 4.6: Density estimates of a training set for the two class problem of irispetal length with h = 0.16 in (a) (minimization procedure) and h = 1 in (b) (maximization procedure). is sub-optimal. It was also possible to characterize the type of solvable problems. In this section we begin the extension to the general perceptron-type machine which ends the discussion of the case of discrete errors.
4.3.1
The General Setting
The perceptron with threshold activation function implements the linear discriminant: y = sign(wT x + w0 ),
(4.36)
which geometrically defines a decision hyperplane (see section 2.3.1). To study the data classification problem in light of the MEE principle, is tantamount to analyzing whether the MEE hyperplane corresponds to the optimal solution in the min P e sense (for the class of hyperplane decisions). As discussed before, the error r.v. E = T − Y takes value in {−2, 0, 2} with probabilities P (E = −2) = P-1 , the probability of misclassifying a C-1 pattern, P (E = 2) = P1 ,
110
CHAPTER 4. MEE WITH DISCRETE ERRORS
the probability of misclassifying a C1 pattern and P (E = 0) = 1 − P-1 − P1 , the probability of making a correct classification. The error entropy is given by formula (4.1) and the error probabilities are computed as follows P-1 = P (Y = 1, T = −1) = P (wT x + w0 ≥ 0, T = −1) = q(1 − Fz|-1 (0)), (4.37) P1 = P (Y = −1, T = 1) = P (wT x + w0 ≤ 0, T = 1) = pFz|1 (0),
(4.38)
where Fz|t (0) = P (z ≤ 0|T = t) is the conditional distribution value at the origin of the univariate r.v. z = wT x + w0 . We study in particular the case of bivariate Gaussian input distributions, that suffices to show how MEE behaves for the general perceptron. We note that for a bivariate distribution one has (d = 2) 2 X i=1
wi xi + w0 ≥ 0 ⇐⇒ w1 x1 + w2 x2 + w0 ≥ 0,
where at least one of w1 or w2 must be non-zero. Three situations can occur: 1. w1 = 0 and w2 6= 0.
0 The decision surface is the horizontal line given by x2 = − w w2
2. w1 6= 0 and w2 = 0.
w0 The decision surface is the vertical line given by x1 = − w 1
3. w1 , w2 6= 0. The decision surface is the general line given by � � w0 w1 x1 + . x2 = − w2 w2
(4.39)
We notice the similarity between cases (a) and (b) to the Stoller split problem, but we recall that we are now considering bivariate distributions and thus 0 x2 = − w w2 represents an horizontal line. In the forthcoming sections we will
reveal their relations. Case 3 can also be reduced to cases 1 or 2 by appropriate
111
4.3. PERCEPTRON SETTING
shifts and rotations, without affecting the error probabilities and entropy.
As a first result we prove a generalized version of Theorem 5. It is shown that equal class error probabilities is a necessary condition to ensure that the optimal solution w∗ is a critical point of error entropy. Theorem 6. (Lu´ıs Silva et al. [103]) In the two-class multivariate problem, if the optimal set of parameters given by w∗ = (w1∗ , . . . , wd∗ , w0∗ )T of a separating hyperplane constitute a critical point of the error entropy then the error probabilities of each class at w∗ are equal.
Proof. We start by noticing that the linear discriminant can be viewed has a onedimensional classification problem. In fact, z¯ = wT x is a projection of x onto w. From an initial distribution represented by a density g(x) = qgX|-1 (x)+pgX|1 (x) we get, on the projected space, the distribution of the projected data given by f (¯ z ) = qfz¯|-1 (¯ z ) + pfz¯|1 (¯ z ). The parameter w0 then works as a Stoller split: a given pattern is classified in C1 if z¯ ≥ w0 . Thus, and from the results of section
4.2.2, one can assert that qfz¯|-1 (¯ z ) = pfz¯|1 (¯ z ) at w∗ . We rewrite the error probabilities of each class as
P-1 = q(1 − Fz¯|-1 (−w0 )),
P1 = pFz¯|1 (−w0 ),
(4.40)
∂P1 = pfz¯|1 (−w0 ). ∂w0
(4.41)
and compute ∂P-1 = −qfz¯|-1 (−w0 ), ∂w0 From (4.1), ∂HS = log ∂Pt
�
1 − P-1 − P1 Pt
�
,
t ∈ {-1, 1}.
112
CHAPTER 4. MEE WITH DISCRETE ERRORS
From the chain rule and using the fact that qfz¯|-1 = pfz¯|1 at w∗ we see that ∂HS ∗ (w ) = 0 ⇔ ∂w0 � � �� � � 1 − P-1 − P1 1 − P-1 − P1 − log =0 ⇔ pfz¯|1 (w0∗ ) log P-1 P1 ⇔ fz¯|1 (w0∗ ) = 0 ∨ P-1 = P1 .
(4.42) (4.43) (4.44)
Note that fz¯|1 (w0∗ ) = 0 if and only if the classes have distributions with disjoint supports (they are separable). But in this case P-1 = P1 = 0. Thus, in both cases P-1 = P1 is a necessary condition. If it were possible to compute the partial derivatives with respect to w1 and w2 (and hence, have the complete gradient ∇HS ) one could also show whether or not the equal-error-probability condition is also sufficient. The above result is illustrated with the two following examples for Gaussian distributed classes. Example 1. We assume µ-1 = (−5, 0), µ1 = (5, 0) and Σ1 = Σ-1 = I. In this case P-1 = P1 only if p = 1/2. The optimal decision line can be derived as � � 1 1−p x∗1 = ln . 10 p Hence, w∗ 1 − 0∗ = ln w1 10
�
w1∗
1 = − ln 10
and therefore we can set w2∗
= 0;
= 1;
w0∗
1−p p
� �
1−p p
�
.
Now, we can determine (numerically) that ∇HS (w∗ ) = 0 only if p = 1/2; but this is the case of equal class error probabilities.
Example 2. In the second example we assume, µ-1 = (−2, 0), µ1 = (2, 0), p = 1/2, Σ-1 = I and
Σ1 =
2 0 0 1
.
113
4.3. PERCEPTRON SETTING
Although the covariance matrices are different the optimal decision line is still a vertical line with equation x∗1 = −6 +
p
32 + 2 ln(2).
The error probabilities are unequal, with values P-1 ≈ 0.02 and P1 ≈ 0.03. We also verify that ∇HS (1, 0, −6 + ∇HS (−1, 0, 6 −
p
p
32 + 2 ln(2)) ≈ (−0.0153, 0, −0.0695) 6= 0,
(4.45)
32 + 2 ln(2)) ≈ (0.0149, 0, 0.0672) 6= 0.
(4.46)
Thus, the optimal solution is indeed not a critical point of the error entropy.
4.3.2
The Case of Two Gaussian Classes
Consider the two-class problem with input data having bivariate Gaussian distributions. From the previous discussion, we see that it is crucial to determine the distribution of z = wT x + w0 . For that purpose, we take into account that Gaussianity is preserved under linear transformations: Property 1. If x = (x1 , . . . , xd )T has multivariate Gaussian distribution with mean vector µ and covariance matrix Σ, i.e, x ∼ Gd (µ, Σ), w0 ∈ Rm and W is a m × d real matrix, then: z = Wx + w0 ∼ Gm (Wµ + w0 , WΣWT ). We now consider two classes such that Ct∈{-1,1} , : x ∼ G2 (µt , Σt ) ⇒ z ∼ G1 (wT µt + w0 , wT Σt w). Hence, for t ∈ {−1, 1}, we have �
wT µt + w0 Fz|t (0) = Φ − √ T w Σt w
�
,
(4.47)
114
CHAPTER 4. MEE WITH DISCRETE ERRORS
where Φ denotes here the standard Gaussian cumulative function. Therefore, for equal priors � � �� 1 wT µ-1 + w0 √ P-1 = 1−Φ − ; 2 wT Σ-1 w
� � wT µ1 + w0 1 √ P1 = Φ − . 2 w T Σ1 w
(4.48)
To further investigate this two-class problem in light of the MEE principle we assume the following: 1. Considering µt = (µt1 , µt2 ) for t ∈ {−1, 1}, we set µt2 = 0 and µ-11 = −µ11 with µ11 > 0; i.e, the centers of the classes lie in the horizontal axis and are symmetric to each other. Note that every possible class configuration can be reduced to this case by applying shifts and rotations. As this does not alter the probabilities P-1 and P1 , HS is only shifted and rotated, preserving the extrema. 2. Σ-1 = Σ1 = I. By assuming equal covariances, the optimal decision surface is linear (a line in this case). Moreover, assuming the identity matrix for the covariances (spherical distributions) allows important simplifications in the above formulas. With these assumptions, it follows that the optimal solution w∗ = (w1∗ , w2∗ , w0∗ )T corresponds to the vertical line x1 = 0 and the optimal decision is to classify x = (x1 , x2 )T in C1 if x1 ≥ 0. This means that w0∗ = w2∗ = 0 and w1∗ must be a positive real number (to give the correct orientation of the classes). Graphical Analysis Due to representational reasons, one must fix one of the parameters w1 , w2 or w0 . As we have some prior knowledge about the solutions we start by setting w2 = 0 and plot HS as a function of w1 and w0 in Figures 4.7a and 4.7b. Note that we are assuming as the solution to the problem a vertical line with freedom to make shifts. This is in fact equivalent to the Stoller split case. We may distinguish two regions defined by w1 > 0 and w1 < 0.
115
4.3. PERCEPTRON SETTING
1.1 1
HS
HS
0 −2
w1
2
0
0 2 −2
0.65 −2
w0
2
w1
(a) µ11 = 5
0
w0
0 −2 2
(b) µ11 = 0.5
1.1 1.2
HS
HS 0 Ŧ2
w1
2
0 0 2 Ŧ2
0.8 Ŧ2
w2
(c) µ11 = 5
w1
2
0
0 2 Ŧ2
w2
(d) µ11 = 0.5
Figure 4.7: HS for different values of µ11 = −µ-11 . From left to right we decrease the distance between the classes. The top figures were drawn with w2 = 0, while the bottom ones were drawn with w0 = 0.
• w1 > 0 When the classes are distant, the optimal solution is obtained at w0 = 0, although small shifts of the line are also acceptable (the flat region in Figure 4.7a). In fact, there are infinite near-optimal solutions with approximately the same entropy (HS ≈ 0). This is because the probabilities P1 and P-1 are not greatly affected by (small) shifting when the classes are distant. However, when the classes get extremely close (Figure 4.7b), we obtain a local maximum of the entropy for w0 = 0, which is in accordance to the results obtained for Stoller splits in a previous section.
116
CHAPTER 4. MEE WITH DISCRETE ERRORS
• w1 < 0 In this case, a swapped classification is being performed, C-1 ↔ C1 . The same behaviors as for w1 > 0 are observed.
If we now set w0 = 0, we are considering a solution given by a line passing through the origin but capable of rotating. Let us analyze the w1 > 0 case, by inspecting Figures 4.7c and 4.7d. As expected, the minimum of HS is attained when w2 = 0, but now it will not turn into a maximum when the classes get closer. Simply, the flat region disappears, because decision boundaries that are not vertical are less tolerable here (there is more probability of error). Thus, we encounter different behavior for w2 = 0 and for w0 = 0. A natural question then arises: what is the behavior of HS when all the parameters are free to vary? More precisely, when training a learning machine that implements a hyperplane as the decision surface (like the single perceptron), there is, in general, no prior information that one or more of the parameters w1 , w2 or w0 should be set to zero (assuming appropriate data shift and rotation). Does the optimal set of parameters also correspond to an entropy minimum? Does it turn to a maximum when the classes get closer (as in the Stoller split case)? We start investigating these questions by inspecting the surface levels of HS , the equivalent to contour levels in the two variable case. In other words, we examine the surfaces HS (w1 , w2 , w0 ) = c for increasing or decreasing values of c ∈ R. Figure 4.8 shows some surface levels (iso-entropy surfaces or iso-entropics) of HS . For distant classes, Figures 4.8a and 4.8b show that as one decreases the value of c, the iso-entropics converge to the positive w1 axis, meaning that HS (w1 , 0, 0) for w1 > 0 has the lowest entropy value. On the other hand, when the classes get closer the behavior is completely different. This case is split into three subfigures in Figure 4.8c, where from left to right, we gradually increase the value of c. We find that when c is decreased to its minimum, the iso-entropics converge to the w0 axis (left figure). On the other hand, when c is increased
117
4.3. PERCEPTRON SETTING
0.1
2
0.6
2
1e−3
w0
w0
0.3
1e−5
0.2
2
2 −2 0
−2 0
w2
w1
2 −2
(a) µ11 = 5
0.85
2
w0
w0
w0
−2 −2 2
w1
0 2
w2
0.832
2
0.694
0.82
2 −2
(b) µ11 = 2
0.78
2
w1
w2
−2
−2 2
w1
w2 0 2
0.95
1.02
−2
−2 2
w1
w2 0 2
(c) µ11 = 0.5
Figure 4.8: Surface levels of HS (values of c also shown). Figure (c) is split into three subfigures with increasing value of c from left to right.
to its maximum (for w1 > 0), the iso-entropics converge to the axis w2 (right figure). The positive w1 axis appears as a solution when an intermediate value of c is used, shown in the middle figure of Figure 4.8c, which means that this solution (in fact, the optimal solution) is not a global minimum nor maximum of the entropy. In fact, as we found with Figure 4.7b the positive w1 axis is a local maximum. First and Second Order Information Despite the above graphical suggestions one cannot conclude with confidence the
118
CHAPTER 4. MEE WITH DISCRETE ERRORS
exact nature of the solutions. We now study their behavior from an analytical point of view, using first and second order information about HS (first and second order derivatives). In what follows we omit several expressions due to their complexity and length. First, we notice that HS is piecewise constant at the w1 axis (for w1 6= 0) in the following way: HS (w1 , 0, 0) = c1 ∈ R, ∀w1 > 0 where c1 → 0 (100% correct classification) as the distance between the classes is increased; H(w1 , 0, 0) = c2 ∈ R, ∀w1 < 0, where c2 → ln(0.5) (ditto, with swapped class labels) as the distance between the classes is increased. ¯ = (w1 , 0, 0)T Computing the gradient of HS we find that vectors of the form w ¯ = 0. for w1 6= 0 are critical points of HS or, in other words, that ∇HS (w) The nature of these critical points can be further investigated using second order information about HS , given by its Hessian matrix. Let us consider the following cases:
1. µ11 = 5 (distant classes) and w1 > 0 ¯ is given by The Hessian matrix ∇2 HS at w
0
¯ = 0 ∇2 HS (w) 0
0
0
0.4809 w12
0
0
0.3527 w12
,
which is a positive semi-definite matrix. Since it is a diagonal matrix, its eigenvalues are directly given by the diagonal elements. Due to the ¯ is said to be a degenerated critical point and singularity of the Hessian, w a clear conclusion about its nature cannot be made. However, we can use the Taylor expansion of HS to analyze its behavior in a neighborhood of ¯ Consider increments h = (h1 , h2 , h3 )T where hi , i = 1, . . . , 3, is small. w. We can write ¯ + h) = HS (w) ¯ + hT ∇HS (w) ¯ + hT ∇2 HS (w)h ¯ + o(khk2 ). HS (w
(4.49)
119
4.3. PERCEPTRON SETTING For very small khk, one may neglect o(khk2 ) and write ¯ + h) − HS (w) ¯ ≈ hT ∇2 HS (w)h. ¯ HS (w
(4.50)
Now, if the Hessian were positive definite (all positive eigenvalues), then for ¯ would be positive and w ¯ would be any h, the quadratic form hT ∇2 HS (w)h a strict local minimum. However, it is easy to see that there are increments ¯ h such that hT ∇2 HS (w)h = 0; these are of the form h = (h1 , 0, 0). But ¯ + h belongs to the positive w1 axis where HS is constant. in this case, w Along any other h directions, the quadratic form is positive. This means ¯ or more precisely, the whole positive w1 axis, is in fact an entropy that w, minimum. 2. µ11 = 0.5 (close classes) and w1 > 0 The Hessian now becomes
0
¯ = 0 ∇2 HS (w) 0
0
0
0.2641 w12
0
0
−0.1377 w12
.
(4.51)
This matrix is indefinite, because it has positive and negative eigenvalues. ¯ is a minimum and diThis means that there are directions such that w ¯ is a maximum (and of course, as discussed above, rections such that w directions where HS remains constant). These critical points are called saddle points. This analysis shows that the discrete MEE principle applied to hyperplane learning, is even less general than in the unidimensional case. In fact, while for the Stoller split problems the minimum of entropy changes to a maximum as the classes get closer, in the bivariate case the minimum may change to a saddle point, which brings about further difficulties when applying an optimization strategy. Figure 4.9 illustrates, in terms of the error probability mass function (pmf), the way the minimum-to-maximum flip is performed in the Stoller
Probability
120
CHAPTER 4. MEE WITH DISCRETE ERRORS
1
1
1
0,5
0,5
0,5
0
Ŧ2
0 e
2
0
Ŧ2
Probability
(a) HS = 0.82
0 e
2
0
(b) HS = 0.83 1
1
0,5
0,5
0,5
Ŧ2
0 e
(d) HS = 0.56
2
0
Ŧ2
0 e
(e) HS = 0.04
0 e
2
(c) HS = 0.74
1
0
Ŧ2
2
0
Ŧ2
0 e
2
(f) HS = 0.56
Figure 4.9: Probability mass functions for close (top) and distant (bottom) classes in the Stoller split setting. Figures from left to right correspond to the split position at the left, at the location and at the right of the optimal split, respectively.
split case. At the top, for close classes, HS has a maximum at the optimal solution, whereas for distant classes (at the bottom), HS has a minimum. In particular, it is intuitive that the distribution in Figure 4.9b corresponds to a more uncertain system than in Figure 4.9a. Moreover, looking to the pmf’s corresponding to the optimal splits (Figures 4.9b and 4.9e), one understands that the peaky distribution for distant classes is gradually lost and the relation to the non-optimal counterparts is significantly altered resulting in the minimumto-maximum flip. In the bivariate case, since one may encounter a saddle point in the (w1 , w2 , w0 ) space for sufficiently close classes, one gets a behavior such as the one shown at the top of Figure 4.9 for the (w1 , 0, w0 ) subspace (allowing
121
4.3. PERCEPTRON SETTING
shifts along x1 ) or the one shown at the bottom of Figure 4.9 for the (w1 , w2 , 0) subspace (allowing rotations in the (x1 , x2 ) plane around the half-distance point between the means). This behavior of course generalizes to the multivariate perceptron. Minimum Distance for Gaussian Classes It is worth asking when are the Gaussian classes no longer “distant” and the minimum of HS turns into a saddle point. This can be studied using the ¯ is always a diagonal eigenvalues of the Hessian matrix. In fact, ∇2 HS (w) matrix with one zero entry, one positive entry, and a third entry that changes sign as the classes get closer (as previously illustrated); these entries are the eigenvalues of the matrix. We can, therefore, determine the minimum distance yielding a minimum of HS at (w1 , 0, 0)T for w1 6= 0, by inspecting when the signchanging eigenvalue changes of sign. With µ11 = −µ-11 , µ12 = µ-12 = 0 and Σ1 = Σ2 = σ 2 I, this eigenvalue can be written as a function of d = µ11 /σ, which can be seen as a normalized half distance between the classes. The obtained expression is rather long but it can be verified that the eigenvalue is positive if the following expression is positive: √
2πd(1 − Φ(d)) ln
�
2Φ(d) 1 − Φ(d)
�
− e−
d2 2
,
(4.52)
where Φ is as before. The turning value is approximately d = 0.7026, which corresponds to a normalized distance between the classes of approximately 1.4052. This is precisely the same value encountered for the Stoller split problem in section 4.2.
In this section we analyzed the MEE principle for the case of discrete errors. We started by characterizing the two-class problem with uniform distributions were we found that MEE leads to the optimal classifier for the class of Stoller split decision rules. This optimal solution also corresponds to the optimal decision
122
CHAPTER 4. MEE WITH DISCRETE ERRORS
rule obtained using the minimum probability of error criterion. Thus, Bayes error is also guaranteed in this situation. For general class density functions, we proved in Theorem 5 that a Stoller split occurs at an entropy extremum only if the error probabilities for both classes are equal, which restricts the applicability of MEE. Moreover, we showed that for mutually symmetric distributions and in the conditions of Theorem 5, the Stoller split may be either an entropy minimum or maximum, depending on the proximity of the classes. We actually determined the turning proximity values for some distributions. These were used as a guideline for the empirical procedure, where MEE outperformed MSE specially for small sample sizes.
We also encountered a high sensitivity of
the discrimination process to the smoothing parameter, h. Meanwhile, our analysis enlightened the fact that in the cases where d/∆ is near the turning proximity value, it is preferable to set h so as to convert the minimization process into a maximization process. In what concerns the perceptron setting, we found that the maximum-to-minimum turning point for the class closeness measure generalizes to entropy saddle points. Moreover, we have confirmed the turning point value for Gaussian inputs. We have also shown that the necessary condition of equal class error probabilities, found for the Stoller split, also generalizes to the perceptron setting.
Chapter 5
Theoretical analysis of MEE: the Continuous Errors Case In the previous chapter we have studied the case of threshold-type activation functions which gave origin to a discrete error random variable E. We now consider the case where the learning machine has continuous activation functions and E is a continuous r.v. (which in fact is the strategy used in general MLP training). Thus, the definition of entropy for a continuous random variable is used. By analyzing the cases of split-type and perceptron-type machines, we show that major effects can be produced if one increases the machine’s flexibility and that the kernel density estimator present in the estimation of entropy has an important impact [103].
5.1
General Setting
Let X be the (input) random variable with support DX from which the data is generated and T the target variable taking value on the set {−1, 1} (as 123
124
CHAPTER 5. MEE WITH CONTINUOUS ERRORS
before, we represent the classes as C-1 and C1 ) with priors p = P (T = 1) and q = 1 − p = P (T = −1). Hence, X has a probability density function (pdf) given by fX (x) = qfX (x|T = −1) + pfX (x|T = 1),
x ∈ DX .
(5.1)
For notation simplicity, we denote fX|t (x) ≡ fX (x|T = t), for t ∈ {−1, 1}. The perceptron performs a mapping ϕw : DX → DY from its input to its output (with support DY ). The function y = ϕw (x) is a continuous and differentiable function, depending on a vector of parameters w, which is expected to generate a discriminant rule of the form x ∈ DX belongs to C1 if ϕw (x) ≥ 0. The error random variable can now be defined as the difference between the target T and the output Y E = T − Y = T − ϕw (X).
(5.2)
The present choice of target coding, suggests the use of an activation function such that ϕw (x) ∈ [−1, 1] ⊇ DY (see Theorem 2 in section 3.1.1). Hence, E is a continuous r.v. taking value on a uncountable subset of [−2, 2], and its distribution is straightforward to derive FE (e) = P (E ≤ e) = P ((T = 1, E ≤ e) ∨ (T = −1, E ≤ e)) = P (T = 1)P (E ≤ e|T = 1) + P (T = −1)P (E ≤ e|T = −1) = pP (1 − Y ≤ e|T = 1) + qP (−1 − Y ≤ e|T = −1) = p(1 − FY |1 (1 − e)) + q(1 − FY |-1 (−1 − e)) = 1 − pFY |1 (1 − e) − qFY |-1 (−1 − e).
(5.3)
The corresponding pdf is obtained by applying differentiation fE (e) =
dFE = pfY |1 (1 − e) + qfY |-1 (−1 − e). de
(5.4)
125
5.2. SPLIT-TYPE SETTING
f
f
(y)
(Ŧ1Ŧe)
Y|Ŧ1
Y|Ŧ1
f
f
(y)
0 Ŧ1
0 y
(1Ŧe)
Y|1
Y|1
0 1 Ŧ2
0 e
2
Figure 5.1: Illustration of the transformation E = T − Y , emphasizing the fact that fE (0) = 0 for continuous class conditionals.
Note that if the class-conditional pdf’s of Y are continuous, we have fE (0) = 0 since limǫ→0 fY |-1 (−1 + ǫ) = limǫ→0 fY |1 (1 − ǫ) = 0, as illustrated in Figure 5.1. We shall study, in the following sections, the classifier problem in light of the MEE principle, by analyzing the behavior of the error entropy as we vary the parameters inherent to the model ϕw (x) (that we shall denote simply ϕ(x)) and investigate if the theoretical optimal solution (in the sense of minimum probability of classification error) corresponds to an error distribution of minimum entropy.
5.2
Split-type Setting
We start by considering perceptrons with only one adjustable parameter; that is, the perceptron is trained to find a split point in the error distribution, as in the Stoller split setting. The only difference is that now we have a continuous error distribution. We start by considering the case of a linear activation function.
126
5.2.1
CHAPTER 5. MEE WITH CONTINUOUS ERRORS
Linear Activation Function
If the activation function is linear, with ϕ(x) = x − w0 , that is, we are only considering a bias term, we expect from what was discussed in section 3.1.1 that HS (or R´enyi’s counterpart) will not be dependent on the parameter. This can be shown with a simple example, by considering two uniform overlapping classes defined by the densities
fX|-1 (x) =
1 I (x), b − a [a,b]
fX|1 (x) =
1 I (x), d − c [c,d]
(5.5)
with a < c < b < d. Note that, if ϕ(x) ≥ 0 ⇐⇒ x ≥ w0 we classify x as C1 , otherwise we classify as C-1 . One easily derives 1 I (e), b − a [w0 −b−1,w0 −a−1] 1 fY |1 (1 − e) = I (e). d − c [w0 −d+1,w0 −c+1]
fY |-1 (−1 − e) =
(5.6) (5.7)
The final configuration of the transformed (shifted) distributions is dependent on the values of c − a and d − b (in some cases the optimal solution would need two splits). Also, E is not necessarily constrained to the interval [−2, 2]. We analyze the case where the final distributions are such that w0 − d + 1 < w0 − b − 1 < w0 − c + 1 < w0 − a − 1, that is we assume an overlap in the interval [w0 − b − 1, w0 − c + 1]. In this case,
HS = −
�Z
w0 −b−1
� � p p ln de+ d−c w0 −d+1 d − c � � � Z w0 −c+1 � p q q p + + ln de+ d−c b−a d−c b−a w0 −b−1 � � � Z w0 −a−1 q q ln de , b−a w0 −c+1 b − a
127
5.2. SPLIT-TYPE SETTING
which brings � � p p(d − b − 2) ln HS = + d−c d−c � � � � p q q p + + ln (b − c + 2)+ d−c b−a d−c b−a � � q q(c − a − 2) ln , b−a b−a which does not dependent on w! Of course, the linear activation is not the most appropriate for classification tasks, and in general, squashing activation functions are used. These are the ones considered from now on.
5.2.2
Squashing Activation Function
The squashing activation function to be considered is ϕ(x) = tanh(x), a continuous, differentiable and strictly increasing function function with the property limx→±∞ ϕ(x) = ±1. Under these conditions one has t = −1
−2 ≤ e ≤ 0
t=1
⇒ fY |-1 (−1 − e) = 0
0≤e≤2
⇒ fY |1 (1 − e) = 0
∀e ∈ / [−2, 0],
(5.8)
∀e ∈ / [0, 2].
Hence, and denoting fY |t (t − e) by fY |t (e) for t ∈ {−1, 1}, Shannon entropy can be derived as HS = − = − = −
Z
∞
fE (e) log fE (e)de −∞ Z ∞� −∞ 2 �
Z
−2
� � � qfY |-1 (e) + pfY |1 (e) log qfY |-1 (e) + pfY |1 (e) de
� � � qfY |-1 (e) + pfY |1 (e) log qfY |-1 (e) + pfY |1 (e) de.
By the properties in (5.8) one has HS = −
hZ
0
−2
� qfY |-1 (e) log qfY |-1 (e) de +
Z
0
2
� i pfY |1 (e) log pfY |1 (e) de . (5.9)
128
CHAPTER 5. MEE WITH CONTINUOUS ERRORS
Working separately with each of the integrals in (5.9) one derives Z 0 Z 0 � fY |-1 (e) log fY |-1 (e)de qfY |-1 (e) log qfY |-1 (e) de = q log q + q −2
−2
Z
= q log q − qHS|-1 ,
2
� qfY |1 (e) log qfY |1 (e) de = p log p − pHS|1 .
0
Thus HS is decomposed as a sum of the error sub-entropies for each class HS = qHS|-1 + pHS|1 + HS (T ),
(5.10)
where HS|t for t ∈ {−1, 1} is the error entropy of class Ct and HS (T ) is the entropy of the variable T . Using similar arguments, we derive R´enyi’s entropy Z ∞ 1 HRα = [fE (e)]α de log 1−α −∞ � �Z 0 Z 2 � �α � �α 1 pfY |1 (e) de . qfY |-1 (e) de + log = 1−α 0 −2
Although R´enyi’s entropy is not decomposable as a sum of class sub-entropies, the minimization problem can be transformed into an equivalent problem where a sum of two positive quantities (each exclusively related to each class) appears. As an example, for the special case with α = 2, the minimization of HR2 is equivalent to the maximization of Z 0 Z � �2 VR2 = exp(−HR2 ) = qfY |-1 (e) de + −2
0
2�
�2 pfY |1 (e) de.
(5.11)
This decomposition is an important property of MEE for classification which is not encountered in the case of regression. The same decomposition appears for multi-class problems. In fact, whenever a pdf f (x) can be written as f (x) =
X
ai fi (x),
i
where
P
i ai
= 1 and the supports Di of the pdf’s fi (x) are such that Di ∩ Dj = ∅,
∀i 6= j, then the Shannon’s entropy Hf associated with f is given by Hf = −
X i
ai log(ai ) +
X i
ai Hfi ,
129
5.2. SPLIT-TYPE SETTING
where Hfi is the Shannon’s entropy associated with fi . This applies to multiclass problems whenever an 1-out-of-C coding is used (see section 2.3.2). An equivalent decomposition appears for VR2 . Another result needed is the following well-known theorem of r.v. transformation: Theorem 7. Let f (x) be the pdf of the r.v. X. Assume ϕ(x) to be monotonic and differentiable and suppose ϕ′ (x) 6= 0 ∀x. If g(y) is the density of Y = ϕ(X) then f (ϕ-1 (y)) ′ -1 , g(y) = |ϕ (ϕ (y))| 0,
inf ϕ(x) < y < sup ϕ(x) ,
(5.12)
otherwise
where x = ϕ-1 (y) is the inverse function of y = ϕ(x).
Note that our aim is to compute the density of E, which is a transformation of the input X. For the split-type case, ϕ(x) = tanh(x − w0 ), is a differentiable and strictly increasing transformation, where w0 acts as the split point. We thus have ϕ′ (x) = 1 − tanh2 (x − w0 ) 6= 0 ∀x, ϕ−1 (y) = w0 + arctanh(y), ϕ′ (ϕ−1 (y)) = 1 − y 2 .
(5.13) (5.14) (5.15)
We proceed to analyzing two special cases. Consider first that the two classes have inputs described by two overlapping uniform densities as in (5.5). Making use of Theorem 7 one derives −1 I (e), (b − a)e(2 + e) [−1−tanh(b−w0 ),−1−tanh(a−w0 )] 1 I (e). fY |1 (1 − e) = (d − c)e(2 − e) [1−tanh(d−w0 ),1−tanh(c−w0 )] fY |-1 (−1 − e) =
(5.16) (5.17)
130
CHAPTER 5. MEE WITH CONTINUOUS ERRORS
Thus, from (5.10), we obtain
2 log
HS = q +
+
�
|e| 2+e
log |e| log
�
�
log
�
−1 (b−a)e(2+e)
4(b − a)
|e|(2+e)2 16
�
�
+ 4 dilog
2+e 2
�
+ 2 log(2)2 − log(2 + e)2
+ −1−tanh(a−w0 )
+ 4(b − a) −1−tanh(b−w0 ) � � � e log ((d − c)e(2 − e)) + 4 dilog 2e 2 log |e−2| + + p 4(d − c)
log |e − 2| log
�
e2 |e−2| 16
�
+ 2 log(2)2 − log(e)2
4(d − c)
1−tanh(c−w0 )
+ HS (T ) (5.18)
1−tanh(d−w0 )
and for R´enyi’s entropy
VR2 = −
q2 4
2 + e(2 + e) log
�
|e| 2+e
�
(b − a)2 (2 + e)e +
p2 4
2 + log
�
(d
+ 2e
−1−tanh(a−w0 )
�
−1−tanh(b−w0 )
e |e−2| e(e − 2) − c)2 (e − 2)e
− 2e
+
1−tanh(c−w0 )
. (5.19)
1−tanh(d−w0 )
Figure 5.2 shows HS and HR2 as a function of w0 . Class C-1 is fixed to the interval [a, b] = [0, 1] and p = q = 1/2. In Figure 5.2a, where the classes have equal support width, the optimal split is any point in the interval [0.5, 1]. Both Shannon and R´enyi’s entropies have a maximum at w0 = 0.75. This is in direct contradiction with the MEE criterion, which states that w0 should be chosen so as to minimize the error entropy. The particular choice of this split can be explained by the fact that this is the split point providing equal class error probability (as already encountered in the discrete errors case). In general, one can prove the following. Let a = 0 ≤ c ≤ b ≤ d = c+k, where k ∈ R controls the support width of C1 . For k ≥ b − a the optimal split point for the b = 1 setting occurs obviously at w0 = 1, since it will correspond to min P e. For Shannon
131
5.2. SPLIT-TYPE SETTING
1
1
0
0
Ŧ1 0
0.5
0.75
1
2
Ŧ1 0
1
w
2
w0
0
(a) c = 0.5, d = 1.5
(b) c = 0.5, d = 2
Figure 5.2: Shannon (solid) and R´enyi (dashed) entropies as a function of w0 for the case of uniform classes. entropy dHS = dw0
k log
�
cosh2 (w0 ) cosh2 (b−w0 )
�
+ b log
−2bk
k sinh(b) cosh(w0 ) cosh(b−w0 ) + b d2 HS =− dw02
�
�
cosh(c−w0 )2 cosh(c+k−w0 )2
sinh(c+k−w0 ) cosh(c+k−w0 )
−
�
,
(5.20)
sinh(c−w0 ) cosh(c−w0 )
bk
�
.
(5.21)
If we take k = b, and thus, both classes have equal support width, we get dHS dw0
�
b+c 2
�
=0
∧
d2 HS dw02
�
b+c 2
�
< 0,
(5.22)
which means that (b + c)/2, the middle point of the overlapped region, is a maximizer of HS . A rather unexpected behavior (regarding the practical evidence in Chapter 3) appears when the support of class C1 is increased. In Figure 5.2b, where [c, d] = [0.5, 2], the optimal split moves toward an unique point, w0 = 1. However, both Shannon and R´enyi’s entropies fail to identify it (now, the maximum is at w0 ≈ 0.859 and w0 ≈ 0.841, respectively). Note that in this case, the class error probabilities are not equal. We know that in the discrete
132
CHAPTER 5. MEE WITH CONTINUOUS ERRORS
3.5 3
k
2.5 2 1.5 1 0
0.2
0.4
0.6
0.8
1
c
Figure 5.3: Contour level
dHS dw0
= 0 as a function of c and k.
case a necessary condition for the optimal split to correspond to the entropy extrema is that the class error probabilities are equal. However, in the present case this correspondence is not valid. This can be seen by first answering the question: is there any combination of c and k which yields w0 = 1 as the optimal solution? Figure 5.3 answers this question by showing the solution of
dHS dw0
=0
for w0 = 1 and b = 1. This figure tells us that k has to be greater than 1 and furthermore as c decreases, a higher k is needed. As an example, we may see that while the setting [a, b] = [0, 1] and [c, d] = [1, 2] has a maximum at w0 = 1, the setting [a, b] = [0, 1] and [c, d] = [1, 1.9] does not. This also contradicts the “equal-error necessary condition” hypothesis, because for c < 1 < k the error probabilities are not equal (for example, for c = 0.8 one should have k ≈ 1.48). Can these behaviors be attributed to the fact that the uniform pdf is not continuous? The answer is negative and to show this we consider the case where the input distributions are Gaussian
fX|-1 (x) ∼ N (µ-1 , σ-21 ),
fX|1 (x) ∼ N (µ1 , σ12 ).
133
5.2. SPLIT-TYPE SETTING
0.5
1
Ŧ1 Ŧ3 Ŧ2
Ŧ3 0
1.5
w0
(a) µ1 = 3, σ1 = 1
3
Ŧ6 0
1.403
3
w0
(b) µ1 = 3, σ1 = 2
Figure 5.4: Shannon (solid) and R´enyi’s (dashed) entropies as a function of w0 for the case of Gaussian classes. Applying Theorem 7 one easily gets � �2 � � 1 arctanh(t−e)−(µt −w) exp − 2 σt √ fY |t (t − e) = I[t−1,t+1] (e). 2πσt e(2t − e)
(5.23)
Figure 5.4 shows HS and HR2 as a function of w0 using approximate computation of the integrals (there is no closed form for the integrals). Class C-1 is fixed to (µ-1 , σ-1 ) = (0, 1) and p = q = 1/2. In Figure 5.4a, where the class means just differ in location, the optimal split is the middle point between the class means, w0∗ = 1.5. Both entropies find this point as a maximum. Moreover, in Figure 5.4b, where (µ1 , σ1 ) = (3, 2), the optimal split changes to w0 ≈ 1.403. Both entropies fail to identify this point. Again the error probabilities for each class are equal in the former case, while this does not happen in the latter case. These theoretical behaviors of both Shannon and R´enyi’s entropies (maximum instead of minimum and displaced from the minW P eΦ position) raise the natural question: how is it possible that the MEE principle works well in practice (as conclusively shown in Chapter 3 and [90, 104] with MLP’s and recurrent
134
CHAPTER 5. MEE WITH CONTINUOUS ERRORS
networks in [4])? There are two main aspects that differentiate the preceding theoretical analysis from the mentioned practical implementation. The first one is related to the learning machine’s flexibility/complexity. In fact, in the preceding examples the perceptron was allowed only a sliding split that basically sets the location of the a.f.. As shown in the following section, a more flexible activation is more capable to drive MEE to min P e. Secondly, as the true class distributions are not known, the error distribution cannot be computed using tools like Theorem 7. A kernel density estimator is used in practice and its relevant influence in driving MEE towards min P e is also investigated in a forthcoming section.
5.3
Perceptron-type Setting
We now assume ϕ(x) = tanh(w1 x − w0 ), that is, instead of a split-type setting, controlled by w0 imposing a simple sliding of ϕ(x), we now have a more realistic perceptron setting with a parameter, w1 , controlling the function shape of ϕ(x) (in fact, the steepness of ϕ). In particular, ϕ(x) converges to the sign activation function as w1 → +∞. We also assume that w1 > 0 since for w1 = 0, no adaptation would be possible and if w1 < 0, ϕ would perform a swapped classification. Using Theorem 7 one derives ϕ′ (x) = w1 (1 − tanh2 (w1 x − w0 )) 6= 0 ∀x, ϕ−1 (y) =
1 (w0 + arctanh(y)), w1
ϕ′ (ϕ−1 (y)) = w1 (1 − y 2 ).
(5.24) (5.25) (5.26)
We follow the same strategy as before, by analyzing the case of uniform and Gaussian input distributions. The error pdf’s for uniform classes are again obtained using Theorem 7. They
135
5.3. PERCEPTRON-TYPE SETTING
4
1
w0
3
2
1 −10 5
8
1
w1
w0
2
3
4 w1
5
6
7
8
2
3
4 w1
5
6
7
8
0
(a) c = 0.2, d = 1.2 7 6
0
w0
5 4 3 −10
2 1 7
8 w0
0
w1
1
(b) c = 0.9, d = 1.9
Figure 5.5: Surfaces and contour plots of HS (w1 , w0 ) for different values of [c, d]. look very similar to the previous ones −1 I , w1 (b − a)e(2 + e) [−1−tanh(w1 b−w0 ),−1−tanh(w1 a−w0 )] 1 I . fY |1 (1 − e) = w1 (d − c)e(2 − e) [1−tanh(w1 d−w0 ),1−tanh(w1 c−w0 )] fY |-1 (−1 − e) =
(5.27) (5.28)
Entropy is now a function of two variables, w1 and w0 . Figure 5.5 shows the surface of HS and its contours. Two examples are shown with [a, b] = [0, 1] and [c, d] = [0.2, 1.2] in Figure 5.5a and [c, d] = [0.9, 1.9] in Figure 5.5b. The grids for w1 and w0 are chosen so that they are able to display a set of optimal solutions, namely the middle points of the overlapping intervals. We see that both surfaces have a maximum. Analyzing the more informative contour plots, we encounter interesting behaviors. Let us first analyze the case where the overlapping region
136
CHAPTER 5. MEE WITH CONTINUOUS ERRORS
is [0.2, 1] (Figure 5.5a). Any split in this interval is optimal. In particular, the “middle” optimal split (the one corresponding to equal class error probabilities) corresponds to the w0 /w1 = 0.6 line. This line (solid line) is represented over the contour plot together with the w0 /w1 = 0.2 and w0 /w1 = 1 dashed lines, also achieving min P e. The solid line appears to pass at the location of the maximum as can be more clearly seen in the zoomed image (elliptical axes). However, instead of yielding the whole w0 /w1 = 0.6 line as a solution, i.e., instead of exhibiting a straight “ridge”, the entropy surface exhibits a single peak. In the bottom figures we encounter a similar behavior. It is interesting to see that in this case a lower value for w1 is obtained. In fact one observes a dependency between the steepness of the a.f. and the amount of overlap, with an increased overlap requiring an increased steepness of the activation function. For this setting, an analytical treatment can be made. Consider HS = HS (w1 , w0 ) and a = 0 ≤ c ≤ b ≤ d = c + b (classes with equal-length support). Then1 � � b+c ∂HS w1 , w1 = 0. (5.29) ∂w0 2 This means that the middle point of the overlapped region is a candidate for an extremum. Its nature can be studied using the second order information given by the Hessian. We then verify that � � ∂ 2 HS b+c < 0, w1 , w1 2 ∂w02 � � � � b+c b+c ∂ 2 HS ∂ 2 HS w1 , w1 w1 , w1 = > 0. ∂w1 ∂w0 2 ∂w0 ∂w1 2
(5.30) (5.31)
The expression for ∂ 2 HS /∂w12 is intractable. With this information one can be sure that if the critical point (w1 , w1 (b + c)/2) is not a saddle point, then it is a maximum. 1
The partial derivative with respect to w1 is intractable.
137
5.3. PERCEPTRON-TYPE SETTING
1.1
1.5
1.3
1.5 w0 / w1
1.9
0.4
0.5
HS
1.7 0.4
(a) w1 = 3 at top; w1 = 7 at bottom
0.5 w0 / w1
0.6
(b) w1 = 10 at top; w1 = 15 at bottom 10.5
10 w
0
H
S
10
Ŧ30 20 10 w
0
0
5
0
10 w
1
(c)
9.5 6.5
6.55
6.6 w
6.65
6.7
1
(d)
Figure 5.6: At the top: HS (w1 , w0 ) for fixed values of w1 and different locations of the Gaussians. At the bottom: Surface and contour plot of HS (w1 , w0 ). For Gaussian input distributions, the transformed pdf’s are derived as � � �2 � 1 µt −w0 ) exp − 12 arctanh(t−e)−(w w1 σt √ fY |t (t − e) = I[t−1,t+1] (e). 2πw1 σt e(2t − e)
(5.32)
At the top of Figure 5.6, we specified a value for w1 (the steepness parameter) and let w0 vary in a way such that the optimal solution is displayed. Thus, HS is plotted as a function of w0 /w1 . Without loss of generality, we set the “left class” with (µ-1 , σ-1 ) = (0, 1). Figure 5.6a refers to the setting (µ1 , σ1 ) = (3, 1) with corresponding optimal split at x∗ = 1.5. We observe that the increase of
138
CHAPTER 5. MEE WITH CONTINUOUS ERRORS
w1 causes HS to change from a maximum to a minimum at x∗ . In Figure 5.6b, where (µ1 , σ1 ) = (1, 1) and x∗ = 0.5, we observe that the increase of overlap between the classes requires a higher value of w1 to perform the same change. These results suggest the need of function shaping parameters, as is the case with multilayer perceptrons, in order to get an entropy minimum. The bottom of Figure 5.6 shows HS as a function of (w1 , w0 ), where one can identify the previous behaviors2 . For (w1 , w0 ) ∈ [6.5, 6.7] × [9.5, 10.5] a local minimum is attained as shown in the contour plot. As before, the solid line (which appears to pass through the minimum) represents the set of solutions w0 /w1 = 1.5. Unfortunately, due to the complexity of the formulas, an analytical treatment similar to the one performed for uniform classes, is not possible. We were also able to observe that if the classes get closer, the same behavior is obtained, namely the need of a higher w1 in order to obtain the minimum.
5.4
Estimating the Error Density
There is an essential difference between the theoretical MEE and how it is implemented. In fact, the input distributions are usually unknown which makes it impossible to use Theorem 7 to determine the exact error distributions. A method to estimate the error pdf’s is then used and the choice falls as before to the kernel density estimator (kde). The estimated pdf is always a smoothed version of the original pdf and this will show up (for appropriate choices of h) as a fundamental feature of the practical MEE implementation. Figure 5.7 illustrates the influence of kde on determining the error distribution. It shows the theoretical and an instance of the practical error pdf’s. Note the smoothing imposed by the kde: an increased value of h implies an oversmoothed estimate 2
Note that the minima attained for small values of w1 and high values of w0 do not
correspond to an optimal solution (due to the relation w1 x = w0 )
139
5.4. ESTIMATING THE ERROR DENSITY
0
3
3
3
0 Ŧ2
0
3
h=0.01
h=0.01
0 2 Ŧ2
0
0
3
3
h=0.5
h=0.5
0 Ŧ2
2
0 e
0 2 Ŧ2
(a)
0 e
2
(b)
Figure 5.7: The kde smoothing effect. The top figures show the class conditional pdf’s with the split location (solid vertical line).
The middle and bottom
figures show the theoretical (solid line) and kde (dashed line) error pdf’s for the corresponding split for two different values of h. with greater impact near the origin. If we look to the bottom figures we can understand the theoretical maximum found before and the changes operated after the kde smoothing. In the left figure (where the split is not optimal), the true error pdf for class C-1 is nearly uniform which implies a high value for HS|-1 . However, the error pdf for C1 is highly concentrated at the origin yielding a quite low (negative) HS|1 . Due to relation (5.10) the overall value of HS will be lower than the one in the right figure, where the overall true error pdf is more close to a δ-Dirac function. This is why entropy has a maximum at the optimal split. When density estimation is used with sufficiently high values for h, these behaviors are smoothed out (and in fact, the error pdf is seen as a “whole”, ignoring relation (5.10)); now the non-optimal split estimated pdf has a long left tail, whereas the optimal one is more concentrated around the origin, yielding a minimum.
140
CHAPTER 5. MEE WITH CONTINUOUS ERRORS
The influence of kde smoothing when using Shannon and R´enyi’s (α = 2) entropies can be studied and understood with some interesting experimental settings. Both entropies have to be estimated and we consider the following relations as previously discussed in section 2.4.3.1 N N 1 X 1 X log f (ei ) ≈ log fˆ(ei ), N N i=1 i=1 � � N N X X 1 ei − ej √ = − log √ K . 2 2hN i=1 j=1 2h
HS = E{log f (e)} ≈
(5.33)
HR2
(5.34)
In the first experiment two Gaussian classes were generated with 10000 data points each.
Class C-1 was always centered at the origin and its standard
deviation was 1. Class C1 was generated in two different settings differing from C-1 only in its location: µ1 ∈ {1, 3}.
We then applied the following
transformation ei = t − tanh(xi − w0 ),
xi ∈ Ct , t ∈ {−1, 1},
(5.35)
for a grid of w values. Basically we are considering here the simplest single split case. The joint effect of varying the smoothing parameter h and of increasing/decreasing the overlap between the classes is shown in Figure 5.8 for both Shannon and R´enyi’s entropies as functions of the split point w0 . From left to right we decrease the overlap while from top to bottom we increase h. We see that the increase of h implies a change from a maximum to a minimum. Also, this optimal extreme gradually becomes “less local”. The increase of overlap mainly requires greater values of h to obtain the same behavior. Note that we cannot say that any one of the used entropies is better in some sense than the other, because they clearly work with different values for h (higher for Shannon entropy). In the second experiment, we searched for the minimum value of h that produces the maximum-to-minimum flip. Again, two classes with Gaussian distribution were generated with 50, 100 and 500 data points each. Class C-1 has zero
141
5.4. ESTIMATING THE ERROR DENSITY
0.5
Ŧ0.5 Ŧ2
2
1.5
w0
Ŧ1 5 Ŧ2
0.5 Ŧ2
5
w
0
(a) µ1 = 3, h = 0.1 1.5
0.5
(b) µ1 = 1, h = 0.1 2
1.5
w
0
(c) µ1 = 3, h = 0.5
0.5 5 Ŧ2
0.5
w
5
0
(d) µ1 = 1, h = 0.5
Figure 5.8: Effect of the kde in Shannon’s (dashed) and R´enyi’s (solid) error entropies for the single split setting.
mean and class C1 slides from a mean of 0.4 to a mean of 4.
Shannon’s
entropy was computed for different values of h over 20 repetitions. The result is shown in Figure 5.9 where the mean value h∗ sufficient to provide an entropy minimum close to the optimal solution is drawn as a function of the distance between the classes (see details in the figure’s caption). We found that if the classes are extremely overlapped it is difficult or even impossible to produce the flip. This corresponds to the missing h∗ values for low ∆µ, which are due to numerical constraints caused by excessive increase of h (entropy is nearly
142
CHAPTER 5. MEE WITH CONTINUOUS ERRORS
2
1.5 *
h
1
0.5
0 0
0.5
1
1.5
2 'P
2.5
3
3.5
4
Figure 5.9: Minimum mean value (20 repetitions) of h that produces a minimum of Shannon’s entropy within a neighborhood of the optimal split no greater than 10% of the distance ∆µ between the classes. The value is computed only if the procedure is successful in more than half of the repetitions. Classes have 50 (solid), 200 (dashed) and 500 (dotted) data points each and equal unit variance. constant). Moreover, when the number of available data is low the smoothing “difficulties” increase and the need for higher values of h is evident. A similar experiment was conducted for the case of unequal variances. Here we found that higher values of h∗ are needed to produce the flip (in some cases more than 2 times higher) and the successful trials begin around ∆µ = 2. It is now clear the impact of the kde when using the MEE principle, even for this “worst” setting, the split-type setting, where we have previously shown the sole existence of a theoretical maximum. In the third experiment we considered the perceptron setting, that is ei = t − tanh(w1 xi − w0 ),
xi ∈ Ct , t ∈ {−1, 1}.
(5.36)
Figure 5.10 presents a filled contour plot illustrating the behavior of (an estimate of) HS in different settings. We varied the distance between the classes, the value of h and the number of data in each class. We present three settings that
143
5.4. ESTIMATING THE ERROR DENSITY
10
10
w
0
w
0
0
−10
5 w
0
−10
10
5 w
1
10
1
(a) µ1 = 0.8, h = 0.01
(b) µ1 = 0.8, h = 1
10
w0
0
−10
5 w1
10
(c) µ1 = 3, h = 1
Figure 5.10: Joint effect of the kde and the perceptron in Shannon’s entropy. Figures show contour lines filled with a grayscale colormap: higher values of HS correspond to brighter tones. The solid white line represents the set of optimal solutions.
illustrate the general behavior. For a low value of h, every setting (regardless of the distance between the classes) tested presented a maximum as in Figure 5.10a. The increase of h, for close classes, produced a flip to a minimum as illustrated in Figure 5.10b. On the other hand, when the classes are distant and h is chosen sufficiently large, entropy presents a deep valley where the optimal set of solutions can be found. This is shown in Figure 5.10c. In general, we found
144
CHAPTER 5. MEE WITH CONTINUOUS ERRORS
that higher values of h are needed to produce the flip if the classes are closer. (Exactly the same three behaviors were found in many other experiments we have performed using varying µ1 and h.) Moreover, the increase of available data implies smoother surfaces and a need for lower values of h. Nevertheless, the increased smoothing due to higher values of h benefits the “cleaning” of spurious minima. We should also emphasize the importance of the perceptron setting in attaining a minimum entropy situation, which by looking back to Figure 5.9 is not always achieved in the split-type setting. We also tested the joint effect of the kde and perceptron setting for the case of unequal variances (σ1 = 2). We found that for close classes, it was not possible in general to match the entropy minimum with the optimal solution. However, for sufficiently distant classes (we tested µ1 = 3 and µ1 = 5 and sufficiently high values of h (say, above 1), one can succeed even for low N (of course, better results are obtained if N is increased also), and figures like Figure 5.10c tend to be produced. These experiments help to understand the differences between theory and practice in light of the MEE principle and illustrate why one can expect that MLP’s trained with MEE are usually able to solve the classifier problem. The influence of the kde can also be understood by analytical manipulation of the above estimators. We use R´enyi’s expression for simplicity and to better emphasize the relations. The minimization of (5.34) is equivalent to the maximization of
� � N X N X ei − ej 1 ˆ VR2 = √ G √ . 2hN 2 i=1 j=1 2h
Let Gij = G
�
ei −ej √ 2h
�
,c=
√ 1 2hN 2
and ct =
√ 1 2 2hNt
(5.37)
for t ∈ {−1, 1} where Nt is the
number of samples from class Ct . Then, if K is symmetrical about the origin
145
5.4. ESTIMATING THE ERROR DENSITY
(as is the Gaussian kernel) we may write VˆR2 = c
X X
Gij + c
i∈C-1 j∈C-1 � � N- 1 2 c-1
X X
Gij + c
i∈C-1 j∈C1
�
X X
Gij + c
i∈C1 j∈C-1 �2 X X
XX
Gij
i∈C1 j∈C1
X X N1 Gij Kij + 2c c1 N N i∈C1 j∈C-1 i∈C-1 j∈C-1 i∈C1 j∈C1 X X Gij . (5.38) = qˆ2 VˆR2 |-1 + pˆ2 VˆR2 |1 + 2c
=
X X
Gij +
i∈C1 j∈C-1
Entropy is, therefore, decomposed as a weighted sum of the error entropies for each class (as in the theoretic derivation) plus a term that relates the errors of one class with those of the other. For a small h this interference term is also small and VˆR2 will be close to VR2 . For large h the interference term will be large and the smoothing effect displayed in Figure 5.7 will show up and gives rise to an entropy minimum.
In this section we analyzed the MEE principle for the case of continuous errors. For simplicity reasons, we started to analyze the split-type setting, i.e., the setting where the bias weight is the sole parameter controlling the class discrimination. We always found a maximum (no turning between maximum and minimum as in the discrete errors case), usually displaced from the min P e position when the class error probabilities are different. In the perceptron-type setting, where both the input and bias weights are free to adjust, we found that for Gaussian classes MEE is able to work for appropriate choices (dependent on the proximity of the classes) of the parameter vector. Moreover, we have shown the important influence of the kernel density estimator, which was responsible, for a sufficiently large kernel bandwidth, to turn the entropy maximum into a minimum.
Chapter 6
Conclusions The application of the MEE principle to data classification is theoretically justifiable for three reasons: a) MEE uses a measure of the whole error pdf, whereas the popular MSE cost function relies solely on the error variance; therefore, when using MEE one is using more “information” than when using MSE. (A well-known result of probability theory states that any pdf can be expressed in terms of all its moments; MEE will not improve over MSE when the error distribution depends only on the second-order moment.) b) There are possible error distributions where MSE does not solve the classifier problem and MEE does solve (an example was shown in the Introduction). c) A theorem presented in [90] that we reproduced and generalized in section 3.1.1 shows that whenever the practical implementation of MEE with the Parzen window estimation of the error pdf achieves the entropy minimum, the error distribution will be driven towards a δ-Dirac function at zero (assuming appropriate supports of outputs and targets). These reasons together with the considerable success of previous practical applications of the MEE principle to many data classification problems using R´enyi’s quadratic entropy [90], motivated this study in several ways.
147
148
CHAPTER 6. CONCLUSIONS
First, we studied and tested the applicability of Shannon’s entropy of the error to the training of MLP classifiers. The results have shown that this is also a valid approach. Despite the use of the kernel density estimator to build the ˆ S of Shannon’s entropy, we have proved that the optimal solution is estimator H not affected, that is, it still has the δ-Dirac distribution as global minimum. Note that Lemma 2 also says that if we were dealing with regression (d dependent variables) we would need to correct the bias term of every output independently. We also found that the results are not particularly sensitive to the value of the smoothing parameter, provided this value is sufficiently high (usually above 1). In fact, from our experience a simple and coarse pdf estimation is all that is needed (note that what is important is to appropriately estimate the ˆ S ). Moreover, with h values higher than the direction of the gradient of H ˆ S becomes more smooth and ones usually recommended for pdf estimation, H local (undesired) behaviors tend to disappear. Nevertheless, and as suggested by Erdogmus and Pr´ıncipe [25], one could benefit from an adaptive h along the training process. However, despite some attempts, we could not find an appropriate strategy. We progressed to derive the Z-EDM cost function, raised from the ideas of entropic criteria that one should constraint the error distribution such as to have a higher peak at the origin. The algorithm becomes quite simple (in fact, the computational complexity is the same as the MSE counterpart) and the preliminary results have shown increased performance when compared to MSE. We also analyzed the gradients of MSE, CE and Z-EDM (the latter in its updated version, without some constants that were delaying the convergence process). In this analysis we found that a generalized exponential cost function dependent on a sole parameter τ could be created to emulate the behaviors of those functions (more precisely, an infinite family of functions). The experimental tests provided evidence that MLPs trained with this exponential function can achieve the best
149 results obtainable with classic cost functions and sometimes improve upon them. At this point we may question: what is the advantage of having a function with a parameter that we have to tune? Is it better than choosing from a set of cost functions? In our opinion, the answer to the latter question is Yes. Choosing from a set of cost functions usually implies switching between different implementations and using three or four different approaches. The additional work of tuning the parameter is overcome by the flexibility gained in adjusting the cost function to the problem at hand (this, of course, also applies to the entropic criteria). This advantages were shown in the experimental setting. An important focus of this Thesis was also to analyze theoretically the MEE principle when applied to data classification. We started by analyzing the case of discrete errors, or more precisely, the case of threshold-type learning machines. The relation between MEE and the theoretical Stoller split in univariate twoclass discrimination was the first to be studied. Besides the possible practical applications of this analysis to univariate data splitting with MEE (e.g. in tree classifier design using the popular univariate data splitting approach), the results derived from this analysis served as a first step to the theoretical assessment of MEE. Probably the most important result derived during this stage of our work, regarding continuous distributions, was that in order to obtain a correspondence between the MEE and min P e solutions, the class configurations must provide equal class error probabilities, which directly restricts the applicability of MEE in univariate splitting, in the sense that the optimal classifier may not be achieved. Moreover, we have shown that for certain class configurations one must use entropy maximization instead of minimization, depending on the proximity of the classes (in fact, we were able to determine exact turning values for some distributions). Nevertheless, we completely characterized MEE for the case of uniform classes, proving the match between the MEE and min P e solutions. The generalization to the perceptron-type machine brought an interesting result
150
CHAPTER 6. CONCLUSIONS
too: the minimum-to-maximum turning behavior generalizes to entropy saddle points. Given these findings we conclude that MEE is not an appropriate approach for perceptrons having step activation functions (discrete outputs) when the classes are close to each other (say, with means less than about 1.5 standard deviations apart). The study progressed to the case of continuous errors, where the machine is now equipped with a continuous activation function. In the simplest case, the split-type setting, two aspects are worth noting: a) in the cases studied MEE does not provide minimum-to-maximum turnings, and in fact, we always encounter a maximum, sometimes displaced from the min P e position; b) MEE does not work with linear activation functions; this was already discussed in section 3.1.1 and is related to the mean-invariance property of entropy. The more interesting results were obtained for the more realistic perceptron-type setting. Here we provided abundant evidence of the influence of the flexibility of the model and the kernel density estimator. When using MLPs in practice, as we did in Chapter 3, we are in fact using a highly parameterized model and ˆ S (or H ˆ Rα ). The smoothing effect the density estimation is always present in H of the (Gaussian) kernel, for sufficiently large kernel bandwidth, will in general turn the entropy maximum into a minimum. As a matter of fact, the kernel convolution for a large class of kernel functions corresponds to a low-pass filtering of the error pdf “signal”, enhancing its concentration around zero and driving it towards a δ-Dirac function. In the practical experiments we obtained average values for the smoothing parameter h, which can be used as lower bounds in practical applications. Moreover, the analysis at the end of Chapter 4 for the case of R´enyi’s entropy enlightened why the kernel smoothing will drive the error entropy towards a minimum. Perceptron training with MEE is therefore a setting where a rather surprising difference exists between theory and practice. Whereas in theory it often does
151 not solve the classifier problem, in practice and for sufficiently smooth pdf estimators it does. Future work This work presented contributions at several levels, including the proposal of new cost functions for neural network training and a carefull study of the minimum error principle for data classification. Of course, several new research directions are raised. We restrict ourselves to present some pointers: ˆ S and EExp could benefit from • In terms of practical implementations, both H different optimization algorithms or strategies like conjugate gradient or the batch-sequential method previously mentioned. This would, in principle, increase the convergence or reduce the computational complexity of the ˆS. algorithms, with obvious advantages mainly for H ˆ S and τ of EExp should be studied with the aim • Both the parameters h of H to obtain an adaptive procedure such that they are appropriately tuned during the training of the neural network. This is expected to bring better results in some cases and of course, would be an important advantage for the user. • The proposal of EExp obviously requires an equivalent study to the one performed for MEE. This would enlighten the capabilities of this new cost function and bring further insights on the influence of the parameter τ . • Another research direction of some importance would be to generalize the analysis conducted for MEE for more complex tasks, including more input dimensions.
Appendix A
Maximum Likelihood and Kullback-Leibler Divergence A.1
Maximum Likelihood
The maximum likelihood (ML) method allows the estimation of a probability density function p from a set of observations (realizations) of the random vector X. More precisely, and assuming a parameterized family of possible distributions pθ for p, ML allows the estimation of the vector parameter θ that best supports the observed set of i.i.d. realizations of X. Let DN = {xi : i = 1, . . . , N } be the set of available observations. The likelihood of DN for a given θ is given by the joint density i.i.d.
p(DN |θ) = p(x1 , x2 , . . . , xN |θ) =
N Y i=1
p(xi |θ).
(A.1)
Note that p(DN |θ) is a function of the vector θ and is not a density (probability) function. The maximization of (A.1) relative to θ seeks an estimator or estimate θˆ such that pθˆ is the best approximation of p within the family pθ . As the logarithm function is monotonic and given the exponential form of many common 153
154
APPENDIX A. ML AND KL DIVERGENCE
distributions, it is usual to maximize the log-likelihood instead of (A.1) L(θ|DN ) =
N X i=1
log p(xi |θ).
(A.2)
The method is quite appellative and has excellent mathematical properties especially for large N [68].
A.2
Kullback-Leibler Divergence
The Kullback-Leibler (K-L) divergence (or relative entropy) is a discrepancy measure between two probability distributions p and q. It is defined as (for the discrete case): KL(pkq) =
X
p(x) log
x
p(x) . q(x)
(A.3)
Note that K-L divergence is not a metric distance because it does not satisfy the symmetry property KL(pkq) 6= KL(qkp) nor the triangle inequality. However, it has some interesting properties such as KL(pkq) ≥ 0 and KL(pkq) = 0 iff p(x) = q(x). From (A.3) we observe that � � p(x) KL(pkq) = Ep log , q(x)
(A.4)
where Ep denotes the expected value relative to the distribution p. Thus, we may compute an empirical approximation by N p(xi ) 1 X log . KLN (pkq) = N q(xi )
(A.5)
i=1
Also we may write
KL(pkq) = HS (p, q) − HS (p) X X =− p(x) log q(x) + p(x) log p(x) x
≈−
(A.6) (A.7)
x
1 X 1 X log q(xi ) + log p(xi ), N N i
(A.8)
i
where HS (p) is the entropy associated with the distribution p and HS (p, q) is the cross-entropy between p and q.
155
A.3. UNIFYING APPROACH
A.3
Unifying Approach
It is now easy to unify both approaches. Consider expression (A.2).
The
maximization of L(θ|DN ) is equivalent to the maximization of (we now write pθ (xi ) instead of p(θ|xi ))
N N 1 X 1 X log pθ (xi ) − log p(xi ) N N i=1
(A.9)
i=1
N p(xi ) 1 X log , =− N pθ (xi )
(A.10)
i=1
because the right term in (A.9) is the empirical approximation of the entropy associated to p (see the final of section A.2), therefore does not depends on θ. This in turn is equivalent to the minimization of N X i=1
log
p(xi ) , pθ (xi )
(A.11)
which is the same as (A.5). Thus, maximum likelihood is intrinsically related to the Kullback-Leibler divergence: ML searches for the member of pθ closest to p using the (empirical) Kullback-Leibler divergence as a distance measure.
Appendix B
A Simple Monotonic Cost Function We can define a simple monotonic cost function for a two-class problem. We consider an MLP with one output per class y = (y1 , y2 ) and a class encoding defined by t = (t1 , t2 ) = (1, −1) and t = (t1 , t2 ) = (−1, 1) for classes C1 and C2 , respectively. A monotonic cost function should have contours parallel to y1 = y2 . This can be achieved with the following N
ESM F =
1X [(y1i − y2i ) − (t1i − t2i )]2 . 2
(B.1)
i=1
This is a simple transformation (rotation and shifting) of the parabolic cylinder z = x2 . Note that as ESM F ≥ 0 it has a global minimum when the outputs equal the targets. Figure B.1 shows the error surface and corresponding contour plot for patterns from C1 and C2 . The gradient can be calculated as �
∂ESM F ∂ESM F , ∂y1i ∂y2i
�
� = (y1i − y2i ) − (t1i − t2i ), −[(y1i − y2i ) − (t1i − t2i )] , (B.2) 157
158
APPENDIX B. A SIMPLE MONOTONIC COST FUNCTION
target t=(1,−1) 20 10 0 −1
0
1
0
1 −1
y1
y2
1
y2
0
−1 −1
0 y1
1
target t=(−1,1)
20 10 1
0 1
0
0
−1 −1
y2
y1
1
y2
0
−1 −1
0 y1
1
Figure B.1: At the top: Error surface and contour plots of ESM F in the presence of a pattern from C1 ; At the bottom: The same but for a pattern from C2 . where we note that
∂ESM F ∂y1i
SM F = − ∂E∂y . The flexibility of ESM F could be enhanced 2i
using the following version of (B.2): N
ESM F =
1X [(y1i − y2i ) − (t1i − t2i )]γ 2 i=1
(B.3)
159
x2
0.8
x4 x6
0.4
0 −1
0 x
1
Figure B.2: Effect of increasing the power of a polynomial function xγ . The parameter γ is an even integer positive number ensuring that ESM F is always non-negative. The major effect of increasing γ is exemplified in Figure B.2. The steepness is increased in regions far from the desired target, whereas in regions near the desired target the function is flattened.
Appendix C
ˆS Gradient and Hessian of H Consider the estimator for Shannon’s entropy of the error � � N N X X 1 xi − xj ˆS = − 1 log G , H N Nh h i=1
(C.1)
j=1
which can be re-written, to facilitate calculations, as
ˆ S = log(N h) − 1 log H N +
X j6=i
X l6=i
G
�
ei − ej h
�
+ G(0) +
� � X � el − ej � el − ei . (C.2) +G log G h h j6=i
If e1 , . . . , eN are the d-dimensional error vectors with ei = (e1i , . . . , edi ), we ˆ S can be seen as a function of e ¯ = (e11 , . . . , ed1 , e12 , . . . , edN ) and H ¯, define e ˆS ≡ H ˆ S (¯ ˆ S (¯ ¯ = 0. that is, H e). We derive the gradient and Hessian of H e) at e The partial derivative in order to a given eki is � � P ei −ej � e −e i l (e − e ) G X ˆ ki kj G (ekl − eki ) h ∂ HS 1 j6=i � � � �h − = � . P P 2 e −e e −e el −ei i j j l ∂eki Nh + G(0) +G l6=i j6=i G j6=i G h h h 161
ˆS APPENDIX C. GRADIENT AND HESSIAN OF H
162 Therefore ˆ S ∂H ∂eki
¯=0 e
=
1 (N − 1)G(0) × 0 − N h2 N G(0)
X G(0) × 0 N G(0)
l6=i
= 0,
ˆ S (0) = 0, or in other words, e ¯ = 0 is a critical point which means that ∇H ˆ S . The Hessian is obtained by computing second order partial derivatives, of H which can be found in the following pages. ˆ S ∂2H ∂e2ki e¯=0 2 ˆ ∂ HS ∂ekm ∂eki e¯=0 ˆ S ˆ S ∂2H ∂2H = ∂esi ∂eki ∂esm ∂eki ¯=0 e
¯ = 0 one obtains Substituting by e =
2(N − 1) , N 2 h2
=
−2 , N 2 h2
= 0,
(C.3) m 6= i,
m 6= i, s 6= k.
¯=0 e
(C.4) (C.5)
We recognize this Hessian as a generalization (for d > 1) of the one obtained in [25] for α = 1. In the cited paper, the Hessian is composed by a diagonal with equal entries, say A, and all non-diagonal elements equal to a value B 6= A. For example, with N = 3, one would get
A B B
B A B . B B A
(C.6)
The Hessian obtained here, generalizes (C.6) by inserting d − 1 diagonals with zero entries between its diagonals. For example, for d = 2, one obtains
A
0
B
0
B
0
B B 0 A 0 B 0 . 0 B 0 A 0 B B 0 B 0 A 0 0 B 0 B 0 A 0
A
0
B
0
(C.7)
163 The eigenvalue-eigenvector pairs are generalizations of the ones obtained in [25] and are given by Eigenvalue: λ1 = A + (N − 1)B = 0 with multiplicity d Eigenvectors: [1, 0, . . . , 1, 0, . . . , 0] d ones at positions 1 + (i − 1)d, i = 1, . . . , N − 1 [0, 1, . . . , 0, 1, . . . , 0] d ones at positions 2 + (i − 1)d, i = 1, . . . , N − 1 .. .. . . Eigenvalue: λ2 = A − B =
2 with multiplicity (N − 1) × d N h2
Eigenvectors: these are more difficult to describe ¯ = 0 is These eigenvalue-eigenvector pairs are used in Lemma 2 to show that e a minimum of error entropy. The formulas for the partial derivatives, due to their length, can be found in the following pages in a landscape orientation.
ˆ ∂2H
S 2 ∂eki
� i � i2 � h � ei −ej ei −ej 1 P + G(0) + (e − e ) G G ki kj 2 j6=i j6=i j6=i h h 1 h − = �i2 hP � 2 Nh el −ej G j h hP � � � �1 � �� �i � �2 el −ej el −ei el −ei el −ei 1 2 − G el −ei G G − (e − e ) (e − e ) G + G X h2 kl ki kl ki j6=i h h h h h h2 − hP � �i2 el −ej G l6=i j h h
h
P
−1 h2 G
�
ei −ej h
�
(eki − ekj )2 + G
�
ei −ej h
�ii hP
164
For s 6= k
ˆ ∂2H
S
∂esi ∂eki
=
h
1 N h2
−1 h2
i hP �i � ih � � i � h � ei −ej ei −ej ei −ej 1 (eki − ekj )(esi − esj ) + (e − e ) G (e − e ) G G si sj ki kj 2 j h h h h − hP � �i2 ei −ej G j h h hP i � �i � � � �1 el −ej el −ei el −ei 2 1 G G (e − e )(e − e ) (e − e )(e − e ) G − X h2 si si kl ki sl kl ki sl j h h h h2 − hP � �i2 el −ej l6=i jG h P
j6=i G
�
ei −ej h
�
For s 6= k and m 6= i � 1 ˆS ∂2H 1 h2 G = ∂esm ∂eki N h2
165
h � � �i � i� � hP � � ei −ej ei −ej 1 P m G (eki − ekm )(esi − esm ) G (esi − esm ) − (e − e ) G ei −e 2 ki kj j6=i j h h h h − hP � �i2 ei −ej G j h hP � �i � i� hP � � � � � � −1 e −e e −e m m j em −ei j 1 (e − e )(e − e ) G + (e − e ) G emh−ei (ekm − eki ) G G sm si sm sj km ki 2 2 j j6=m h h h h h − − �i2 hP � em −ej G j h � � �� � � e −e e −e 1 m i l l X 0− 2 G (ekl − eki ) G (esl − esm ) h h h − hP � �i2 el −ej l6=m,i jG h ei −em h
�
For m 6= i
h � � �i � i� � hP � � ei −ej ei −ej 1 P 2−1 m G (e − e ) (eki − ekm ) G − (e − e ) G ei −e 2 ki km ki kj j6 = i j h h h 1 h S = − hP � �i2 ∂ekm ∂eki N h2 ei −ej jG h �i � i� hP � hP � � � � � � e −e e −e m m em −ei j em −ei j 1 −1 2 + (e − e ) G (e − e ) + 1 G (e − e ) G G km kj km ki km ki 2 2 j j6 = m h h h h h h − − �i2 hP � em −ej jG h � � �� � � X 0 − 12 G el −ei (ekl − eki ) G el −em (ekl − ekm ) h h h − hP � �i2 el −ej l6=m,i G j h ˆ ∂2H
1 h2 G
ei −em h
��
Appendix D
A Result on the H¨ older Exponent Definition 2. Let α ∈ R+ and x0 ∈ R. A function f : R → R is said C [α] (x0 ) if exists L > 0 and a polynomial P of degree [α]1 such that
∀δ > 0 : |x − x0 | < δ ⇒ |f (x) − P (x − x0 )| ≤ L |x − x0 |α .
(D.1)
The maximum value of α that satisfies (D.1) is known as the H¨ older exponent of f at x0 . The polynomial P is the Taylor expansion of order [α] of f at x0 . The H¨older exponent α measures how irregular f is at the point x0 . The higher the exponent α, the more regular is f . Figure D.1 shows the behavior of f in a neighborhood of x0 for different values of α. Theorem 8. (Lu´ıs Silva et al. [102]) Let f : R → R be a continuous function, such that f ≡ 0 for x ≤ x0 and differentiable for x > x0 . If the H¨ older’s 1
[α] represents the largest integer less than α. If α is not an integer [α] ≡ ⌊α⌋,
otherwise [α] ≡ α − 1. 167
¨ APPENDIX D. A RESULT ON THE HOLDER EXPONENT
168
f(x)
α>1 α , dx 2 b −∞ where b is the base of the shadowed triangle in Figure D.12 . Thus f 2 (x) hR 2
x −∞ f (y)dy
i
df dx (x)
< 2.
Note that the behavior of f in this situation is similar to the case of f with
left limited support and α > 1.
Appendix E
Data Sets During this work we have used several real-world data sets covering many areas of application. In this appendix we present a description of each data set. We also used artificially generated data sets, the checkerboard, that we start to describe.
E.1
Artificial Data Sets
As artificial data sets we used checkerboard data sets such as the one shown in Figure E.1. Checkerboard data sets are complex, controllable and unbalanced data sets. We used two different configurations: 2×2 and 4×4 checkerboards. For each one of the configurations we built three data sets with different numbers of elements (patterns) but with a common characteristic: a fixed number of elements belonging to the minority class. The percentage of elements of this minority class is 50, 25 and 10% of the total number of elements. In Table E.1 we show the different characteristics of the checkerboard data sets.
169
170
APPENDIX E. DATA SETS
Figure E.1: An example of the 4×4 checkerboard data set with 400 points (100 elements in the minority class: dots). Dotted lines are for visualization purpose only.
Table E.1: The artificial checkerboard data sets, where k = 2, 4. Data set
# elements
# elements per class
CBk×k(200,50)
200
100-100
CBk×k(400,25)
400
300-100
CBk×k(1000,10)
1000
900-100
171
E.2. REAL-WORLD DATA SETS
E.2
Real-world Data Sets
The following table contains a brief description of the main characteristics of each of the real-world data sets used in this work. The last column is the source where the corresponding data set can be found. Table E.2: The real-world data sets used in this work. Data set CHD2 Corkstoppers CTG16 Glass Ionosphere Iris Liver New Thyroid Olive PB12 Pima Sonar Spambase Vehicle Vowelc Wdbc Wine
# samples 297 150 2126 214 351 150 345 215 572 608 768 208 4601 846 990 569 178
# features 13 10 16 9 33 4 6 5 8 2 8 60 57 18 10 30 13
# classes 2 3 10 6 2 3 2 3 9 4 2 2 2 4 11 2 3
source [79] [74] [74] [79] [79] [79] [79] [79] [33] [52] [79] [79] [43] [79] [79] [79] [79]
CHD2 This is one of the UCI databases of heart disease. The data was collected from the Cleveland Clinic Foundation and all attributes are numeric-valued. The goal is to detect the presence of heart disease in the patient. The original data distinguishes between four types of disease, but here we only consider the
172
APPENDIX E. DATA SETS
task of predicting the absence or presence of heart disease. Features: 1 2 3 4 5 6 7 8 9 10 11 12 13 14
age in years. sex (1 = male; 0 = female). chest pain type. resting blood pressure. serum cholesterol in mg/dl. (fasting blood sugar > 120 mg/dl). resting electrocardiographic results. maximum heart rate achieved. exercise induced angina. ST depression induced by exercise relative to rest. the slope of the peak exercise ST segment. number of major vessels (0-3) colored by flourosopy. 3 = normal; 6 = fixed defect; 7 = reversable defect. diagnosis of heart disease (angiographic disease status).
Class Distribution: Class Absence Presence
# samples
160 137
Corkstoppers Corkstoppers contains measurements made on binary images of cork stoppers defects in order to assess their quality.
E.2. REAL-WORLD DATA SETS
173
Features: 1 2 3 4 5 6 7 8 9 10
ART : Total area of the defects (in pixels). N : Total number of defects. PRT : Total perimeter of the defects (in pixels). ARM : Average area of the defects (in pixels). PRM : Average perimeter of the defects (in pixels) ARTG : Total area of big defects (in pixels). NG : Number of big defects (bigger than a specified threshold). PRTG : Total perimeter of big defects (in pixels). RAAR : Areas ratio of the defects. RAN : Ratio of the number of defects
Class Distribution: 50 cases for each of the 3 classes
CTG16 This data set consists on measurements of cardiotocographic (CTG) examinations [74]. Cardiotocography is a popular diagnostic method in Obstetrics, consisting on the analysis and interpretation of the foetal heart rate, the uterine contractions and the foetal movements. In this data set only the measures corresponding to the foetal heart rate signals and computed by an automatic system are included. The classification of the signal patterns was performed by expert obstetricians (following a clinical protocol). Six features have been discarded from the original data set as suggested in [74].
174
APPENDIX E. DATA SETS
The used features are: 1 2 3 4 5 6 7 8 9 10 11 12 13 14 15 16
Baseline value in b.p.m. Number of accelerations. Number of uterine contractions. Percentage of time with abnormal short term variability. Mean value of short term variability. Percentage of time with abnormal long term variability. Mean value of long term variability. Number of light decelerations. Histogram width (histogram of heart rate in b.p.m.). Low freq. of the histogram. High freq. of the histogram. Number of histogram peaks. Histogram mean. Histogram median. Histogram variance. Histogram tendency.
Class Distribution:
Class Calm sleep REM sleep Calm vigilance Active vigilance Shift pattern Accelerative/decelerative pattern Decelerative pattern Largely decelerative pattern Flat-sinusoidal pattern Suspect pattern
# samples
384 579 53 81 72 332 252 107 69 197
175
E.2. REAL-WORLD DATA SETS
Glass Study of classification of types of glass motivated by criminological investigation. At the scene of the crime, the glass left can be used as evidence...if it is correctly identified! Features: 1 2 3 4 5 6 7 8 9
RI: refractive index. Na: Sodium. Mg: Magnesium. Al: Aluminum. Si: Silicon. K: Potassium. Ca: Calcium. Ba: Barium. Fe: Iron.
Class Distribution: Class building windows (type 1) building windows (type 2) vehicle windows containers tableware headlamps
# samples
70 76 17 13 9 29
Ionosphere This is a radar data collected by a system in Goose Bay, Labrador. This system consists on a phased array of 16 high-frequency antennas. The targets were free electrons in the ionosphere. ”Good” radar returns are those showing evidence of some type of structure in the ionosphere. ”Bad” returns are those that do
176
APPENDIX E. DATA SETS
not. Received signals were processed using an autocorrelation function whose arguments are the time of a pulse and the pulse number. All the 34 features are numeric-valued, but one has removed since it has the same value (zero) for all elements. Class Distribution: (class value 1 is interpreted as ”good”)
Class 0 1
# samples
126 225
Iris
This is the well known Fisher’s Iris plants data set, perhaps the best known database to be found in the pattern recognition literature. Fisher’s paper [32] is a classic in the field and is referenced frequently to this day. The data set contains 3 classes, where each class refers to a type of Iris plant (Iris Setosa, Iris Versicolour and Iris Virginica). One class is linearly separable from the other 2; the latter are NOT linearly separable from each other. Features: (all numeric-valued)
1 2 3 4
Sepal length in cm Sepal width in cm Petal length in cm Petal width in cm
Class Distribution: 50 elements in each of 3 the classes.
177
E.2. REAL-WORLD DATA SETS
Liver This is a study on liver disorders in males created by the BUPA Medical Research Ltd. The first 5 variables are blood tests which are thought to be sensitive to liver disorders that might arise from excessive alcohol consumption. Features: 1 2 3 4 5 6
mcv - mean corpuscular volume. alkphos - alkaline phosphotase. sgpt - alamine aminotransferase. Isgot - aspartate aminotransferase. gammagt - gamma-glutamyl transpeptidase. drinks - number of half-pint equivalents of alcoholic beverages drunk per day.
Class Distribution: Class 0 1
# samples
200 145
New Thyroid This is a study with the aim of predicting the state of the thyroid gland. Five lab tests are used to try to predict the state of the patient’s thyroid to the class euthyroidism, hypothyroidism or hyperthyroidism. Features: 1 2 3 4 5
T3-resin uptake test. Total Serum thyroxin as measured by the isotopic displacement method. Total serum triiodothyronine as measured by radioimmuno assay. basal thyroid-stimulating hormone (TSH) as measured by radioimmuno assay. Maximal absolute difference of TSH value.
178
APPENDIX E. DATA SETS
Class Distribution: Class Normal Hyper Hypo
# samples
150 35 30
Olive This data set contains data from eight fatty acid contents of different olive oils from several regions of Italy [33]. The class distribution is as follows:
Class 1-North Apulia Calabria 2-Calabria 3-South Apulia 4-Sicily 5-Inner Sardinia 6-Coastal Sardinia 7-East Liguria 8-West Liguria 9-Umbria
# samples
25 56 206 36 65 33 50 50 51
PB12 The data set PB12 is a speaker independent, four-class, vowel discrimination problem [52]. The data consists on the first and second formants of the vowels [i], [I], [a] and [A] from 75 speakers (males, females and children) and is represented in Figure E.2. Vowels [i] and [I] form one overlapping pair of classes and vowels [a] and [A] form the other pair.
E.2. REAL-WORLD DATA SETS
179
Figure E.2: The PB12 data set.
Features: (all numeric-valued) 1
First formant value.
2
Second formant value.
Class Distribution: 152 elements per class.
Pima This is the result of a medical diagnostic investigating whether the patient shows sign of diabetes according to World Health Organization criteria. All the patients are females at least 21 years old of Pima Indians heritage.
180
APPENDIX E. DATA SETS
Features (all numeric-valued):
1 2 3 4 5 6 7 8
Number of pregnancies. Plasma glucose concentration at 2 hours in an oral glucose tolerance test. Diastolic blood pressure (mm Hg). Triceps skin fold thickness (mm). 2-Hour serum insulin (mu U/ml). Body mass index (weight in kg/(height in m)2 ). Diabetes pedigree function. Age (years).
Class Distribution: (class value 1 is interpreted as ”tested positive for diabetes”)
Class 0 1
# samples
500 268
Sonar This data set, is a study of the classification of sonar signals, containing 208 patterns obtained by bouncing sonar signals off a metal cylinder and rocks at various angles and under various conditions. Each pattern corresponds to a vector of 60 real numbers in the range 0.0 to 1.0, representing the energy within a particular frequency band, integrated over a certain period of time. Class Distribution:
Class Metal cylinder Rocks
# samples
111 97
181
E.2. REAL-WORLD DATA SETS
Spambase The data consists of information from 4601 email messages in a study to try to predict whether the email was spam. The relative frequencies of 57 of the most commonly occurring words and punctuation marks (for example, “george”, “you”, “!”, “‘remove”) in the email messages is recorded. Class Distribution:
Class spam non spam
# samples
1813 2788
Vehicle In this problem the objective is to classify a given silhouette as one of four types of vehicles, using a set of features extracted from the silhouette. The vehicle may be viewed from one of many different angles. The 18 features were extracted from the silhouettes by the HIPS (Hierarchical Image Processing System) extension BINATTS, which extracts a combination of scale independent features utilizing both classical moments based measures such as scaled variance, skewness and kurtosis about the major/minor axes and heuristic measures such as hollows, circularity, rectangularity and compactness. Class Distribution:
Class Opel Saab Bus Van
# samples
240 240 240 226
182
APPENDIX E. DATA SETS
Vowelc The problem is to recognize the eleven steady state vowels of British English using a specified training set of lpc derived log area ratios. The version used in this work is the modification of the original “Deterding Vowel Recognition Data” provided by Peter Turney, such as to include contextual information on the speaker’s gender and identity. Class Distribution:
Class Opel Saab Bus Van
# samples
240 240 240 226
Wdbc This is the Wisconsin Breast Cancer data set. The two classes, benign and malignant, are linearly separable using all 30 input features. These 30 features are obtained from 10 original features, computed from a digitized image of a fine needle aspirate (FNA) of a breast mass: 1 2 3 4 5 6 7 8 9 10
Radius (mean of distances from center to points on the perimeter). Texture (standard deviation of gray-scale values). Perimeter. Area. Smoothness (local variation in radius lengths). Compactness (perimeter2 / area - 1.0). Concavity (severity of concave portions of the contour). Concave points (number of concave portions of the contour). Symmetry. Fractal dimension (”coastline approximation” - 1).
183
E.2. REAL-WORLD DATA SETS
The 30 features are obtained by computing the mean, standard error, and ”worst” or largest (mean of the three largest values) of the original 10 features, computed for each image. Class distribution:
Class Benign Malignant
# samples
357 212
Wine The data is the result of a chemical analysis of wines grown in the same region in Italy but derived from three different cultivars. The analysis determined the quantities of 13 chemical constituents found in each of the three types of wines. The attributes are:
1 2 3 4 5 6 7 8 9 10 11 12 13
Alcohol. Malic acid. Ash. Alkalinity of ash. Magnesium. Total phenols. Flavanoids. Nonflavanoid phenols.. Proanthocyanins. Color intensity. Hue. OD280/OD315 of diluted wines. Proline.
The class distribution is as follows:
184
APPENDIX E. DATA SETS
Class
# samples
Cultivar 1
59
Cultivar 2
71
Cultivar 3
48
Bibliography [1] J. Acz´el and Z. Dar´ oczy.
On Measures of Information and Their
Characterization. Academic Press, 1975.
[2] I. Ahmad and P. Lin. A nonparametric estimation of the entropy for absolutely continuous distributions. IEEE Trans. Information Theory, 22:372–375, 1976.
[3] N. Ahmed and D. V. Gokhale. Entropy expressions and their estimators for multivariate distributions.
IEEE Trans. on Information Theory,
35(3):688–692, 1989.
[4] L. A. Alexandre and J. Marques de S´ a. Error entropy minimization for LSTM training. In 16th International Conference on Artificial Neural Networks, LNCS 4131, pages 244–253. Springer Verlag, 2006.
[5] R. Battiti.
Accelerated backpropagation learning: two optimization
methods. Complex Systems, 3:331–342, 1989.
[6] E. B. Baum and D. Haussler. What size net gives valid generalization? Neural Computation, 1(1):151–160, 1990. 185
186
BIBLIOGRAPHY
[7] E. B. Baum and F. Wilczek. Supervised learning of probability distributions by neural networks. In Dana Z. Anderson, editor, NIPS, pages 52–61. American Institute of Physics, 1987. [8] J. Beirlant, E. J. Dudewicz, L. Gy¨orfi, and E. C. van der Meulen. Nonparametric entropy estimation: an overview. Int. Journal of Mathematical and Statistical Sciences, 6(1):17–39, 1997. [9] A. Bell and T. Sejnowski. An information-maximization approach to blind separation and blind deconvolution. Neural Computation, 7(6):1129–1159, 1995. [10] R. Bellman. Adaptive Control Processes. Princeton University Press, 1961. [11] C. Bishop. Neural Networks for Pattern Recognition. Oxford University Press, 1995. [12] P. Comon. Independent component analysis, a new concept ?
Signal
Processing, 36(3):287–314. Special issue on Higher-Order Statistics. [13] T. M. Cover and J. A. Thomas. Elements of Information Theory. John Wiley & Sons, 1991. [14] I. Csisz´ar and J. Korner. Information Theory: Coding Theorems for Discrete Memoryless Systems. New York: Dover, 1981. [15] G. Cybenko. Approximation by superpositions of a sigmoidal function. Mathematics of Control, Signals and Systems, 2:304–314, 1989. [16] L. Devroye, L. Gy¨orfi, and G. Lugosi. A Probabilistic Theory of Pattern Recognition. Springer Verlag, 1996. [17] Y. G. Dmitriev and F. P. Tarasenko. On the estimation of functionals of the probability density and its derivatives. Theory of Probability and its Applications, 18(3):628–633, 1974.
187
BIBLIOGRAPHY
[18] R. Duda, Peter Hart, and D. Stork.
Pattern Classification.
Wiley-
Interscience, 2001. [19] D. Erdogmus.
Information Theoretic Learning: R´enyi’s Entropy and
its Applications to Adaptive System Training. PhD thesis, University of Florida, 2002. [20] D. Erdogmus, K. Hild II, and J. C. Pr´ıncipe. Blind source separation using R´enyi’s α−marginal entropies. Neurocomputing, 49:25–38, 2002. [21] D. Erdogmus and J. C. Pr´ıncipe. Comparison of entropy and mean square error criteria in adaptive system training using higher order statistics. In Intl. Conf. on ICA and Signal Separation, pages 75–80, Helsinki, Finland, 2000. [22] D. Erdogmus and J. C. Pr´ıncipe. Entropy minimization algorithm for multylayer perceptrons. In Intl. Joint Conf. on Neural Networks, pages 3003–3008, Washington, DC, 2001. [23] D. Erdogmus and J. C. Pr´ıncipe. Information transfer through classifiers and its relation to probability of error. In Intl. Joint Conf. on Neural Networks, pages 50–54, Washington, DC, 2001. [24] D. Erdogmus and J. C. Pr´ıncipe. An error-entropy minimization algorithm for supervised training of nonlinear adaptive systems. IEEE Transactions on Signal Processing, 50(7):1780–1786, 2002. [25] D. Erdogmus and J. C. Pr´ıncipe.
Generalized information potential
criterion for adaptive system training.
IEEE Transactions on Neural
Networks, 13(5):1035–1044, 2002. [26] D. Erdogmus and J. C. Pr´ıncipe.
Convergence properties and data
efficiency of the minimum error entropy criterion in adaline training. IEEE Transactions on Signal Processing, 51(7):1966–1978, 2003.
188
BIBLIOGRAPHY
[27] D. Erdogmus and J. C. Pr´ıncipe. Lower and upper bounds for misclassification probabilty based on Renyi’s information. Journal of VLSI Signal Processing, 37:305–317, 2004. [28] B. Van Es. Estimating functionals related to a density by a class of statistics based on spacings. Scandinavian Journal of Statistics, 19:61– 72, 1992. [29] R. M. Fano. Class notes for transmission of information. MIT, Cambridge, MA, 1952. Course 6.574. [30] J. Fisher and J. C. Pr´ıncipe. Entropy manipulation of arbitrary nonlinear mappings. In Intl. Work. on Neural Networks for Signal Processing, pages 14–23, Amelia Island, FL, 1997. [31] J. W. Fisher. Nonlinear Extensions to the Minimum Average Correlation Energy Filter. PhD thesis, University of Florida, 1997. [32] R. A. Fisher. The use of multiple measurements in taxonomic problems. Annual Eugenics, 7(II):179–188, 1936. [33] M. Forina and C. Armanino. Eigenvector projection and simplified nonlinear mapping of fatty acid content of italian olive oils. Ann. Chim. (Rome), 72:127–155, 1981. [34] K. Fukunaga. Introduction to Statistical Pattern Recognition (2nd ed.). Academic Press Professional, Inc., 1990. [35] H. Gish. A probabilistic approach to the understanding and training of neural network classifiers. In Proceedings of the 1990 IEEE International Conference on Acoustics, Speech, and Signal Processing, ICASSP-90., 1990. [36] E. Gokcay and J. C. Pr´ıncipe. Information theoretic clustering. IEEE Trans. on Pattern Analysis and Machine Learning, 24(2):158–171, 2002.
189
BIBLIOGRAPHY
[37] D. V. Gokhale. Maximum entropy characterization of some distributions. In Kotz Patil and Ord. Eds., editors, Statistical Distributions in Scientific Work, volume 3, pages 299–304, 1975. [38] L. Gy¨orfi and E. van der Meulen. Density-free convergence properties of various estimators of entropy. Computational Statistics & Data Analysis, 5(4):425–436, 1987. [39] L. Gy¨orfi and E. van der Meulen. An entropy estimate based on a kernel density estimation. Limit Theorems in Probability and Statistics, 57:229– 240, 1990. [40] L. Gy¨orfi and E. van der Meulen.
On the nonparametric estimation
of entropy functional. In G. Roussas, editor, Nonparametric Functional Estimation and Related Topics, pages 81–95. Kluwer Academic Publisher, 1991. [41] P. Hall and S. Morton. On the estimation of entropy. Annals of the Institute of Statistical Mathematics, 45:69–88, 1993. [42] L. Han. Kernel Partial Least Squares (K-PLS) for Scientific Data Mining. PhD thesis, Rensselaer Polytechnic Institute, 2007. [43] T. Hastie, R. Tibshirani, and J. Friedman. The Elements of Statistical Learning. Springer Verlag, 2001. [44] J. H. Havrda and F. Charvat. Quantification methods of classification processes: concept of structural entropy. Kybernetica, 3:30–35, 1967. [45] S. Haykin. Neural Networks: a Comprehensive Foundation. Prentice Hall, 1999. [46] K. Hild II, D. Erdogmus, and J. C. Pr´ıncipe. Blind source separation using R´enyi’s mutual information. IEEE Signal Processing Letters, 8:174–176, 2001.
190
BIBLIOGRAPHY
[47] G. E. Hinton. Connectionist learning procedures. Artificial Intelligence, 40(1-3):185–234, 1989. [48] K. Hornik, M. B. Stinchcombe, and H. White. Multilayer feedforward networks are universal approximators. Neural Networks, 2(5):359–366, 1989. [49] J. B. Hampshire II and B. A. Pearlmutter.
Equivalence proofs for
multilayer perceptron classifiers and the Bayesian discriminant function. In Proceedings of the 1990 Connectionist Models Summer School, 1990. D. Touretzky, J. Elman, T. Sejnowski, and G. Hinton, eds. Morgan Kaufmann, San Mateo, CA., 1990. [50] J.B. Hampshire II and A. Waibel.
A novel objective function for
improved phoneme recognition using time-delay neural networks. IEEE Transactions on Neural Networks, 1(2):216–228, 1990. [51] A. V. Ivanov and A. Rozhkova. Proprieties of the statistical estimate of the entropy of a random vector with a probability density. Problems of Information Transmission, 17:171–178, 1981. [52] R. Jacobs, M. Jordan, S. Nowlan, and G. Hinton. Adaptive mixtures of local experts. Neural Computation, 3:79–87, 1991. [53] R. A. Jacobs.
Increased rates of convergence through learning rate
adaptation. Neural Networks, 1:295–307, 1988. [54] P. Janssen, J. Marron, N. Veraverbeeke, and W. Sarle. Scale measures for bandwidth selection. Journal of Nonparametric Statistics, 5:359–380, 1995. [55] E. T. Jaynes. Information theory and statistical mechanics. Physical Review, 106(4):620–630.
BIBLIOGRAPHY
191
[56] R. Jenssen, K. E. Hild, D. Erdogmus, J. C. Pr´ıncipe, and T. Eltoft. Clustering using R´enyi’s entropy. In Int. Joint Conference on Neural Networks, pages 523–528, 2003. [57] H. Joe.
On the estimation of entropy and other functionals of a
multivariate density. Annals of the Institute of Statistical Mathematics, 41:683–697, 1989. [58] J. N. Kapur. Maximum-Entropy Models in Science and Engineering. John Wiley & Sons, New York, 1993. [59] J. N. Kapur. Measures of Information and Their Applications. John Wiley & Sons, New York, 1994. [60] J. N. Kapur and H. K. Kesavan. Entropy Optimization Principles with Applications. Academic Press, Inc., New York, 1992. [61] L. F. Kozachenko and N. N. Leonenko. Sample estimate of the entropy of a random vector. Problems of Information Transmission, 23(2):95–101, 1987. [62] S. Kullback. Statistics and Information Theory. Wiley, 1959. [63] S. Kullback and R. A. Leibler. On information and sufficiency. Ann. of Math. Stat., 22:79–86, 1951. [64] C. A. Lai, D. Erdogmus, and J. C. Pr´ıncipe. Echo cancellation by global optimization of kautz filters using an information theoretic criterion. In ICASSP, volume 6, pages VI 197–VI–200, 2003. [65] A. Lapedes and R. Farber. How neural nets work. In Neural Information Processing Systems, pages 442–456, 1988.
192
BIBLIOGRAPHY
[66] A. Verdugo Lazo and P. N. Rathie.
On the entropy of continuous
probability distributions. IEEE Trans. on Information Theory, 24:120– 122, 1978. [67] T. Lee, M. Girolami, A. J. Bell, and T. J. Sejnowski.
A unifying
information-theoretic framework for independent component analysis. Computers and Mathematics with Applications, 39(11):1–21, 2000. [68] F. Lewis. Optimal Estimation. With an Introduction to Stochastic Control Theory. John Wiley & Sons, 1986. [69] R. Linsker. Self-organization in a perceptual network. IEEE Computer, 21:105–117, 1988. [70] R. P. Lippmann. An introduction to computing with neural nets. IEEE ASSP Magazine, April:4–22, 1987. [71] M. Møller. Efficient Training of Feed-Forward Neural Networks. PhD thesis, Computer Science Department - Aarhus University, 1993. [72] G. D. Magoulas, M. N. Vrahatis, and G. S. Androulakis. Improving the convergence of the backpropagation algorithm using learning rate adaptation methods. Neural Computation, 11(7):1769–1796, 1999. [73] J. Marques de S´ a. Pattern Recognition: Concepts, Methods and Applications. Springer Verlag, 2001. [74] J. Marques de S´ a. Applied Statistics Using SPSS, STATISTICA and MATLAB. Springer, 2007. [75] K. Matsuoka and J. Yi. Backpropagation based on the logarithmic error function and elimination of local minima. In Proceedings of the 1990 IEEE International Joint Conference on Neural Networks., 1991.
BIBLIOGRAPHY
193
[76] W. S. McCulloch and W. Pitts. A logical calculus of the ideas immanent in nervous activity. Bulletin of Mathematical Biophysics, 5:115–133, 1943. [77] M. L. Minsky and S. A. Papert. Perceptrons. MIT Press, 1969. [78] T. Mitchell. Machine Learning. McGraw-Hill, 1997. [79] D. J. Newman, S. Hettich, C. L. Blake, and C. J. Merz. UCI repository of machine learning databases. 1998. [80] E. Parzen. On the estimation of a probability density function and the mode. Annals of Mathematical Statistics, 33:1065–1076, 1962. [81] W. Press, S. Teukolsky, W. Vetterling, and B. Flannery. Numerical Recipes in C: The Art of Scientific Computing. Cambridge University Press, 1992. [82] J. C. Pr´ıncipe, D. Xu, and J. Fisher. Information theoretic learning. In S. Haykin, editor, Unsupervised Adaptive Filtering, vol. I: Blind Source Separation, pages 265–319. Wiley, New York, 2000. [83] J. C. Pr´ıncipe, D. Xu, Q. Zhao, and J. W. Fisher. Learning from examples with information theoretic criteria. Journal of VLSI Signal Processing Systems, 26(1-2):61–77, 2000. [84] A. R´enyi. Probability Theory. North-Holland Publishing Company, 1970. [85] A. R´enyi. On measures of entropy and information. Selected Papers of Alfred R´enyi, 2:565–580, 1976. [86] M. D. Richard and R. P. Lippmann. Neural network classifiers estimate Bayesian a posteriori probabilities. Neural Computation, 3:461–483, 1991. [87] F. Rosenblatt. The perceptron: a probabilistic model for information storage and organization in the brain. Psychological Review, 65:368–408, 1958.
194
BIBLIOGRAPHY
[88] M. Rosenblatt. Remarks on some nonparametric estimates of a density function. Annals of Mathematical Statistics, 27:832–835, 1956. [89] D. Rumelhart, G. Hinton, and R. Williams. Learning representations by back-propagating errors. Nature, 323:533–536, 1986. [90] J. M. Santos.
Data classification with neural networks and entropic
criteria. PhD thesis, University of Porto, 2007. [91] J. M. Santos, L. A. Alexandre, and J. Marques de S´ a. The error entropy minimization algorithm for neural network classification. In Ahmad Lofti, editor, Int. Conference on Recent Advances in Soft Computing, pages 92– 97, 2004. [92] J. M. Santos, L. A. Alexandre, and J. Marques de S´ a. Modular neural network task decomposition via entropic clustering. In Int. Conference on Intelligent Systems Design and Applications, pages 62–67. IEEE Computer Society Press, 2006. [93] J. M. Santos, J. Marques de S´ a, and L. A. Alexandre. Batch-sequential algorithm for neural networks trained with entropic criteria.
In Int.
Conference on Artificial Neural Networks, LNCS 3697, pages 91–96. Springer Verlag, 2005. [94] J. M. Santos, J. Marques de S´ a, and L. A. Alexandre. Neural networks trained with the EEM algorithm:
tuning the smoothing parameter.
WSEAS Transactions on Systems, 4(4):295–300, 2005. [95] J. M. Santos, J. Marques de S´ a, and L. A. Alexandre.
LEGClust
- a clustering algorithm based on layered entropic subgraphs.
IEEE
Transactions on Pattern Analysis and Machine Intelligence, 2007. [96] J. M. Santos, J. Marques de S´ a, L. A. Alexandre, and F. Sereno. Optimization of the error entropy minimization algorithm for neural
195
BIBLIOGRAPHY
network classification.
In C. H. Dagli, A. L. Buczak, D. L. Enke,
M. J. Embrechts, and O. Ersoy, editors, Intelligent Engineering Systems Through Artificial Neural Networks, volume 14, pages 81–86. ASME Press, 2004. [97] C. E. Shannon. A mathematical theory of communication. Bell System Technical Journal, 27:379–423, 623–656, 1948. [98] F. Silva and L. Almeida. Speeding up backpropagation. In Eckmiller R., editor, Advanced Neural Computers, pages 151–158, 1990. [99] L. M. Silva, L. A. Alexandre, and J. Marques de S´ a. New developments of the Z-EDM algorithm. In Int. Conference on Intelligent Systems Design and Applications., volume 1, pages 1067–1072. IEEE Computer Society Press, 2006. [100] L. M. Silva, L. A. Alexandre, and J. Marques de S´ a. Data classification with multilayer perceptrons using a generalized error function. Accepted for publication in Neural Networks. [101] L. M. Silva, L.A. Alexandre, and J. Marques de S´ a. Neural network classification:
maximizing zero-error density.
In Int. Conference on
Advances in Pattern Recognition, volume LNCS 3686, pages 127–135, 2005. [102] L. M. Silva, C. Felgueiras, L. A. Alexandre, and J. Marques de S´ a. Error entropy in classification problems: a univariate data analysis. Neural Computation, 18(9):2036–2061, 2006. [103] L. M. Silva, J. Marques de S´ a, and L. A. Alexandre. The MEE principle in data classification: a perceptron-based analysis. submitted to Neural Computation.
196
BIBLIOGRAPHY
[104] L. M. Silva, J. Marques de S´ a, and L. A. Alexandre. Neural network classification using Shannon’s entropy.
In European Symposium on
Artificial Neural Networks, pages 217–222, 2005. [105] B. W. Silverman. Density Estimation for Statistics and Data Analysis, volume 26. Chapman & Hall, 1986. [106] S. A. Solla, E. Levin, and M. Fleisher. Accelerated learning in layered neural networks. Complex Systems, 2(6):625–639, 1988. [107] D. Stoller. Univariate two-population distribution free discrimination. Journal of the American Statistical Association, 49:770–777, 1954. [108] J. Thompson and R. Tapia. Nonparametric Probability Density Estimation. The John Hopkins University Press, 1978. [109] V. Vapnik. Statistical Learning Theory. Wiley-Interscience, 1998. [110] O. Vasicek. A test for normality based on sample entropy. Journal of the Royal Statistical Society: Series B, 36:54–59, 1976. [111] M. Wand and M. Jones. Kernel Smoothing. Chapman & Hall, 1995. [112] P. J. Werbos. Roots of Backpropagation. Wiley, 1994. [113] B. Widrow and M. E. Hoff. Adaptive switching circuits. In 1960 IRE WESCON Conv. Records, volume 4, pages 96–104. Institute of Radio Engineers (now IEEE), 1960. [114] D. Xu. Energy, Entropy and Information Potential for Neural Computation. PhD thesis, University of Florida, 1999. [115] D. Xu and J. C. Pr´ıncipe. Learning from examples with quadratic mutual information. In Neural Networks for Signal Processing VIII, IEEE Signal Processing Society Workshop, pages 155–164, 1998.
BIBLIOGRAPHY
197
[116] H. Yang and S. Amari. Adaptive on-line learning algorithms for blind separation: maximum entropy and minimum mutual information. Neural Computation, 9(7):1457–1482, 1997. [117] H. Yang, S. Amari, and A. Cichocki. Information-theoretic approach to BSS in non-linear mixture. Signal Processing, 64(3):291–300, 1998.