New Detection Method Based on ECG Signal Features to Determine Localization and Extent of Myocardial Infarction using Body Surface Potential Map Data Naser Safdarian1, Nader Jafarnia Dabanloo1, Gholamreza Attarodi1 1
Biomedical Engineering, Science and Research Branch, Islamic Azad University, Tehran, Iran
infarction. Combination of these may be seen, such as Antero-lateral infarction and infero-posterior infarction. In 12-leads ECG, there is lack of adequate and appropriate detection of acute MI. In fact, 50% of patients with MI in the early stages are not recognized, because this abnormally does not correctly detect in the standard ECG [37-4]. Mirvis [37] summarizes the four main advantages of utilizing BSPMs whilst comparing BSPMs to other ECG acquisition methods: - Sensitive to regional cardiac events. - Widespread, direct torso sampling. - Emphasis on spatial features of cardiac field, - Permits evaluation of cardiac equivalent generator models.
Abstract In this study, a method for determining the location and extent of myocardial infarction using BSPM data that was obtained from PhysioNet challenge 2007 database has been suggested. This data is related to the four patients with MI that we used from two patients as training set to determine rules, and from two other patients for testing set and the conclusion of the proposed model. At first, T-wave amplitude, R-wave amplitude and integration of T-wave as three features of ECG signals were extracted. Then with definition and applying several rules and threshold levels for those features, areas that are with MI and these extents were diagnosed. In this study to determine the precise location of MI, 17segments standard model of left ventricle (LV) was used. Finally, overall accuracy of this method that expressed with SO parameter and EPD parameter for two patients in test set was obtained to 0.94 and 5.37, respectively. The main advantages of this method were its simplicity and high accuracy.
1.
2.
In this section, several examples of previous research about detection of MI using BSPM data were described. In 2007 H.SadAbadi et al, were presented method using the several rules on the feature extracted of ECG to determine extent and location of the MI on PhysioNet Challenge 2007 and features such as Q-wave amplitude and ST segment dispersion was extracted, and finally achieved good results [1]. In 2010 Jafarnia Dabanloo et al, presented a method and extracted features such as Q- wave integrals and QRScomplex integrals, and they definition rules on these features to determine the location of MI [2]. In 2007 P Zarychta et al [10], using PhysioNet Challenge 2007 database were offered Clinical evaluation method based on the ECG recorded and Body Surface Potential Map with 120 leads by views three cardiologists. They stated that abnormal initial depolarization (in the Qwave) and initial repolarization (in ST-segment) are important factors of chronic and acute MI, respectively. The overall accuracy of that method for first test patient (case#3) were obtained that regions 3,4,9,10 of left ventricle have MI and extent of MI in this patient was 30%, and for case#4 has not reported [10]. In this paper by proposed method, at first regions of left ventricle with MI were detected. Then results of the exact location and extent of MI to be comparable with MRI
Introduction
A myocardial infarction or heart attack occurs when a coronary artery is completely blocked. Regional from myocardial blood flow by a coronary artery, the blood flow to the will lose and deprived of oxygen and other nutrients. During an acute myocardial infarction, ECG consists of three steps: T-wave rising then T-wave inversions, ST segment elevation, find new Q-wave. Region of myocardial infarction is dependent to where the coronary arteries and blood flow are blocked. There are two main blood supply to the myocardium; one of them blood supply to the right side of the heart (right coronary artery) and another was blood supply the left heart (left main artery). Almost all myocardial infarction involve left ventricular, because the left ventricle are largest muscle of the heart cavities and therefore more work is secured. Thus, left ventricle by lack of blood flow is the most vulnerable. Infarctions can be divided into several anatomical groups that called inferior infarction, lateral infarction, anterior infarction and posterior
cinc.org
Review of previous research
505
Computing in Cardiology 2012; 39:505-508.
analysis results, and thus the accuracy of the proposed method can be obtained.
3.
Materials
3.1.
Database
amplitude and T-wave integral for all signals in 352 nodes were extracted.
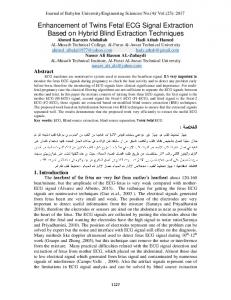
In this study we used PhysioNet Challenge 2007 database [12]. This database consists of ECG signals for four patients with MI, that MI in these signals determined using MRI analysis and also by expert persons. Body Surface Potential Map (BSPM) data is including ECG signals from 352 positions on torso plane that horizontal and vertical lines assumed on torso plane as figure 1. In this figure, torso plane consist of 17 horizontal lines and 32 vertical lines that placed electrodes in encounter all lines.
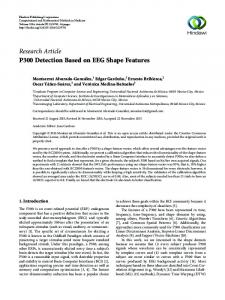
Figure 2. Left ventricle model and name of each element [9]
Then, depending on whether each of horizontal and vertical lines included which lead, we have plotted the extracted features from each signal. Also, results of these features extracted from horizontal lines and vertical lines were plotted separately. Results of this operation for two patients as training set were shown in figure 3,4,5,6. Now the relationship between horizontal and vertical lines on torso plane with model of the left ventricle is express. Relationship between vertical lines in torso plane and model of left ventricle expressed [1]. In this paper, we obtained relationship between horizontal lines on torso plane and model of left ventricle. This segmentation and relationship based on mass distribution as 35%, 35% and 30% respectively for the basal, mid-cavity and the apex of the heart were obtained. According to the torso plane are 17 horizontal lines, we made 35% of these lines for basal segment (i.e. segments 4,5,6,1,2,3 in left ventricle model), 35% of these lines for mid-cavity segment (i.e. segments 10,11,12,7,8,9) and 30% of these lines for apex segment (i.e. segments 15,16,13,14,17) (see figure 7). Then with the combination of this segmentation and relationship between horizontal and vertical lines on torso plane, and intersection between those we can reach to localization and extent of myocardial infarction.
Figure 1.Horizontal and vertical lines on torso plane [1]
BSPM has two main advantages rather than 12-leads ECG [1]: - Circumnavigate and full review of all chest surface. - Is more sensitive to the local electrical events.
3.2.
Standard model of left ventricle
Figure 2 as shown model of left ventricle (with 17 elements) with mass distribution of 35%, 35% and 30% respectively for the basal, mid-cavity and the apex of the heart, that this segmentation is very close to the autopsy values [9]. The following figure shows a circle diagram (Bulls-eye), position and proposed names for all 17 elements in model of the left ventricle. Apex, which is define as the segment 17 represent a pure muscle in extreme of the heart [9].
4.
4.1.
Detection and localization of MI
To identify segments with MI, we defined several rules on any of the features extracted. We proposed one rule for each feature, and by applying that rules on extracted features can be detection regions of heart with MI. In this study, we get rules for the case#1 and case#2 patients until for each patient obtain an accurate and situation results about location of MI. Then these correct rules applied on features of case#3 and case#4 to obtain location of MI in these patients as test set.
Proposed method
After give database, all signals in this database were load by MATLAB software. Then, according to we have all signals information (352 nodes for each patient), shape of each signal was plotted. The signal in each of the 352 leads on torso plan has a one ECG cycle that at first ECG waveform corresponding to each Leads was plotted, then some features such as T-wave amplitude, R-wave
506
Figure 3.Results of feature extraction according to horizontal lines numbers for case#1 (first training patient)
Figure 6.Results of feature extraction according to vertical lines numbers for case#2 (second training patient)
Figure 7.Relationship between horizontal & vertical lines on torso plane and all segment of left ventricle model Figure 4.Results of feature extraction according to vertical lines numbers for case#1 (first training patient)
4.2.
Rules definition for extracted features
At first, a threshold level as first rule on extracted feature of R-wave amplitude in horizontal lines of torso plane, and also another rule on T-wave amplitude in horizontal lines of torso plane were defined. These rules were determined in figure 8 and figure 9, respectively.
Figure 5.Results of feature extraction according to horizontal lines numbers for case#2 (second training patient)
Figure 8.Rule definition on R-wave amplitude as extracted
507
from horizontal lines
accuracy. In this research, after applying rules on extracted feature, location and extent of MI for case#3 and case#4 were obtained according to the table 1. Finally, result of SO parameter for the two patient as test set was equal to SO(Total)=SOCase#3+SOCase#4=0.5+0.44 =0.94. Also result of EPD parameter was obtained to EPD(total)=EPDCase#3+EPDCase#4=4.97+0.4=5.37. Table 1) Results of proposed method for Case#3 and Case#4
Figure 9.Rule definition on T-wave amplitude as extracted from horizontal lines
After applying these rules on R-wave amplitude and Twave amplitude, and consideration relationship between vertical and horizontal lines and left ventricle model, we could estimate location of MI by proposed method.
4.3.
6.
Determination of MI extent
In this study, a new method for detection, localization and extent of MI using BSPM data based on applying threshold level on extracted features were proposed. Results are compared with results of MRI analysis. These results show high accuracy for localization and extent of MI by applying defined rules on feature extracted. The two main advantage of this method are simplicity and high accuracy.
For determination of MI extent, T-wave integral as one feature was used. This extracted feature for case#1 and case#2 as training set are shown in third parts of figure 3 and figure 5, respectively. At first, a rule on the extracted feature as following equation was defined: 𝑀𝐼 𝑒𝑥𝑡𝑎𝑛𝑡 = [(|𝑀𝑖𝑛 𝑇 𝑤𝑎𝑣𝑒 𝐼𝑛𝑡𝑒𝑔𝑟𝑎𝑙|) ∗ 15.5] ∗ 𝛼
(1)
Acknowledgements
Where 15.5 is a coefficient obtained from T-wave integral feature as to two training set patients (case#1 & case#2), and 𝛼 is a scaling coefficient. Thus an estimate from percentage of MI extent was achieved. Now this equation on feature of two patients as training set was used. With maximum and minimum values of these features we proceed to the final conclusion equation1.
5.
Conclusion
With special thanks to Science and Research Branch, Islamic Azad University, Tehran, Iran.
References [1] Mirvis DM. Current status of body surface electrocardiographic mapping, Circulation 1987;75:684-8. [2] Menown IBA, Patterson RSH, et al. Body-surface map models for early diagnosis of acute myocardial infarction. Journal of Electrocardiology 198;31:180-188. [3] SadAbadi H, Jalali A, Ghasemi M, et al. Variation of ECG Features on Torso Plane: An Innovative Approach to Myocardial Infarction Detection. Computers in Cardiology 2007;34:629−632. [4] Dabanloo NJ, SadAbadi H, Sabouri S. Neural Network Classification of Body Surface Potential Contour Map to Detect Myocardial Infarction Location. Computers in Cardiology 2010. [5] Zarychta P, Smith PE, King ST et al. Body Surface Potential Mapping for Detection of Myocardial Infarct Sites. Computers in Cardiology 2007;34:181−184. [6] www.PhysioNet.org/ PhysioNet Challenge 2007 database. [7] Cerqueira MD et al. Standardized Myocardial Segmentation and Nomenclature for Tomographic Imaging of the Heart. Circulation 2002;105:539-542.
Results
SO (Section Overlap) parameter is a standard to determine location of MI for different methods operation [12]. This parameter comes from dividing the number of common elements between the diagnostic elements by proposed method with elements of MI in reality, per sum of the common elements and elements that are not detected by the proposed method and elements that are healthy but by proposed method have been diagnosed with MI. This parameter is a number between zero and one that whatever the number is closer to one performance of the proposed method is better [12]. Also, EPD parameter was defined as percentage discrepancy between the extent of the infarct as estimated by my method, and the extent of the infarct as determined from the gold standard. The value of EPD parameter is number between 0 and 8, that the lower value reflects the higher
Address for correspondence: Nader Jafarnia Dabanloo:
[email protected].
508