NEWBORN EEG SEIZURE SIMULATION USING TIME–FREQUENCY SIGNAL SYNTHESIS N. Stevenson, L. Rankine, M. Mesbah and B. Boashash Signal Processing Research Centre, Queensland University of Technology, 2 George St, Brisbane, QLD, 4001, Australia, GPO Box 2434
[email protected]
Abstract This paper presents a new method of simulating electroencephalogram (EEG) signals induced by a particular form of newborn seizure. The technique utilises time– frequency signal synthesis. The simulation is based on a nonstationary multicomponent waveform with piecewise linear frequency modulation (LFM). The time–dependent spectral magnitude of the piecewise LFM multicomponent signal is assigned a slowly oscillating envelope and used to construct a time–frequency image. The time–frequency image is used to synthesise a time-domain signal using the modified short–time Fourier transform (MSTFT) magnitude method. The simulated seizures are varied according to several parameters outlined in the literature to provide a large database of EEG seizures. A comparison of the spectrograms of simulated and real seizure results in an average, two–dimensional correlation coefficient of 0.8 (N=5).
1. Introduction Electroencephalography (EEG) is the study of the electrical activity of the brain using measurements taken from scalp electrodes. It is an important tool in the study of central nervous system (CNS) function, particularly in the newborn. Unlike adult EEG, the signal structure of newborn EEG has high prognostic and diagnostic capability, [1]. In the newborn, EEG is primarily used to identify the existence of seizure. In this instance, the EEG plays a critical role as clinical signs of seizure detection such as muscle spasms, are not clearly present in the newborn as a result of ventilation restraints and anti–convulsive medication. The presence of seizure in newborn EEG indicates neural abnormality which may lead to permanent damage or death. Normal or background EEG consists of low frequency
bursts of activity or irregular random activity. The frequency content of most newborn EEG signals is between 0.4-7.5Hz, [2]. A seizure is defined as an excessive synchronous discharge of neurons within the brain and can last from 10 seconds to upwards of 20 minutes [3, pp. 664]. A class of newborn EEG seizure has been defined, using engineering terminology, as containing linear frequency modulated (LFM) or piecewise LFM signal structures [4]. Seizure may take other forms such as periodic “spiky” behaviour, or repetitive bursts of EEG activity which result in a spectral whitening in the time–frequency domain. However, the goal of this paper is to simulate seizure that exhibits piecewise LFM signal behaviour. The need for accurate, 24 hour monitoring of newborn EEG has encouraged the development of automated systems to highlight possible periods of interest. Several signals processing techniques, such as correlation, spectral analysis, wavelet transform, matching pursuits and time– frequency distribution based singular value decomposition, have been developed to detect seizure in the newborn, [2, 5, 6, 7, 8]. However, limitations in the training and evaluation data sets have meant that the confidence in the analysis results is reduced and comparisons between techniques are nonexistent. Specific problems with neurologist marked EEG data sets include; a defined level of accuracy, the lack of a publicly available signal database, and the precise localisation of seizure events. A realistic simulation of seizure would permit the comparison of current techniques and provide additional insight into EEG seizure for the next generation of detection techniques [9]. Currently, two models are available to simulate newborn EEG seizure. The first technique developed by Roessgen in [10] is based on some physiological parameters of the brain and utilises a stationary sawtooth waveform. This technique was recently extended by Boashash and Mesbah in [4] to incorporate a single LFM signal. Celka and Colditz have
also developed a piecewise LFM model of seizure based on a Weiner filter with sawtooth inputs and nonlinear gain, [9]. The authors outlined a technique to validate their model based on Kullback–Leibler divergence and Renyi entropies, [9]. The Roessgen model lacks the incorporation of nonstationarity, while Boashash’s and Mesbah’s addition only handles single LFM behaviour, not the piecewise LFM often seen in seizure. Celka’s and Colditz’s method provides a quality simulation of seizure but lacks time dependent signal shape or time–dependent harmonic magnitude variation. Another difficulty is its inability to simulate the transient, “spiky”, activities. This paper uses the generic piecewise LFM seizure pattern outlined in the work of Boashash and Mesbah, [4], to generate a time–frequency template image which is then synthesised into a time domain signal using the modified short–time Fourier transform (MSTFT) magnitude method, [11]. The advantage of using direct signal synthesis over other techniques is its relative simplicity, its ability to handle spectral distortion and the discontinuities of the piecewise instantaneous frequency (IF) law. In addition, this technique can provide a larger variety of seizure waveforms, within BT product limits (signal richness), [3, pp. 18], depending on the fundamental time–frequency template or templates chosen. This modularity has an advantage over a method such as Celka’s which would require additional complexity to incorporate other forms of seizure. The seizures are randomised by selecting parameter ranges within the limits defined in [4]. Each parameter was assigned according to several user defined beta– distributions. This artifact free seizure simulator can be combined with a background EEG generator to provide a complete newborn EEG simulator.
SEIZURE LENGTH
SELECT SIGNAL PARAMETERS
BETA(a,b)
GENERATE IF LAW
SAWTOOTH
GENERATE TIME−FREQUENCY IMAGE
MODIFY COMPONENT AMPLITUDES
SMOOTH IMAGE
HAMMING
SYNTHESISE SIGNAL
MODIFIED STFT MAGNITUDE
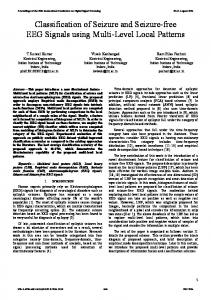
seizure(t) Figure 1. Block diagram of seizure simulation.
Table 1. Parameter ranges and distribution parameter LFM slope (Hz/sec) LFM number LFM envelope amplitude SNR (dB) SBR (db) seizure start frequency (Hz)
range -0.07:0.07 1:4 -0.25:0.25 3:20 10:20 0.5:3.5
distribution Beta(2,4) Beta(3,3) Beta(1,1) Beta(1,1) Beta(1,1) Beta(2,4)
2. Seizure Simulation eters according to, The seizure simulation protocol is outlined is Figure 1. Initially, the desired seizure length is determined. The parameters for the seizure are chosen from their specific sampling distribution. These parameters include the number of LFMs in the IF law, the slope of the LFMs, the seizure start frequency, the envelope of each harmonic component (relative amplitude and frequency), the signal to noise ratio (SNR) and seizure to background ratio (SBR). The parameter range and parameter sampling distribution are specified in Table 1. Note, the beta distribution ranges from 0 to 1 so the range is used to correctly scale the sampling distribution. The initial IF law is generated from the selected param-
f (t) =
N X
a i ti + c i ,
(1)
i=1
where, 0 t ti = 0
for t < tilo , for tilo ≤ t ≤ tihi , for t > tihi ,
(2)
where fi (t) is the IF law, ai is the slope of the ith LFM monocomponent, ci is a constant to correctly align the pieces of the IF law, N is the number pieces in the piecewise LFM and tilo and tihi are random variables with tihi conditioned on tilo such that tihi > tilo .
The time–frequency image is initially constructed, using the IF law, with the harmonic relationship of a sawtooth waveform (1 at fundamental, 1/2 at first harmonic √ and 1/ 8 at second harmonic, etc). The magnitude of each harmonic component is multiplied by a specific, oscillating, random amplitude envelope that is estimated using cubic spline interpolation (fenvelope(t)