Non-parametric Vertical Box Algorithm for Detecting Amplitude Information in the Received Digital Signal EDICS SSP-CLAS M.B.Beljaeva
Abstract—Vertical boxes algorithm (VBA) for non-cooperative discrimination between digital signals with amplitude information (AI) from those without AI is presented. The problem is not new and several solutions have been proposed. Unlike them VBA needs no information about propagation conditions and the received signal parameters. No SNR and noise distribution assumptions are made, no carrier frequency and no thresholds are required. The only assumption made is the symbol rate interval which may be as wide as desired. The signal is considered only in the time domain. No envelope, no Hilbert or Fourier transforms are used. Simulation proves VBA efficiency. Index Terms—modulation recognition, vertical box control chart.
I.
INTRODUCTION
The less we know the more difficult is to develop a well-founded decision. While studying some problem under high level of uncertainty one hardly can resist the temptation to introduce certain unfounded assumptions that allow using well-known methods. That‟s why there are far less methods for blind modulation recognition (MR) than for MR problems with some a priori information about the received signal (other than sequence of samples). MR algorithms often have binary tree structure [1]-[6]. At each node decision is made whether the received signal belongs to certain class or not. Does the signal contain amplitude information (AI) or does it not is usually among these alternatives. Hereafter AI modulation set ____________________________________________________________________________ Manuscript received October 2, 2012. M. B. Beljaeva is with the Scientific Centre of Applied Electrodynamics, Saint Petersburg, Russian Federation; e-mail:
[email protected]).
will mean all kinds of AM and QAM while nonAI one will mean frequency and phase modulations and non-modulated carrier. To distinguish between AI and nonAI modulation of the received signal in non-cooperative conditions several methods were proposed. Aisbett [7] and Chan & Gadboys [8] assumed noise to be Gaussian and exploited its characteristic properties. But ‘To begin, distributions are never normal’ [9]. In fact the shot effect showed by Rice [10] to be the source of Gaussian noise is not the only reason of signal corruption. The received radio signal has passed through the medium which properties are varying in time and space and cannot be controlled completely. Nobody can foreknow the proper noise distribution kind and the only reason for using the Gаussian one is that „Everyone believes in the normal law, the experimenters because they imagine that it is a mathematical theorem, and the mathematicians because they think it is an experimental fact‟ [11]. In order to decide is there AI in the received signal or not Ketterer [12] compares the variance of envelope with threshold. This method requires knowledge of SNR which is not available in real non-cooperative situation. Azzouz & Nandi [1] calculate statistical characteristic (extracted feature) max of the received signal and compare it with the threshold t( max ) which value is determined by means of simulation. But simulation requires information, in particular information about corresponding random variable distributions, and again Gaussian assumption is made. So t( max ) may become useless if the noise has some other distribution. Another matter is that the signal envelope spectrum is used to calculate max . This approach is viable only if symbol rate rs is big enough so that few symbols would be located in the time interval TFFT
N0 (here N 0 is Fourier transform number of points and f s is sampling rate). fs
Indeed, the example in [1] has f s 1200kHz , N 0 =2048, rs 12.5kHz so that about 21 symbols come during N 0 samples. But if rs 500 Hz then AI modulation would not be recognized, since symbol duration would exceed TFFT . In more recent papers [13, 14] several time domain extracted features intended to solve AI/nonAI problem were proposed, however without any
decision rules with them. In [15] peak number of the amplitude component derived from the DoE (Difference of Estimator filter) is used as extracted feature but, as before, the threshold is calculated under the noise normality assumption. In this paper we propose a new Vertical boxes algorithm (VBA) for distinguishing between AI and nonAI modulation in the received digital signal in case when available information uncertainty is maximal i.e. the only data used is the sequence of corrupted real samples x( t i ) . The only assumption made is about the symbol frequency interval which can be chosen as wide as desired. No SNR or noise distribution assumptions are required, no carrier frequency estimation is done. Fig.1. High and low periods of AM2 signal, SNR=20dB.
The rest of the paper is organized as follows. Section II presents VBA, in Section III we discuss its holes and shortcomings, and describe necessary improvements.
II. VBA
A.
Algorithm Description To detect, without going to frequency domain, whether the received signal is modulated in
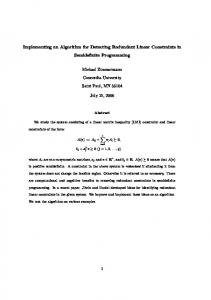
any way one needs to find out whether signal oscillogram fluctuations cannot be explained only by noise. AI oscillogram consists of periods of different height. For example there are low and high periods in AM2 signal depending on the symbol transmitted (fig.1).
Fig.1. High and low periods of AM2 signal, SNR=20dB.
The less is SNR the more difficult it is to detect the presence of two kinds of periods especially because we do not know the moments when symbols change. Thus the AM2 recognition problem reminds the change-point one of identifying stochastic process changes at
unknown times [16]. In our recognition algorithm we use the idea of Vertical Box Control Chart [17], that is, controlling the number of random process observations which fall into the box moving along the time axis. In-control state remains until this number jumps i.e. changes for more than a certain threshold, then the out-of-control state is diagnosed. In our approach we replace one moving box by many stationary ones and use non-parametric statistical test instead of comparing with threshold. Another statistical test is used to process results. Vertical box (V-box) is a rectangle with one side on horizontal axis. Let
[ f smb min , f smb max ] be the interval of possible symbol frequency, f s the sample frequency, and
t box 1
f smb max
.
(2.1)
Consider the received signal waveform x( t ) over interval ( 0 ,T ) , where T Kt box , K is some integer, the choice of which will be discussed below. Now sample size is N [ Tf s ] , and time sample moments are t i a.
i , i 1,..., N . VBA consists of six steps: fs
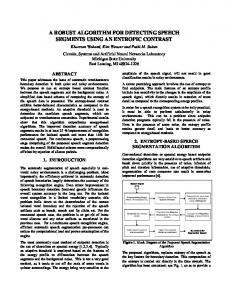
Center the signal and flip it positive (fig.2a).
Let
s( t i ) x( t i )
1 N x( t j ) . N j 1
Now average values in boxes of different heights are different. Centering is necessary because noise distribution may be asymmetrical. b.
Build a sequence of V-boxes over s(t) (fig.2b). Let smax max s( ti ) . Draw K i 1,...,N
vertical boxes with height s max based on subintervals of length t box . Divide each V-box in two halves by a horizontal line.
c.
Split all V-boxes into low and high classes according to how many samples fall
under the middle line (fig.2c). Let vi be the number of samples in the ith V-box below the middle line:
vi
j :( i 1 )tbox j i tbox
j
s max 1 if s( j ) j 2 . 0 else
where
Let mv
(2.2)
1 K vi . We call the ith V-box low if v( i ) mv and high otherwise. Now we K i 1
have a sequence of low and high boxes. Neighboring boxes may belong either to different or to the same classes. d.
Transform the sequence of boxes into the sequence of coffers of alternating
classes (fig.2d). Join every subsequence of the same class boxes into one coffer assigning the same class to it. That gives us a sequence of coffers of varying length with alternating classes. By M denote number of coffers. e.
Make coffer borders more precise i.e. more close to symbol borders. Join each
a a m 2 coffer C m a m , a m1 with its right neighbor‟s left half C a m1 , m1 and 2 compare
the
union‟s
mean
with
m th
coffer‟s
mean:
if
1 1 s( t j ) where L( C ) is number of samples into C, then s( t j ) L( Cm ) j :t j Cm L( C ) j :t j Cm C the m th coffer‟s right border is left in place, otherwise it is shifted to
a m1 a m 2 . Do the 2
same thing with the left borders. Now coffers are close to symbols if there is AM (fig.2e) and entirely random otherwise. In the first case sample distributions in neighboring coffers differ, in the second they do not. Note that some symbol may be missed (as the 9th one in fig.2e) if SNR is low.
f.
Compare sample distributions inside neighboring coffers content by statistical
M test. We split all M coffers into successive non-overlapping pairs, each of them 2
consisting of two coffers of different classes. Then we use the well-known Mann–Whitney-–Wilcoxon (MWW) non-parametrical test [18] with significance level U, implemented by the MATLAB function ranksum, to test sample
distribution sameness within each pair. test results form vector R R1 , R2 ,...R of random independent components where Rk 0 (“failure”) if distributions in k th pair are different or Rk 1 (“success”) otherwise. Let 1 be number of units in R . Obviously we decide “AI” if
1 and “nonAI” if 1 0 . But simulations show that such certain results usually occur when SNR is high enough (more than 10-15dB). Otherwise R usually becomes a mixed array of zeroes and ones.
Fig.2. (a)-(e) steps of VBA. SNR=3dB.
For example in fig.2 R 111 0 , which means that distributions in the 1st & 2nd coffers are not equal ( R1 1 ), and the same goes for 3rd & 4th and 5th & 6th distributions
( R2 R3 1 ). Distributions in 7th & 8th coffers passed MWW test successfully and could therefore be equal. The 9th coffer has no pair and is not taken into consideration. g.
Use another statistical test to analyze the results of step “f”. The conditional
probability PRi 1 | nonAI is less than U by the construction of R. We check the hypothesis that the success probability p s is also less than U, using a test involving a single binomial probability [19] which is implemented by the MATLAB function finv. If the hypothesis is confirmed on significance level U our algorithm says “nonAI”, otherwise it says “AI”. Simulations show that in the absence of noise VBA recognizes AM2 signals with confidence when symbol length is no less than tbox .
B.
The choice of K.
Simulations show that for SNR 5dB VBA gives good results if M is near 10. Obviously M is strongly related to symbol variation number (SVN). When noise is absent these numbers
are equal or differ by 1. The more is noise the more they differ. The distribution of SVN is binomial, and according to [18] (table D) K 0 =30 symbols are needed to obtain 10 symbol variations with probability 0.95 assuming that symbol probabilities are equal. So K K 0 is recommended in a special case when symbol length is equal to t box (2.1). Now suppose symbol length equals L t box ,. where L 1 . Again K 0 symbols are needed therefore K should be equal to K 0 L. Now if symbol length varies from 1 f smb max to
1 f smb min we would need f L smb max f smb min
(2.3)
to recognize AM2. Thus the total sample number is
ˆ N VBA K 0 L t box f s .
(2.4)
Note that the 1st factor is the number of V-boxes, while the 2nd one is the number of samples per V-box. Using (2.1, 2.2), we get
fs Nˆ VBA K 0 . f smb min
III. VBA DISCUSSION AND IMPROVEMENTS
A.
VBA Holes and Shortcomings.
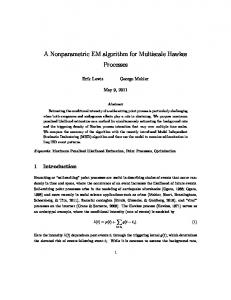
First hole is the use of MWW test, which requires sample groups to be independent. That doesn‟t seem to be the case for coffers contents. At least numbers of class boxes are correlated. For example, if the i th box is high and the j th one is low, then i j (2.2) are order statistics ( i has the smaller index than j ). Since the latter are correlated, so are the sample arrays within V-boxes, and, therefore, coffers‟ contents. But correlation is weak and medians of sample distributions within low and high coffers differ much more in AI case than in nonAI, which is why MWW test distinguishes between them (see Section IV). Second hole is the interpretation of MWW test results. Strictly speaking sample distributions in different class boxes are not the same even in nonAI case. The means of these distributions are different, again due to the way classes are chosen. But the difference is rather small and the test usually doesn‟t “feel” it when sample number within one V-box is not too large. First VBA shortcoming is that it‟s sensitive to signal aliasing. Signal without modulation
Fig.3. Non-modulated carrier looks like AI signal because of aliasing.
could be mistakenly determined to be amplitude modulated (fig.3). Second shortcoming is that VBA is computationally slow because of large number of proceeded samples. For example let
f smb min 100Hz , f smb max 3KHz , f s 20 MHz .
6 ˆ According to (2.4) N VBA 6 10 ; there are about 900 V-boxes with more than 6500 samples
per box. Both shortcomings can be removed by the same trick namely the randomization of sample times (see below). The number of samples is lowered even more by using V-boxes of different lengths.
B. Improving VBA
1) Decreasing the Number of Samples per V-box
fs To determine the box‟s class it‟s enough to take much less samples than if f smb min they are taken in uniformly distributed moments. Let us take D pseudorandom numbers
j , j 1,..., D , uniformly distributed in (0,1), and sample the signal at the moments t D( i 1 ) j ( i 1 j )t box . Thus there would be D samples within each V-box. Note that the same array i is used for all V-boxes. Therefore the total sample size decreases significally from Nˆ VBA to NVBA KD . What‟s more, this approach removes the first shortcoming too due to nonregularity of time sampling. Randomization also helps to diminish the second hole i.e. to reduce the tendency of the MWW test to give the false positive result i.e. to detect AI when there is none. Create another sequence of D samples exactly the same way as the first one (using another array of pseudorandom numbers). This second sequence would then be used as input for the MWW test. If there is no AI in the received signal then the only difference between low and high coffers would come from the noise, hence it will be neutralized while comparing samples taken in
another array moments within coffers. Otherwise, if there is AI in the signal, changing the sample moments array will not decrease the difference greatly. Now there are D D samples per V-box. Simulations show that D D 200 is a good choice.
2) Decreasing V-box number
to Let us divide the symbol length interval tsmb min , tsmb max 1 ,1 f smb min f smb max
m subintervals and denote points of division by 1 ,..., m1 , 0 t smb min , m t smb max . Then we use VBA with t box i in order to recognize AM in the received signal with the symbol length belonging to i , i 1 . Now the total number of different length V-boxes is K 0 I m, 0 ,..., m , where m1 I m, 0 ,..., m i 1 . i 0 i
(3.1)
Theorem. Let ln L, 1 L ( 1 ) 1 m* if 1 1 otherwise
(3.2)
m L. Then
i m min I m, 0 ,..., m = I m , 0 i 0 m m ,t1 ,...,tm 1
Proof
(3.3)
Note that we can only vary 1 ,..., m1 since 0 and m are fixed. Assume that m 2 .
According to (3.1) I 2 , 0 , 1 , 2 1 2 . It has a minimum when 1 0 2 . It follows 0
1
that for any m 2 , I m, 0 ,..., m would be minimal when the points of division satisfy simultaneous equations i i 1 i 1 , i 1,...m 1 . Therefore
i 0
i Lm ,i
1,...m 1 .
(3.4)
Substituting (3.4) to (3.1), we obtain 1
I m, 0 ,..., m mL m .
(3.5)
Function f ( x ) x x L has a unique minimum at x ln L . Since m takes only integer values then, in order to minimize I, it must be equal to if f ( ) f ( 1 ) and to 1 otherwise. Now the total number of V-boxes is K 0 m and the total sample number is equal to
NVBA K 0 m* ( D1 D2 )
(3.6)
instead of (2.4). Note that (3.6) does not include sampling rate because of sample time randomization. Under the conditions of section 3A example m* 3 , 3.1 . If K 0 30 ,
D1 D2 200 then about 280 V-boxes and 112000 samples are needed. So in this example the improved VBA reduces the required samples number in more than 50 times. It‟s possible to use parallel computations to speed up signal processing. There are m* subsequences of K 0 V-boxes in each one. The length of V-boxes in ith subsequence is t i 1 t 0 i 1 , i 1,...m . If all subsequences start to be proceeded simultaneously then the
length of the required signal piece T is equal to the length of the longest subsequence i.e
K 0 t 0 m1 . Under the conditions of section 3A example T 30t 2 0.1 s. Keep in mind that
such a long time is the charge for symbol rate uncertainty. If, hypotheticaly, the symbol rate is known (as in [1]) then the signal duration about
K0 0.0024 s would be enough. It is about the rs
same as required by the algorithm described in [1]: the latter needs
2048 0.0017 s but cannot fs
recognize AI when the symbol rate interval is as wide as in our example. While proceeding m subsequences we obtain m results: r1 , r2 ,..., r , where ri 1 if m AI is recognized for symbol length belonging to ( t i1 , t i ) , ri 0 otherwise. The final decision m
is made as following: if m* 2 & 1 or m* 2 & 2 where ri 1 then signal i 1
contains AI, otherwise it does not. Since VBA is built around the recognition of different height oscillogram periods it can detect the presence of AI not only in AM2 signals but also in other AI modulated signals. Naturally the detection probability depends on the difference between average heights of high and low periods.
IV. SIMULATION
Simulation was performed under the conditions of section 3A example. Received signal was simulated as follows. Sequence of equiprobable and independent zeros and ones modulated the carrier, the result was corrupted by additive noise. 100 realizations were generated for every variant.
A.
Modulation Types and Noise.
VBA was tested on 10 types of modulation: AM2, 4-level PAM, PSK2, PSK4, FSK2, FSK4, three kinds of QAM8 shown at fig.4 (a)-(c), QAM16 (fig.4.(d)), and non-modulated carrier.
Fig.4. Simulated kinds of QAM.
Two kinds of noise distributions (Gaussian and a mixture of uniform and Rayleigh distributions) and three SNR levels (10, 5, and 0 dB) were simulated.
B.
Algorithm Parameters.
D D 200 , K 0 30 , U U 0.05 .
C.
Signal parameters.
A=1; carrier=7.5 MHz, modulation index 0.6 for AM2; modulation indices 0.2, 0.4, 0.6 for PAM. Symbol frequency was generated uniformly on interval (100Hz, 3KHz) for each realization. Amplitude and carrier frequency do not influence the results thus their values were chosen arbitrarily.
D.
Simulation Results.
The numerator in each cell of Table 1 is the probability for Gaussian noise while the denominator is the same for mixture noise.
Table 1. Probability of correct decision «AI vs. nonAI». K K0 93 .
10dB 5dB 0dB
carrier 0.97 0.97 0.98 0.96 0.98 0.97
AM2 1.0 1.0 0.99 1.0 0.94 0.92
PAM4 0.98 1.0 0.99 0.97 0.34 0.23
PM2 0.97 0.94 0.95 0.99 0.98 0.97
PM4 0.96 0.98 0.98 0.97 0.96 0.98
FM2 0.97 0.99 0.97 0.98 0.97 0.97
FM4 QAM8(1, 2, 3) 0.99 1.0 , 0.99 , 1.0 0.98 1.0 1.0 1.0 0.98 0.99 , 1.0 , 1.0 0.95 1.0 1.0 1.0 0.99 1.0 , 0.75, 1.0 0.98 0.98 0.67 0.97
QAM16 0.99 0.98 0.99 1.0 0.76 0.68
It‟s clear that VBA confidently detects AI in all considered signals when SNR 5dB . As SNR decreases the correct decision probability decreases as well. Its rate of decrease is greater if the average difference between low and high periods in the signal is smaller. That‟s why AI in PAM4, QAM8(2), QAM16 is recognized with much less confidence than in the other modulation types when SNR=0 (see the last line in Table 1).
V. CONCLUSION
The idea of VBA is clear enough: the algorithm “sees” AI as a man does. In fact method [1] does the same in frequency domain, the difference is that man looks at spectrum, not at oscillogram. However in time domain it is possible to use non-parametrical statistical tests while at the moment there are no such tests for frequency domain and one has to choose thresholds to distinguish between AI and nonAI. This approach inevitably limits the assortment of considered modulation kinds and types of noise while VBA realizes more general approach. For practical use VBA‟s merit is that it needs no information not available in reality. The algorithm is simple and rough enough, and that is quite normal: problems with high degree of uncertainty need rough solutions
REFERENCES 1.
E. E. Azzouz and A. K. Nandi, Automatic Modulation Recognition of Communication Signals.
Boston, Mass, USA: Kluwer Academic Publishers, 1996. 2.
D. Boudreau, C. Dubuc, F. Patenaude, M. Dufour, J. Lodge, and R. Inkol, “A fast automatic
modulation recognition algorithm and its implementation in a spectrum monitoring application,” in Proc. of IEEE MILCOM 2000, pp. 732-736. 3.
L. De Vito, S. Rapuano, and M. Villanacci, “An improved method for the automatic digital
modulation classification,” in Proc. of IEEE IMTC 2008, pp. 1441-1446. 4.
N. Björsell, P. Daponte, L. De Vito, and S. Rapuano, “Automatic signal recognition for a flexible
spectrum managment”, in Proc.of IEEE IMEKO, 2009, pp. 568-573. 5.
L Anton and I. Vizitiu, “Some aspects of signal recognition,” in Proc. of Distance Learning,
Simulation and Communication International Conference, 2011, Brno, Czech Republic, pp .9-15. 6.
Y. Xu L. Ge, and B. Wang, “Digital modulation recognition method based on tree-structured
neural networks,” in Proc of Int. Conf. on Communication Software and Networks (ICCSN’09), 2009, pp. 708 – 712 7.
J. Aisbett, “Automatic modulation recognition using time-domain parameters, “Signal
Processing, vol. 13, No. 3, Oct. 1987, pp. 323-329. 8.
Y. T. Chan, and L. G Gadbois, “Identification of the modulation type of a signal,” Signal
Processing, vol. 16, No. 2, Feb. 1989, pp. 149-154 9.
R. Wilcox, Introduction to Robust Estimation and Hypothesis Testing, 2nd ed. San Diego, CA:
Elsevier Academic Press, 2005, p. 2. 10. S. O. Rice, “Mathematical analysis of random noise,” Bell Systems Technical Journal, vol. 23, 1944, pp. 282–332. 11. G. Lippmann, “Conversation with Henri Poincaré”. In Henri Poincaré, Calcul des Probabilités (1896), p. 171. 12. H. Ketterer, F. Jondrall, A. H. Costa, “Classification of modulation modes using time-frequency methods,” in Proc. of IEEE ICASSP 1999, vol.5, 1999, pp. 2471-2474.
13. Y. Jin, S. Li, Z. Yang, and Y. Wang, “Study of a novel key feature in non-cooperative modulation automatic recognition,” in Proc. of Int. Conf. on Wireless Communications, Networking and Mobile Computing (WiCom 2007), 2007, pp. 1240-1243. 14. J. Bagga and N. Tripathi, “Analysis of digitally modulated signals using instantaneous and stochastic features, for classification”, International Journal of Soft Computing and Engineering (IJSCE), vol.1, no. 2, May, 2011, pp. 57-61. 15. M. Kang, C. Lee, and J. Joo, “Automatic recognition of analog and digital modulation signals using DoE filter”, in Proc. of International Symposium on Communications and Information Technologies (ISCIT 2009), 2009, Incheon, Korea, pp. 609-614. 16. U. Jensen and C. LÄutkebohmert, “Change-Point Models,” in Encyclopedia of Statistics in Quality and Reliability, vol. 1, F.Ruggeri, R. Kenett, and W. Faltin, Ed., New York: Wiley, 2007, pp. 306-312. 17. E. Rafajlowicz, M. Pawlak, A. Steland, “Nonparametric sequential change-point detection by a vertically trimmed box method,” IEEE T Inf Th, vol 56, no 7, Jul. 2010, pp 3621-3634. 18. S. Siegel and J. Castellan. Nonparametric Statistics for the Behavioral Sciences, New York: McGraw-Hill Book Company, 1988, pp. 128-137. 19. J. H. Pollard, Handbook of Numerical and Statistical Techniques, Cambridge: Cambridge University Press, 1977, pp. 144-145.