An Experimental Algorithm for Detecting Damage Applied to the I-40 Bridge. Over the Rio ... At the end of the summer in 1993, New Mexico State University directed a series ... Damage was induced with a cutting torch just west of center on the ...
An Experimental Algorithm for Detecting Damage Applied to the I-40 Bridge Over the Rio Grande
Randall L. Mayes Sandia National Laboratories Experimental Structural Dynamics Department Albuquerque, New Mexico, USA
Modal frequency Frequency Critical damping ratio Damage indicator
ABSTRACT An algorithm originally used to locate errors in finite element models is applied to a full scale bridge damage detection expuiment. The method requires experimental frequency response function data measured at discrete locations along the major bridge load paths. In the bridge damage application the algorithm is most effective when applied to static flexibility shapes estimated with a truncated set of six mode shapes rather than individual mode shapes. The algorithm compares “before damage” and “aftcr damage” data to locate physical areas where significant stiffness changes have occurred. A damage indicator shows whether damage is detectable. Damage is correctly located in the two most significant damage cases using the driving point static tlenibility estimates. Limitations of the technique are addressed. The damage detection experiment was performed on a three span steel girder bridge that was 425 feet long. This bridge was part of lnterstatc 40 across the Rio Grande. The New Mexico State University Department of Civil Engineering organized the experiment. The frequency response functions were collected by Los Alamos National Laboratories personnel. The bridge excitation was provided by Sandia National Laboratories. NOMENCLATURE FRF ; SR M z E
I 0 1 YJir m,
Frequency response function Displacement scalar Force scalar STRECH ratio Moment Coordinate in direction of beam axis Young’s modulus Area moment of inertia of a beam Rotation displacement Beam span length between to sensors Mode shape at point i for rth mode Modal mass of rth mode
This work was performed at Sandia National Laboratories and supported by the U.S. Department of Energy under contract DEAC04-94AL85000.
INTRODUCTION At the end of the summer in 1993, New Mexico State University directed a series of experiments on a full scale bridge designed to provide a data base for bridge health monitoring algorithms. Sandia National Laboratories participated with Los Alamos National Laboratories in the acquisition of dynamic measuements on the bridge. Sandia furnished and operated a shaker to provide both sinusoidal and random force inputs to the bridge while Los Alamos acquired the dynamic measurements The modal test was originally designed for use in updating a finite element model of the bridge. However, subsequent to the testing, Sandia obtained the frequency response functions (FRFs) from Los Alamos to attempt to apply some damage detection algorithms to the data. These algorithms were based on a system identification algotithm originally applied in comparing modal test data to a finite element model to physically locate differences between the experimentally derived and analytically derived modal models[l]. This work was performed using funding from a laboratory directed research and development project in health monitoring at Sandia National Laboratories. Many techniques using modal quantities have been used to attempt to locate damage, assuming that it is basically manifested as a local change in stiffness from the original structure. Frequency comparisons, global mode shape comparisons, and damping comparisons have often been disappointing in determining and locating damage[5]. It is this author’s contention that global shape comparisons or even point to point comparisons are not the correct quantities to evaluate. If there is a change in stiffness, then there should be a change in displacement difference K~DSS that stiffness due to some forcing function. Damage detection techniques that assume a change in stiffness should consider displacement gradient type quantities. This approach is applied in this work.
219
\1 T
DESCRIPTION OF EXPERIMENT Two papers in this conference [2],[3] describe the experiments in detail. A description for the purposes of this paper will now be given. Figure I shows a schematic view of the three span bridge that was tested It was about 425 feet long and was one of three bridges that carried east-bound traffic across the Rio Grade in Albuquerque, New Mexico. The bridge was replaced by a new bridge immediately after the testing, which provided the opportunity to induce significant damage as well as test without traffic on the bridge. Two main steel plate girders (running the entire length) support the bridge, one on either side. This bridge is a fracture critical bridge, meaning that if one of the main plate girders was to fail, there is no redundant support to prevent catastrophic failure. Twenty-six vertical accelerometers were mounted near the neutral axis of the plate girders, 13 along each girder. They were evenly distributed along the length of each s p a n . Damage was induced with a cutting torch just west of center on the north plate girder. There was a series of five tests performed. The first test was performed on the as-used condition. The other tests were performed after each of four progressively severe vertical cuts were induced in the plate girder. The I shaped cross section of the girder is shown in Figure 2. The first cut was in the web centered about the neutral axis, and was two feet long The second cut extended down to, but not into, the bottom flange. The third cut was halfway through the bottom flange. The final cut severed the bottom flange. Modal tests were performed at each stage using a random force input from the Sandia shaker mounted on the south side of the bridge in the center of the east span as shown in Figure I. Los Alamos collected data from all sensors simultaneously. New Mexico State University directed the dynamic testing and performed all the static testing as well (not discussed in this paper).
I
I
A
l-1/4”
lo’-0”
3/8” 3 f
V -
2
1
°
F
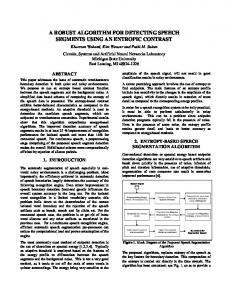
Figure 2 -Cross Section of the Steel Plate Girder (Not to Scale) STRECH CONCEPT As stated in the introduction, an algorithm for error localization in a finite element model was published in sn earlier lMAC[l]. The algorithm has been named with an acronym, &uctural Translation and Rotation Error mecking or STRECH. STRECH is basically a static concept that has been applied successfully to locate soft or stiff areas of a finite element model by comparing the lowest cantilevered mode shapes from a modal test with rhc finite element model. A description of the algorithm will bc given here utilizing static displacements from a two degree of freedom system as shown in Figure 3. The top figure would represent displacements in a “healthy” structure. The bottom figure would represent the displacements after spring 23 was damaged, that is. reduced in stifliiess. For the purpose of this example, assume there is no damage to spring 12. kl2
k23
Figure I Schematic of Three Span Bridge
kl2d
k23d
Figure 3 Demonstration of the STRECH Concept The simple static force displacement relations from the undamaged case are
220
NORMALIZATION
(1) where*,2 is displacement x2-x1 andfis the applied force. For the damaged case (superscript d)
(2)
AND
DENOMINATOR
FILTER
The realities of acquiring and fitting experimental data from a structure can cause some problems in the interpretation of the results of the STRECH ratios. One problem can occur if experimental data is accidentally taken with an incorrect global scale factor applied. To eliminate some of the confusion that might be caused by such a problem, a normalization has been applied. The STRECH ratio between two sensors are calculated
By equating the right hand sides of (I) and (2)
(3) which can be rearranged as
(4)
Similarly, a relationship for spring 12 can be written
X12
k;:
(5)
Theoretically, it would be easy to tell if there were damage to the springs and the extent of damage by applying a known force to both systems and measuring the displacements. In this case equation 4 would show that spring 23 had been damaged. This is the basic concept behind STRECH. The displacements can obviously be rotations and the forces in each element can be moments (which is how the relations will be used for the applications in this paper to the l-40 bridge). The displacement quotients given in equations (4) and (5) are known as the STRECH ratios, In general, additional degrees of freedom, constraints and load paths (i.e. parallel springs) may be included in real physical systems so that extent of damage to an individual spring may not be calculated, but the general trend of being able to detect damage and locate relative soft or stiff areas across the structure has been viable. Although this concept is a static one, success has been realized by applying this to the first cantilevered mode shape when the mode shape looks a great deal like the static displacement shape. This has been utilized on a cantilevered robot arm, a cantilevered missile payload and a cantilevered third stage of a missile with payload. In each cast significant stiffness differences between a finite element model and a modal test mode shape were identified, enabling the analyst to identify critical parameters to update in the finite element model.
The superscript d indicates data from the potentially damaged state. Data with no superscript is the baseline data which is considered undamaged. The summations are for all displacement differences defined along the load paths by the engineer. This basically defines the displacement difference xv as a fraction of the sum of all displacement differences measured for the structure’s specific state. Although the average SR is not always exactly equal to one, it is generally very near one. This makes the interpretation of the data much easier, as a value much greater than one will indicate an area of the structure that has been significantly reduced in stiffness (i.e. damaged). The highest SR should correspond to the part of the structure most likely to be damaged. In practice, x is usually a displacement difference between two points on the structure. each of which has three coordinates. The algorithm calculates the square root of the sum of the squares of the three coordinate displacement differences, so that all x quantities shown in equation 6 are positive values. In this application, only vertical accelerations were measured, so the accelerations in the other two coordinate directions were considered zero. From equation 6 it can be seen that if xi is very small, the SR can become very uncertain. Since all experimental data has noise associated with it, and data fitting algorithms are not perfect either, a false SR that is very large (because of a small denominator corrupted significantly by noise) may be calculated. A small value of xi in the denominator means that the structure is not being exercised between points i and j in the baseline structure. If this is the case, the true response should be insensitive to damage between those two points. Therefore, the engineer establishes a minimum denominator value for xv below which the SR is not calculated at all. In the algorithm, the minimum denominator value is set as a percentage of the largest displacement difference for the baseline structure. APPLICATION TO THE l-40 BRIDGE In this paper, the application is health monitoring with experimental data only. Processed experimental data for the I-40 bridge in its as used condition was the baseline data information (undamaged). Processed experimental data from four different
221
damage cases were the comparison data which were examined for evidence of softening between the sensor locations.
be obtained from the modal parameters by use of the following well known formula for the frequency response function based on real modes.
USE OF ROTATIONS The SRs were calculated based on differences in rotation. The tield measurements were accelerations in the vertical direction. Estimates of the rotations were obtained from displacement shape data by passing a parabola through three adjacent displacements on one of the plate girders. The slope of the parabola at the middle point was utilized as the estimate for the rotation of that point. The use of the rotation is justified based on force displacement relations of a beam
az
where x(w) is displacement as a function of frequency, f(o) is an applied point force as a function of frequency, ‘Pi’ is the mode shape at the response point for the rtb mode, ‘Vkr is the mode shape at the driving point for the nh mode, m, is the modal mass,