2012 IEEE INTERNATIONAL WORKSHOP ON MACHINE LEARNING FOR SIGNAL PROCESSING, SEPT. 23–26, 2012, SANTANDER, SPAIN
NONLINEAR DATA DESCRIPTION WITH PRINCIPAL POLYNOMIAL ANALYSIS V. Laparra, D. Tuia† , S. Jim´enez, G. Camps-Valls and J. Malo †
Image Processing Laboratory (IPL), Universitat de Val`encia, Spain Laboratory of Geographic Information Systems, Lausanne EPFL, Switzerland
[email protected], http://isp.uv.es ABSTRACT
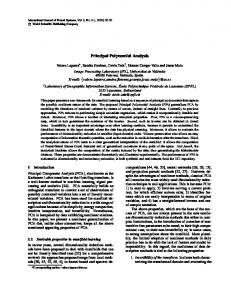
Principal Component Analysis (PCA) has been widely used for manifold description and dimensionality reduction. Performance of PCA is however hampered when data exhibits nonlinear feature relations. In this work, we propose a new framework for manifold learning based on the use of a sequence of Principal Polynomials that capture the eventually nonlinear nature of the data. The proposed Principal Polynomial Analysis (PPA) is shown to generalize PCA. Unlike recently proposed nonlinear methods (e.g. spectral/kernel methods and projection pursuit techniques, neural networks), PPA features are easily interpretable and the method leads to a fully invertible transform, which is a desirable property to evaluate performance in dimensionality reduction. Successful performance of the proposed PPA is illustrated in dimensionality reduction, in compact representation of non-Gaussian image textures, and multispectral image classification. Index Terms— Principal Polynomial Analysis, Manifold Learning, Dimensionality Reduction, Classification, Coding. 1. INTRODUCTION Principal Component Analysis (PCA) can be considered an optimal method for dimensionality reduction in mean square error (MSE) sense only if the conditional mean in each PCA component is constant along the considered dimension. We will refer to this as the conditional mean independence assumption. Figure 1 illustrates this situation. Unfortunately, this symmetry requirement does not apply in general, as many datasets live in non-Gaussian and/or curved manifolds. For those data manifolds lacking the required symmetry, nonlinear modifications of PCA would be more appropriate: the residual nonlinear dependence after PCA should be removed. In recent years, a wide number of nonlinear dimensionality reduction methods has been presented (see [1] for a comprehensive review). Despite the advantages of nonlinear Funded by the Spanish CICYT under the projects TEC2009-13696 and CSD2007-18 and by the Swiss NSF under the grant PBLAP2-127713.
c 978-1-4673-1026-0/12/$31.00 2012 IEEE
methods, such as local [2, 3], spectral [4, 5] and projection pursuit methods [6, 7], classical PCA is still the most used dimensionality reduction technique in real applications. The main reasons for this are that PCA is easily applicable, directly interpretable, and its performance can be simply evaluated. The above properties, which explain the success of PCA, are not always present in the new dimensionality reduction algorithms due to their complex formulations or strong assumptions. Sophisticated methods lack feature interpretability and simple performance evaluation since these are intimately related to the invertibility of the learned transformation. For the interpretation of the results, inverting the solution back to the original domain is always a good option since one usually understands the input physical units, while analyzing the results in the transformed domain is more complicated. Regarding evaluation, invertible transforms allow simple assessment of the reconstruction errors, while indirect evaluation techniques are needed if the method is not invertible [8]. Here, we present an extension of PCA that (1) shares the above appealing properties of PCA, and (2) generalizes PCA by including the ability to obtain nonlinear features, thus overcoming some of its limitations. Extension of PCA by generalizing principal components from straight lines to curves is not new. Related work includes approaches based on (1) non-analytical principal curves [9– 12], (2) fitting analytic curves [13–15], and (3) implicit methods based on neural networks and autoencoders [16–18]. The proposed approach has the advantage of providing a computationally convenient alternative to the approaches based on Principal Curves and fitting analytical curves, while preserving the appealing property of making the nonlinear features explicit. This is also the main advantage over neural network approaches, whose extracted nonlinear features are not explicit in the formulation. Here, we define principal polynomials as a nonlinear generalization of principal components to overcome the conditional mean independence restriction of PCA, and to provide a computationally convenient alternative to the previous approaches. Principal polynomials deform the straight principal components by minimizing the regression error in the corresponding orthogonal subspaces. This way to put the problem
cipal component. In the (p + 1)-th step the same procedure is applied again on the (reduced dimensionality) data still to be described, i.e. the residuals. Given a d-dimensional centered random variable x0 ∈ Rd×1 , the p-th Principal Component is the direction represented by the unit norm vector, νp , given by, νp = arg max {E[(ν > xp−1 )2 ]}, ν
Fig. 1. The conditional mean independence restriction. White axes represent the principal directions identified by PCA in both datasets. PCA is a good solution in the left diagram since the dataset has the required symmetry: the conditional mean in ν2 (zero for centered data) is independent of ν1 . On the contrary, in the right diagram, the conditional mean in ν2 (white circles) is not constant along ν1 , so projecting onto ν1 along its orthogonal direction gives rise to large reconstruction errors. is convenient since it reduces to the straightforward computation of a pseudinverse. We propose to use a projection on a sequence of these polynomials to set a new nonlinear data representation: the Principal Polynomial Analysis (PPA). By removing the conditional mean independence restriction, the proposed PPA can be successfully applied to a wider set of probability density functions (PDFs) than linear PCA. Moreover, the analytical nature of PPA allows one to explicitly show that PPA generalizes PCA performance. The paper is organized as follows. Section 2 formalizes the direct and inverse PPA transforms, and analytically proves that PPA generalizes PCA and outperforms it in dimensionality reduction. In Section 3, we present results of dimensionality reduction performance on different databases: an illustrative synthetic 3D example, standard databases, a nonGaussian image texture reconstruction task and, finally, in a challenging multispectral image segmentation problem. Section 4 concludes the paper. 2. PRINCIPAL POLYNOMIAL ANALYSIS (PPA) This section introduces Principal Polynomial Analysis (PPA) and demonstrates that PPA generalizes PCA thus achieving better data representations. 2.1. Principal Component Analysis (PCA) PCA can be seen as a sequential algorithm that obtains an ordered series of directions maximizing the variance of the projected data. In the p-th step of the sequence, the data still to be analyzed are represented by two components: (a) the projection on the maximum variance direction, and (b) the remaining residual in the subspace orthogonal to the p-th prin-
(1)
where ν ∈ R(d−p+1)×1 is the set of possible unit norm vectors and xp−1 is the projected variable in the subspace orthogonal to νp−1 (the previous Principal Component). Let V⊥p be a matrix whose rows contain d − p orthonormal vectors, also orthogonal to νp . According to this, xp = V⊥p · xp−1 , is the series of data projected in the subspace orthogonal to the vectors νp (the residual still to be explained at p-th step). Since any vector xp−1 may be written as a linear combination of νp and the vectors in the projection matrix V⊥p , maximizing the variance of ν > xp−1 is equivalent to minimizing the energy in the subspace spanned by V⊥p , i.e., V⊥p = arg min {E[kV p · xp−1 k22 ]}, p V
(2)
where V p is the set of possible projection matrices fulfilling V p · V p> = I. In the p-th step, the data to be explained are approximated as: > x ˆPCA p−1 = (νp xp−1 )νp = αp νp
(3)
Therefore, the dimensionality reduction error is the expected = xp−1 − x ˆPCA value of the norm of the distortions εPCA p p−1 that live in the subspace orthogonal to νp : E[kεPCA k22 ] = E[kV⊥p · xp−1 k22 ] p
(4)
PCA is the optimal linear solution in MSE terms since (2) implies minimizing the dimensionality reduction error in (4). 2.2. Principal Polynomial Analysis (PPA) For centered data sets fulfilling the conditional mean independence requirement, the conditional mean at every point in the νp direction is zero, i.e., the p-th principal direction goes through the aligned means in the subspace spanned by V⊥p , giving rise to a small truncation error (Fig. 1, left). However, in general, the conditional mean mp = E[V⊥p · xp−1 |αp ] 6= 0 (see Fig. 1, right). In this case, it is better to project xp−1 onto a curve that goes through these conditional means mp . In order to do so, PPA modifies the PCA approximation in (3) by using the estimation of the conditional mean: > x ˆPPA ˆp p−1 = (νp xp−1 )νp + m
(5)
Therefore, the distortions due to the truncation are εPPA = p V⊥p · xp−1 − m ˆ p , and the truncation error is: E[kεPPA k22 ] = E[kV⊥p · xp−1 − m ˆ p k22 ] p
(6)
The basic idea in (5) is that once we have selected the principal component, the expected value on the other dimensions is corrected by an estimation of the mean m ˆ p . This estimation is made by using the projection of the data on the selected principal component. In our case, m ˆ p is estimated as a combination of functions of the projected data on the selected principal component, νp> xp−1 . Here, we use a polynomial of degree γ, i.e. ˆ p containing the m given n samples, matrix M ˆ p vectors is > ˆ p = βp Vnγ M ,
βp =
· xp−1 −
This section presents four experiments: (1) the analysis of an illustrative curved manifold; (2) dimensionality reduction of databases of different dimensionality; (3) reconstruction of non-Gaussian textures; (4) multispectral image classification. The proposed PPA has only one parameter to be tuned: we set the polynomial order γ = 3 in all examples to keep an intuitive regularized solution.
(7)
where Vnγ contains the n Vandermonde vectors of νp> xp−1 . The polynomial coefficients, βp , are estimated by canonical linear regression. Equivalently, the vector βp is the one that minimizes the prediction error, arg min{E[kV⊥p β
3. EXPERIMENTAL RESULTS
m ˆ p (β)k22 ]}.
(8)
2.2.1. PPA generalizes PCA Given the formulation above, PPA generalizes PCA due to the freedom introduced by m ˆ p (β). Basically, the principal components are replaced by eventually curved γ-order polynomials, thus removing the conditional mean independence restriction. Such flexibility implies that the truncation error in PPA, Eq. (6), is always lower or equal to the corresponding error in PCA, Eq. (4). The latter occurs in two particular cases: (1) in data fulfilling the conditional mean independence restriction, the actual conditional mean and hence the estimation m ˆ p will be zero, so Eq. (6) reduces to Eq. (4); and (2) when using first-order polynomials, the fitted curve at the p-th step coincides with the p-th principal component so the estimated means are all equal to zero. In both cases, PPA reduces to linear PCA. The order of the polynomial may lead to either oversmoothed or overfitted solutions. The impact of different orders in the solution will not be treated in this paper. 2.2.2. PPA is invertible PPA applies these two steps sequentially: (i) compute the first Principal Component of the data still to be explained, and (ii) deform that straight line by forcing that the corresponding polynomial goes through the conditional mean, by projecting in the orthogonal subspace and removing the conditional mean: αp
=
νp> xp−1
xp
=
V⊥p · xp−1 − m ˆ p (βp )
(9)
where p = 1, . . . , d − 1, and αd = xd−1 . The inverse consists of undoing the above equations, p = d − 1, . . . , 1: αp p> (10) xp−1 = νp V⊥ · xp + m ˆp
3.1. Experiment 1: toy 3-dimensional curved manifold Figure 2 illustrates the effect of using PPA and PCA on a synthetic dataset that does not follow the conditional mean independence assumption. The considered data set also includes two nonlinearly separable classes. Note that for different values of the first principal component, the conditional mean in the orthogonal subspace is not constant. Original
PCA
PPA
Fig. 2. Illustrative 3D synthetic binary example original data (left), and transformed data onto the PCA and PPA bases (middle and right). The dashed (solid) line in the input space corresponds to the first feature of PCA (PPA). Table 1 shows that, as expected, the reconstruction error is smaller in PPA than in PCA when reducing the dimensionality (error). Additionally, PPA gives rise to a more compact energy distribution among coefficients (variance), which is consistent with improved reconstruction errors. More interestingly, PPA leads to an unfolded data representation where coefficients are more independent than in the PCA domain. We measured the remaining redundancy by estimating the mutual information among all the features with the method proposed in [7]: while in PCA mutual information is 3.32 bits, in PPA is 0.17 bits. Finally, given the fact that few PPA components capture a bigger fraction of the variance, and that PPA unfolds the original clusters (cf. Figure 2), one may think that the new representation is suitable for simple classification strategies. The accuracy results obtained by Linear Discriminant Analysis (LDA) confirm this intuition: two PPA features are enough to outperform the best PCA result that uses all the features.
Table 1. Reconstruction error rate (with respect to the first principal component MSE), variance, and canonical LDA classification accuracy estimated with the Cohen’s κ statistic using different number of features extracted with PCA and PPA (in parenthesis). Features Error Variance κ
1 100 (30) 0.35 (0.35) 0 (0)
2 31.54 (12.31) 0.08 (0.02) 0.12 (0.99)
3 0.010 (0.005) 0 (0.99)
3.2. Experiment 2: dimensionality reduction Here we compare PCA and PPA in terms of the reconstruction error after truncation to a number of n ≤ d features for three standard databases: 1) MNIST handwrtitting digits database [19], from which we extracted 1000 images randomly from the 625-dimensional database; 2) Iris [20] dataset, containing 50 samples of 4 different attributes measured on flowers; and 3) Wine [21], consisting of 178 samples of wines, each one described with 12 different attributes. All of them are available in [22]. The MSE reduction (with regard to the MSE in the first principal component) are shown in Table 2. In all cases, using PPA leads to a consistent decrease of the reconstruction error with regard to PCA for the same truncation dimension. Table 2. MSE rate for different dimension truncation on the MNIST, IRIS and Wine datasets (top to bottom). Dim 1 4 7 10 13 16 19 22 25 28 PCA 100 76.1 61.9 51.8 44.6 38.8 34.2 30.3 26.9 24.2 PPA 95.8 69.3 56.1 47.5 41.2 36.0 31.5 28.1 25.0 22.3 Dim 1 2 3 PCA 100 29.6 6.9 PPA 57.8 24.7 5.8 Dim 1 2 3 4 PCA 100 43.4 15.8 8.0 PPA 92.7 38.5 14.2 7.1
5 3.6 3.1
6 2.0 1.6
7 1.2 1.0
8 0.7 0.6
9 0.3 0.3
10 0.1 0.1
3.3. Experiment 3: image texture reconstruction In this experiment, we consider text images to deal with strongly non-Gaussian spatial patterns. Figure 3 (left panel) shows the manifolds corresponding to the class of images shown in Fig. 4. Neighboring pixels were arranged in 5dimensional vectors. The non-Gaussian nature of the manifold comes from the fact that most pixels in these images are
either black or white, giving rise to clusters at the edges of an hypercube in the input (pixel) domain. The lattices in Fig. 3 are defined by uniformly sampling the plane given by the first two features in PCA and PPA. The distribution of these lattices in the pixel domain (using the corresponding inverse, cf. Fig. 3[left]) represents how closely the features follow the actual data distribution. Moreover, the data variance not captured by each lattice suggests how big the reconstruction error will be if only these dimensions are preserved. The lattices also illustrate the distortions in the event of vector quantization. It is apparent that PPA is a more appropriate representation than PCA for these non-Gaussian patterns. This is consistent with the improved variance compaction in the PPA case (right panel). Estimates of mutual information also give rise to the same conclusion: 5.54 bits in PCA and 4.79 bits in PPA. As a result, the amplitude of the related data is smaller in the PPA domain (compare the pattern above and below the lattices in Figs. 3 middle and right). Figure 4 shows the reconstructed textures: beyond the observed decrease in MSE for all dimensions, the reconstructed textures are smoother. 3.4. Experiment 4: multispectral image classification In this experiment, we focus on the segmentation of remotelysensed multispectral images. Nowadays, sensors mounted on satellite or airborne platforms may acquire the reflected energy by the Earth with high spatial detail and in several wavelengths or spectral channels. This allows the detection and classification of the pixels in the scene. The obtained classification maps are then used for management, policy making and monitoring. In multispectral imagery, the pixels are multidimensional (RGB and near-infrared bands), and thus compacting the information with PCA is a common procedure [23]. We here use a multispectral 4-band (visible and infrared) Z¨urich image (Fig. 5, top left). Five classes of interest have been labeled by human photointerpretation (27669 pixels in Fig. 5, top right). For analysis, the 4-dimensional spectral signatures corresponding to these pixels have been randomly split into two sets: 600 pixels for training and 1400 for test. Classification of each pixel is done using LDA after transforming the spectra with PCA, LLE [4], and the proposed PPA. Ten realizations with varying training sets have been done, to assess the generalization capabilities of the classifier trained on the transformed data. PPA outperforms the rest of the methods for any number of features not only in variance compaction (Fig. 5, bottom right), but also in classification accuracy (Fig. 5, bottom left). Variance and mutual information measures are not meaningful in the LLE case since it yields non-invertible trasnforms. The slight improvement of PPA in variance terms with regard to PCA is due to the fact that, in this real dataset, the conditional mean dependence is not as big as in the synthetic
Original domain
PCA
PPA
Variance
PCA PPA
4
Variance
10
3
10
1
2
3 4 Feature
5
Fig. 3. Text images in the pixel, the PCA and the PPA representations. Left panel shows the image samples (in cyan) in the pixel domain (left), in the PCA domain (middle) and in the PPA domain (right). Illustrative lattices (in blue and red) are transformed from PCA and PPA domains back to the pixel domain. Right panel shows the variance of the features in the considered representations. PCA1RMSE = 48.4
PCA2RMSE = 26.1
PCA4RMSE = 7.1
5
= 21.9
PPA4RMSE
= 5.6
variance
= 46.6
PPA2RMSE
kappa
0.75
PPA1RMSE
0. 7 0.65 0. 6 0.55 2
Fig. 4. Reconstructed text images after dimensionality reduction with PCA (top) and PPA (bottom). From left to right the number of features increases from 1 to 4 (bold superscripts).
3
# features
PCA LLE PPA 4
7
x 10
PCA PPA
4 3 2 1 0 1
2
3
# features
4
Fig. 5. Multispectral results. Composite RGB image (top left). Ground truth classification map (top right). Cohen’s κ statistic (bottom left). Variance of the features in the transformed domains (bottom right).
example of Section 2. Similar results are also obtained in mutual information estimates: while PCA achieves 2.68 bits, PPA gives 2.66 bits. 4. CONCLUSIONS PCA linear features are optimal for dimensionality reduction only when data display a very particular symmetry. The proposed PPA is a nonlinear generalization of PCA that relaxes the required symmetry. We analytically proved that PPA outperforms PCA in truncation error and in energy compaction. Results on different data sets illustrate the ability of PPA on redundancy reduction. Moreover, examples on multispectral image classification and non-Gaussian image texture coding showed the usefulness of PPA. As most recently proposed techniques, it allows to de-
scribe nonlinear data, but it also offers all the appealing properties that made linear PCA successful: the proposed transform is invertible, it allows easily to compute out of sample prediction without recurring to approximated methods and also returns a hierarchically layered prediction. The procedure does not depend on the target dimension: similarly to PCA, the dimensionality of the reduced feature set can be decided a-posteriori, for example using the variance of extracted features. Future work is tied to the analysis of the robustness of the method, and the comparison to other manifold learning methods.
5. REFERENCES [1] J. A. Lee and M. Verleysen, Nonlinear dimensionality reduction, Springer, 2007. [2] J. B. Tenenbaum, V. Silva, and J. C. Langford, “A global geometric framework for nonlinear dimensionality reduction,” Science, vol. 290, no. 5500, pp. 2319–2323, 2000. [3] Y. W. Teh and S. Roweis, “Automatic alignment of local representations,” NIPS, vol. 15, pp. 841–848, 2003. [4] S. Roweis and L. Saul, “Nonlinear dimensionality reduction by Locally Linear Embedding,” Science, vol. 290, no. 5500, pp. 2323–2326, 2000.
[13] I. T. Jolliffe, Principal component analysis, Springer, 2002. [14] D. Donnell, A. Buja, and W. Stuetzle, “Analysis of additive dependencies and concurvities using smallest additive principal components,” The Annals of Statistics, vol. 22, no. 4, pp. 1635–1668, 1994. [15] P. C. Besse and F. Ferraty, “Curvilinear fixed effect model,” Computational Statistics, vol. 10, pp. 339–351, 1995. [16] M. A. Kramer, “Nonlinear principal component analysis using autoassociative neural networks,” AIChE Journal, vol. 37, no. 2, pp. 233–243, 1991.
[5] B. Sch¨olkopf, A. J. Smola, and K-R. M¨uller, “Nonlinear component analysis as a kernel eigenvalue problem,” Neural Comp., vol. 10, no. 5, pp. 1299–1319, 1998.
[17] G. E. Hinton and R. R. Salakhutdinov, “Reducing the dimensionality of data with neural networks,” Science, vol. 313, no. 5786, pp. 504–507, July 2006.
[6] P. J. Huber, “Projection pursuit,” Ann. Stat., vol. 13, no. 2, pp. 435–475, 1985.
[18] M. Scholz, M. Fraunholz, and J. Selbig, Nonlinear principal component analysis: neural networks models and applications, chapter 2, pp. 44–67, Springer, 2007.
[7] V. Laparra, G. Camps-Valls, and J. Malo, “Iterative gaussianization: from ICA to random rotations,” IEEE Trans. Neur. Net., vol. 22, 2011. [8] J. Venna, J. Peltonen, K. Nybo, H. Aidos, and S. Kaski, “Information retrieval perspective to nonlinear dimensionality reduction for data visualization,” J. Mach. Learn. Res., vol. 11, pp. 451–490, 2010. [9] J. Einbeck, G. Tutz, and L. Evers, “Local principal curves,” Statistics and Computing, vol. 15, pp. 301–313, 2005. [10] J. Einbeck, L. Evers, and K. Hinchliff, Data compression and regression based on local principal curves, pp. 701–712, Springer, 2010. [11] U. Ozertem and D. Erdogmus, “Locally defined principal curves and surfaces,” JMLR, vol. 12, pp. 1249–1286, 2011. [12] V. Laparra, S. Jim´enez, G. Camps-Valls, and J. Malo, “Nonlinearities and adaptation of color vision from sequential principal curves analysis,” Neural Comp., Accepted, 2012.
[19] Y. LeCun, L. Bottou, Y. Bengio, and P. Haffner, “Gradient-based learning applied to document recognition,” in Intelligent Signal Processing. 2001, pp. 306– 351, IEEE Press. [20] R. A. Fisher, “The use of multiple measurements in taxonomic problems,” Annals Eugen., vol. 7, pp. 179–188, 1936. [21] M. Forina, “UCI Machine Learning Repository: Wine Data Set,” . [22] A. Frank and A. Asunci´on, repository,” 2010.
“UCI machine learning
[23] G. Camps-Valls, D. Tuia, L. G´omez-Chova, S. Jim´enez, and J. Malo, Eds., Remote Sensing Image Processing, Morgan & Claypool Publishers, LaPorte, CO, USA, Sept 2011, Collection ‘Synthesis Lectures on Image, Video, and Multimedia Processing’, Al Bovik, Ed.