the development of control systems which can eliminate or lessen the effects of instability in any ..... have an effect on the instability or were beginning to cause the frequency to shift, but were limited due to .... [6] Coker, A., Neumeier, Y., Lieuwen, T., Zinn, B.T., Menon, S., âStudies of Active ... Congress and Exhibition, 1998.
Nonlinear Interactions between Driven and Self-Excited Acoustic Oscillations in a Premixed Combustor Benjamin D. Bellows*, Alex Hreiz†, Tim Lieuwen‡ Georgia Institute of Technology, Atlanta, GA 30332
This paper describes an experimental investigation of the nonlinear interactions between self-excited and driven oscillations in a premixed swirl-stabilized combustor. This interaction is studied by externally forcing oscillations at some frequency, fdrive, in an unstable combustor oscillating at a frequency, fins. Above a certain amplitude of forcing, the self-excited oscillation amplitude decreases. In some cases, the self-excited oscillations can be eliminated almost completely, but in others the effect is slight. As such, in the former case, open-loop forcing is very effective in reducing the overall acoustic power. This paper characterizes a variety of features of these oscillations, such as the quenching amplitude, its dependence upon frequency spacing between the driven and natural modes, and the frequency shift of the unstable mode. Although not understood, it is observed that the key difference between cases where open loop forcing is and is not effective in reducing the overall acoustic power, is that the instability frequency stays roughly constant and changes with forcing amplitude, respectively.
I. Introduction
T
his paper describes an investigation of the nonlinear interactions between natural acoustic modes and driven oscillations in a lean, premixed swirl stabilized combustor. This work is motivated by the fact that combustion instabilities are a serious problem in low emissions, premixed combustion systems1-4. These instabilities generally occur when the unsteady combustion process couples with one or more of the combustor’s acoustic modes, resulting in self-excited oscillations. The objective of this work is to improve the understanding of the nonlinear dynamics associated with these unstable combustors. Improved understanding of nonlinear combustion processes is needed to further the development of methods to predict limit cycle amplitudes as well as control methodologies. Generally, these oscillations have been suppressed through passive methods, which typically involve changes in the combustor’s geometry. These methods have been implemented in order to increase the amount of damping of the unstable combustor modes and/or decrease the amount of driving of the unsteady combustion process. However, implementing these methods, such as the use of acoustic liners, baffles, or other geometry changes in the combustor, can be time-consuming and expensive. To this end, there has been increased interest in the development of control systems which can eliminate or lessen the effects of instability in any combustor5. In many cases, implementation of closed loop, active control has been shown to work with varying degrees of success6. Typically, active control schemes will harmonically modulate the fuel out of phase with the instability. By introducing the fuel out of phase with the heat release, the coupling between the combustion process and the acoustic modes of the combustor is ideally eliminated. In other cases, the use of open loop excitation, at frequencies not necessarily equal to that of the instability, has been employed7-11. For example, Lubarsky et al. performed an experimental study which injected fuel at a non-resonant frequency and found significant suppression of high amplitude instabilities11.
*
Graduate Research Assistant, School of Aerospace Engineering, Student Member Undergraduate Research Assistant, School of Aerospace Engineering, Student Member ‡ Associate Professor, School of Aerospace Engineering, Senior Member †
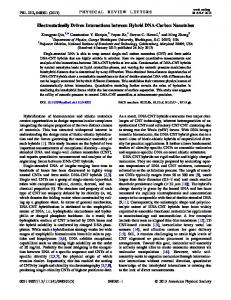
This present work is also motivated by a previous study focusing on the nonlinear flame transfer function between driven pressure oscillations and heat release fluctuations in premixed swirling flame12. During these tests, nonlinear interactions between a natural combustor mode and those due to acoustic forcing were observed. Specifically, a steady decrease in the amplitude of the unstable mode was observed as the driven mode amplitude was increased. This behavior was attributed to frequency-locking, a well-known nonlinear oscillator phenomenon. Frequency locking is due to nonlinear interactions between oscillations at separate frequencies. It is manifested as a decrease in amplitude of the selfexcited or natural mode oscillations as the amplitude of Figure 1. Dependence of natural mode amplitude the driven oscillations increases. This behavior is clearly on driven-mode amplitude12 illustrated in Figure 1, which shows the decrease in natural mode amplitude with increasing drive amplitude12. However, the quenching/entrainment amplitude was quantified in terms of the pressure amplitude, and not the corresponding velocity, which is generally accepted to be the key parameter influencing the heat release oscillations in premixed flames; e.g., see Ref. [13]. In a subsequent study, the authors initiated a systematic study of the effect of frequency spacing between the driven and self-excited oscillations on the natural mode response14. Bellows et al. specifically investigated driving frequencies which were less than the natural mode of this combustor. They found that the entrainment or quenching velocity amplitude increased essentially monotonically as the difference between driving and instability frequency increased, fdrive - fins. In addition, they report that the corresponding pressure amplitude of the driven mode is nonlinearly related to the frequency spacing, clarifying some of the findings reported by Lieuwen & Neumeier12. The present paper extends the range of conditions presented in Bellows et al.14, by obtaining data at conditions where open loop forcing is not effective.
II. Background The basic phenomenon of frequency locking can be illustrated from a model equation for a nonlinear, second order oscillator: 1 �� x + ωo2 x = ε x� − x� 3 + E ( t ) (1) 3 where ε is a small parameter and E(t) = Kcos(Ωt) is the external forcing. The leading order solution of Eq. (1) is a superposition of the limit cycle and forced oscillations and takes the form:
x = a ( t ) cos (ωo t + β ) +
K
ωo2
− Ω2
cos Ωt + O ( ε )
(2)
Following Nayfeh & Mook15, the amplitude of the response, a(t), can be determined analytically.
4η
a2 =
ωo2
(3)
4η + 2 − ωo2 exp ( −εη t ) a o
(
)
−2 1 where ao is the initial amplitude of oscillation and η = 1 − Ω 2 K 2 ωo2 − Ω 2 . 2 Note, that this solution for the limit cycle amplitude is dependent on both the external driving amplitude and the frequency spacing between the driven and natural mode. However, if we parameterize the response in terms
2 American Institute of Aeronautics and Astronautics
of the system response at the forcing frequency and not the actual input driving signal, this solution becomes independent of frequency spacing since: K x forced ( t ) ∝ (4) 2 ωo − Ω 2
)
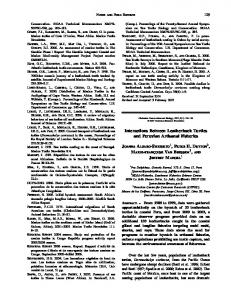
Figure 2 plots the steady state solution ( t → ∞ ) of the self-excited amplitude for increasing forcing amplitude. It shows the monotonic reduction in instability amplitude, a(t), (until its amplitude reaches zero), as the forcing amplitude, E(t) is increased. Similar behavior is observed experimentally, as shown in Figure 2 and described in the rest of the paper.
III. Experimental Setup
Instability Amplitude
(
Quenching Point
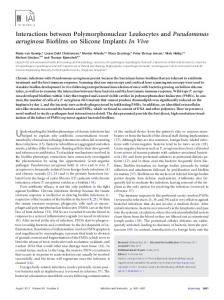
Experiments were performed with an atmospheric, 10 KW swirl-stabilized burner, schematically shown in Figure 3. Two flow rates were investigated, ReD=23,000 and 34,000 (based Forcing Amplitude on premixer exit diameter) corresponding to average premixer exit plane velocities of 22 and 33 Figure 2. Theoretical response curve of nonlinear selfm/s, respectively. Reactant inlet temperatures were excited oscillator to forced oscillations kept constant at room temperature. Natural gas and air are supplied from building facilities, whose flow rates are measured with rotameters. In order to ensure that acoustic oscillations do not affect fuel/air mixing processes, the air and fuel are Combustion Zone introduced upstream of a choke point. The mixture goes through the premixer, consisting of a 40° Pressure swirler and an annular passage and then expands Taps into a cylindrical 70mm i.d. quartz tube combustion chamber. The instability frequency Loudspeakers can be changed by simply switching out quartz tubes lengths or changing the thermal power setting of the combustor. For this study, tube lengths of 305 and 406 mm were used. Pressure oscillations are measured with Model 211B5 Kistler pressure Air + Natural Gas transducers mounted downstream of the swirl Inlet Section vanes, 5.85cm and 7cm upstream of the rapid expansion. Velocity oscillations are calculated Figure 3. Schematic of atmospheric swirl-stabilized using the two microphone method outlined in, e.g. burner Ref. [16]. Oscillations are driven in the combustor by two loudspeakers mounted into the inlet section; see Figure 3. Three operating conditions were investigated in this study. These conditions examined the effect of instability frequency and amplitude on the quenching/entrainment characteristics of the system. The complete operating conditions are outlined in Table 1 below. Equivalence ratio, φ Natural frequency (Hz) + 5 Hz Flow velocity (m/s) Pressure instability amplitude (p’/po) Table 1. Combustor operating conditions
Condition 1
Condition 2
Condition 3
0.83 461 Hz 22 m/s 0.013-0.015
0.83 350 Hz 22 m/s 0.02-0.024
0.87 510 Hz 33 m/s 0.01-0.013
3 American Institute of Aeronautics and Astronautics
IV. Experimental Results and Discussion Condition 1 tests were performed at a nominally unstable condition, with an instability frequency of 461 Hz. The forcing frequencies investigated ranged from 150 to 430 Hz and for all cases, the overall acoustic power was substantially reduced by the presence of acoustic forcing. Some results were obtained at forcing frequencies higher than the instability amplitude, but are not reported here, as the speaker lacked the authority to substantively influence the instability. A typical result is shown in Figure 4. The nominal amplitude of the 461 Hz instability is about 1.5% of the mean pressure in the combustor. In this particular case, forced oscillations are excited at 200 Hz over a range of amplitudes. As shown in Figure 4(a), increased forcing levels cause the 461 Hz mode amplitude to decrease, and to nearly disappear at high driving amplitudes. In addition, the harmonic associated with the instability at 922 Hz also disappears. Due to this reduction in the instability mode and its harmonic the acoustic power in the 0-1000 Hz range is significantly reduced. The maximum reduction in acoustic power in the spectra between 0 and 1000 Hz is 90% for this case.
AL
0.02
0.015
Increasing Driving Decreasing Driving RMS Pressure
Unstable Mode
p′ / p o
Driven Oscillation 0.005
p′ instability / p o
0.015
Reduction in instability amplitude by open-loop forcing
0.01
0.01
0.005
0 0
200
400 600 Frequency (Hz)
800
1000
0 0
AE
δp 0.1 u′
0.2 /u
drive
(a)
0.3
0.4
o
(b)
Figure 4. (a) Spectrum of combustor pressure at two driving amplitudes showing decrease in combustor instability mode as driving amplitude is increased (instability frequency = 461 Hz, driving frequency = 200 Hz). (b) Dependence of instability amplitude on driving velocity amplitude at 200 Hz driving frequency The typical dependence of the natural instability amplitude on the driving amplitude is shown in Figure 4(b). At the highest driving amplitudes, the instability has essentially disappeared at the cost of the increase in amplitude of the driven pressure. There are several basic features of the instability amplitude dependence upon driving amplitude that can be discerned from Figure 4(b). First, the instability amplitude is independent of the forcing amplitude for some amplitude range before decreasing; we have referred to the driving amplitude at which this decrease begins as AL. Second, the instability amplitude decreases with some slope, δp, for further driving amplitude increases. Third, the instability amplitude essentially goes to zero, or to near zero values above some driving amplitude, referred to here as the entrainment amplitude, Ae. For example, in Figure 4(b) the entrainment amplitude is ~25% of the mean velocity at the premixer exit. Also shown in the figure is the overall RMS pressure amplitude of the driven oscillation and natural mode, which has a minimum near the entrainment amplitude and then begins to rise with increased forcing levels, due to the growing amplitude of the imposed oscillations. Finally, the dependence of the unstable mode amplitude upon the driving amplitude exhibits some hysteresis, with typical levels on the order of u’/uo = 0.03.
4 American Institute of Aeronautics and Astronautics
Power = ∫ p ′ df 2
(5)
Figure 8 plots the frequency dependence of the maximum reduction in acoustic power due to openloop forcing at each forcing frequency. This reduction in acoustic power is quantified by:
0.3
fins
0.25
Ae
0.2 0.15 0.1 0.05 0 150 190 230 270 310 350 390 430 470 Frequency (Hz)
Figure 5. Dependence of velocity entrainment amplitude, AE upon driving frequency (fins = 461 Hz). 0.2
δp
0.15
0.1
0.05
fins 0 150 190 230 270 310 350 390 430 470 Frequency (Hz)
Figure 6. Dependence of instability rolloff, δp, on driving frequency (fins= 461 Hz).
0.1
fins 0.08 0.06 AL
These characteristics depend significantly upon driving frequency. We consider first the entrainment amplitude dependence upon driving frequency, which is plotted in Figure 5. The entrainment amplitude, Ae, grows as the forcing frequency is moved away from the instability frequency of 461 Hz, except very close to the instability (fdrive = 400-430 Hz). The trend in Figure 5 seems intuitively reasonable, although we do not have any specific theory our intuition was based upon. It should be pointed out, however, that Ae is actually independent of forcing frequency for the model problem considered earlier. The entrainment amplitude based upon perturbation pressure, rather than velocity, exhibits a different trend. It increases monotonically with decreasing frequency down to about 230 Hz and then decreases for lower frequencies. This is due to the frequency dependence of the pressurevelocity relation. We next consider the slope of the instability amplitude rolloff, δp, shown in Figure 6. The instability rolloff has a complex dependence on frequency. The highest slopes, and therefore the most rapid rolloff of the instability amplitude, occur at 250 and 400 Hz. Local minima are seen at 160 Hz and 310 Hz. Similarly, the parameter AL’s frequency dependence is shown in Figure 7. In general, AL is found to be largest at frequencies which are far away from the instability and smallest at frequencies closer to the instability. The values of AL range from u’/uo= 0.02-0.10. At 240 Hz, this value decreases linearly from its maximum value, near where the instability rolloff hits its maximum, and flattens out after 310 Hz, where the instability rolloff hits a minimum. In general, the parameter AL is seen to change values near local minima and maxima in the instability rolloff value. As these results have direct implication on open loop forcing as an active control methodology, it is of interest to analyze the total acoustic power reduction in the 0-1000 Hz range where power is defined as:
0.04 0.02
Uncertainty in AL value
0 150 190 230 270 310 350 390 430 470 Frequency (Hz)
Figure 7. Dependence of AL parameter (velocity oscillation amplitude range which is independent of forcing) on driving frequency (fins = 461 Hz) 5 American Institute of Aeronautics and Astronautics
100
where Powero and Powermin represent the acoustic power in the absence of driving and the minimum acoustic power achieved over the velocity amplitude range. This maximum reduction in acoustic pressure power usually occurs at a forcing amplitude close to Ae. The figure shows that in all cases, the acoustic power is reduced by at least 70%. The best results occur at frequencies where the entrainment pressure amplitude is smallest and the worst results are where the entrainment pressure amplitude is highest, as may be expected. For larger entrainment amplitudes, more acoustic power is being added into the system at the point of entrainment. Therefore, the reduction in instability amplitude comes at the cost of larger driven amplitudes. We next consider Condition 2, corresponding to a lower instability frequency, 350 Hz (obtained with a longer tube), at the same conditions. The instability amplitude is about 50% higher than Condition 1, about 2.2% of the mean pressure. The forcing frequencies investigated ranged from 150 to 490 Hz. Figure 9 plots the maximum percentage reduction in acoustic power in the 0-1000 Hz range that can be achieved. Note that at this operating condition, the effect of driving does not reduce the instability amplitude to near the extent it did for Condition 1. Although we do not fully understand the reasons for these differences in the effects of open loop forcing, we speculate that two factors are significant: 1) larger levels of acoustic forcing required to overcome the initially higher amplitude oscillations and 2) these higher driving amplitudes, besides acting to quench the instability, introduce other nonlinear phenomenon, such as frequency shifts and spectral broadening.. This latter point is clearly shown in Figure 10, which indicates that the instability shifts from the nominal instability frequency to higher values near 390 Hz. This figure plots two pressure spectra for a driving frequency of 260 Hz, one corresponding to the nominal unstable condition and the other at a driving velocity amplitude of u’drive / uo = 0.25, where entrainment was seen to occur in Figure 5 at many of the frequencies investigated in Condition 1. For the no driving case, the pressure spectrum shows the oscillations at the fundamental, 350 Hz, and slightly at the first harmonic around 700 Hz. As acoustic forcing is added, the instability amplitude at 350 Hz decreases somewhat, and shifts to a higher frequency, 390 Hz. At this driving frequency (260 Hz), the peak seen near 380-390 Hz does not readily
Maximum Reduction in Acoustic Power (%)
(6)
80 60 40
fins
20
0 150 190 230 270 310 350 390 430 470 Frequency (Hz)
Figure 8. Dependence of maximum acoustic pressure power reduction on driving frequency (fins= 461 Hz). 100
Maximum Percentage Reduction in Acoustic Power 0-1000 Hz
Powero − Powermin Powero
fins 80 60 40 20 0 150
180
210 240 270 300 Frequency (Hz)
330
360
Figure 9. Dependence of maximum acoustic power reduction on driving frequency (fins = 350 Hz) 0.35
Driven 0.3 Oscillation Pressure PSD
Powerred =
Unstable Mode
0.25 0.2
Shift in Combustor Response
0.15 0.1 0.05 0 200
300
400 500 600 Frequency (Hz)
700
800
Figure 10. Spectra of combustor pressure at two driving amplitudes showing decrease and frequency shift of combustor instability mode as driving amplitude is increased (fins= 350 Hz, fdrive = 260 Hz)
6 American Institute of Aeronautics and Astronautics
correspond to any harmonics of the fundamental frequency of the driving signal, nor of the natural mode in the combustor. This behavior is illustrated further in Figure 11. Figure 11(a) plots the pressure spectra in the frequency range of 340-400 Hz for a driving frequency of 260 Hz. For increasing driving amplitudes, the pressure spectra clearly shows the transition of the instability to higher frequencies, away from the nominal value of 350 Hz. In addition, the frequency shifted band is also clearly broadened in frequency space. In contrast, Figure 11(b) plots similar spectra for Condition 1 between 450 and 500 Hz for increasing driving velocity amplitudes for a driving frequency of 200 Hz. In this case, it is clear that the instability is quenched and no such shift in the frequency is present. This difference, while not understood, appears to be the distinguishing feature between cases where open loop forcing was and was not effective. 0.02
0.012
0.015
0.01
p′ / po
p′ / po
0.008 Increasing Driving Amplitude
Increasing Driving Amplitude
0.004 0.005
0 300
320
340 360 Frequency (Hz)
380
400
0 430
440
(a)
450 460 470 Frequency (Hz)
480
490
(b)
Figure 11. Dependence of pressure spectra in vicinity of nominal instability frequency for (a) Condition 2 (instability frequency = 350 Hz, driving frequency = 260 Hz) and (b) Condition 1 (fins = 461 Hz, fdrive= 200 Hz).
p′ / po
Furthermore, the instability amplitude, even when shifted, never is reduced to zero with increasing driving amplitude – the pressure spectra in Figure 11(a) indicates that there are still some remnants of the instability at the highest driving, compared to essentially none in Figure 11(b). Therefore, the driving does not truly quench the instability for this condition compared to the previous case. The “final” frequency to which the instability settled at highest driving levels ranged between 380 and 400 Hz, with no apparent relationship to the fundamental driving frequency or instability mode (except for driving frequencies whose harmonics are in this regime – e.g. fdrive = 190 Hz). For both Condition 1 and Condition 2, 0.02 forcing of the combustor at driving frequencies Natural Combustor Mode greater than the instability frequency was largely unsuccessful. For instance, Figure 5 (instability 0.015 Driven Oscillation frequency = 461 Hz) shows that forcing at fdrive = 390 Hz results in an extremely low quenching amplitude of u’/uo = 0.05. For the corresponding 0.01 case for Condition 2 (instability frequency = 350 Hz), the effect of forcing at 390 Hz is almost negligible. Figure 12 shows that the instability 0.005 neither changes significantly in amplitude (as manifested by the area under the curve) nor shifts to 390 Hz. The small shift in frequency around 350 Hz is not monotonically dependent on driving 0 340 350 360 370 380 390 400 amplitude. This effect is not understood at this Frequency (Hz) point. We investigated the effect of these larger Figure 12. Combustor pressure spectra for increasing driving frequencies up to 500 Hz. Only 1 driving amplitude for fdrive greater than fins (fdrive = 390 frequency was found to cause the significant Hz) 7 American Institute of Aeronautics and Astronautics
fins (Hz)
Percentage Reduction in Acoustic Power 0-1000 Hz
frequency shift with slight amplitude reduction (~20%), fdrive = 420 Hz. All other driving frequencies either did not have an effect on the instability or were beginning to cause the frequency to shift, but were limited due to loudspeaker limitations. Similar behavior was observed for Condition 3, which used the same tube length as 550 100 condition 1. Figure 13 illustrates the shift in instability frequency for increasing driving amplitude 540 80 at a driving frequency of 160 Hz. Figure 13 shows that for initial increases, the instability frequency 530 60 varies very little, but then changes significantly between u’/uo = 0.1 – 0.15. For this condition, the instability frequency shifts from its nominal value 520 40 around 510 Hz to approximately 550 Hz at high driving amplitudes. In addition, the effect of non510 20 resonant driving is, at best, as effective in reducing the acoustic power in the system than the results shown for Condition 2, and in many cases is less 500 0 effective. Figure 13 indicates that the maximum 0 0.05 0.1 0.15 0.2 0.25 reduction in acoustic power is approximately 50% u′drive / uo for this case. Figure 13. Dependence of instability frequency and acoustic power on driving amplitude, fdrive = 160 Hz)
Conclusions This study clarifies a number of issues related to the nonlinear interactions between driven and natural unstable combustor modes but also raises new questions. The effect of external is seen to have several effects on the self-excited oscillations by altering their amplitude, spectral bandwidth and/or frequency. The effectiveness of open-loop control of the combustor significantly depends on the operating condition. For cases where the instability mode is reduced slight and shifts in frequency, quenching does not occur, although some amplitude reductions may be observed. In addition, for both conditions investigated, the ability to significantly affect the self-excited mode is quite difficult at driven frequencies above the instability frequency. Only at a few select cases has open-loop forcing been able to achieve this quenched state. The instability rolloff, δp, and parameter, AL, are seen to both have complex dependencies on the driving frequency and are substantially dependent on the frequency spacing. No analysis of the flame response under the influence of self-excited and driven oscillations has been performed up to this point. The dynamics of the flame could play a very large role in the quenching/entrainment behavior of the system response. The nonlinear behavior of the flame response to forced oscillations and its influence on the frequency response curves in a gas turbine combustor was studied previously17. Detailed imaging of the flame along with corresponding chemiluminescence could perhaps give better information on the fundamental differences between the two operating conditions presented herein.
Acknowledgments This publication was prepared with the support of the US Department of Energy, Office of Fossil Energy, National Energy Technology Laboratory, under contract 02-01-SR095 (Dr. Richard Wenglarz, contract monitor). Any opinions, findings, conclusions, or recommendations included herein are those of the authors and do not necessarily reflect the views of the DOE.
References [1] Cohen, J., Wake, B.E., Choi, D., Investigation of Instabilities in a Lean, Premixed Step Combustor, J. Prop. Power, Vol. 19(1), pp.81-88, 2003.
8 American Institute of Aeronautics and Astronautics
[2] Lee, J.G., Santavicca, D. “Experimental Diagnostics in Unstable, Lean, Premixed Combustors”, in T. Lieuwen, V. Yang (Eds.), Combustion Instabilities in Gas Turbine Engines, Operational Experience, Fundamental Mechanisms, and Modeling, AIAA, Reston, VA, 2005, p.481. [3] Paschereit, C.O., Gutmark, E., Weisenstein, W., Control of Thermo-Acoustic Instabilities and Emissions in an Industrial Type Gas Turbine Combustor, Proc. Comb. Inst., 1998. [4] Mongia, H.C., Held, T.J., Hsiao, G.C., Pandalai, R.P., Challenges and Progress in Controlling Combustion Dynamics in Gas Turbine Combustors, J. Prop. Power, Vol. 19(5), pp.822-829, 2003. [5] McManus, K.R., Poinsot, T., Candel, S.M., Review of Active Control of Combustion Instabilities, Prog. Energy Combust. Sci., 19(1), 1993, pp.1-29. [6] Coker, A., Neumeier, Y., Lieuwen, T., Zinn, B.T., Menon, S., “Studies of Active Control Effectiveness in a High Pressure, Liquid-Fueled Combustor”, AIAA paper #2003-1009, 2003 [7] Neumeier, Y., Zinn, B.T., “Experimental Demonstration of Active Control of Combustion Instabilities Using Real Time Modes Observation and Secondary Fuel Injection”, Proc. Comb. Inst., 26, 1996. [8] Sattinger, S.S., Neumeier, Y., Nabi, A., Zinn, B.T., Amos, D.J., Darling, D.D., “Sub-scale Demonstration of Active Feedback Control of Gas-Turbine Combustion Instabilities”, Proc. Int. Gas Turbine and AeroEngine Congress and Exhibition, 1998. [9] Johnson, C.E., Neumeier, Y., Darling, D.D., Sattinger, S.S., Neumaier, M., Zinn, B.T., “Demonstration of Active Control of Combustion Instabilities on a Full Scale Gas Turbine Combustor”, 36th AIAA/ASME/SAE/ASEE Joint Propulsion Conference, 2000. [10] Neumeier, Y., Cohen, J., Shcherbik, D., Lubarsky, E., Zinn, B.T., “Suppression of Combustion Instabilities in Gaseous Fuel Combustor Using Fast Adaptive Control, Part 1: Controllability Tests”, AIAA paper 2002-4076, 2002. [11] Lubarsky, E., Shcherbik, D., Zinn, B.T., “Active Control of Instabilities in High-Pressure Combustor by NonCoherent Oscillatory Fuel Injection”, AIAA paper 2003-4519, 2003 [12] Lieuwen, T., Neumeier, Y., Nonlinear Pressure-Heat Release Transfer Function Measurements in a Premixed Combustor, Proc. Comb. Inst., Vol. 29, pp.99-105, 2002. [13] Lieuwen, T., “Experimental Investigation of Limit Cycle Oscillations in an Unstable Gas Turbine Combustor”, J. Prop. Power, 18(1), 2002, pp.61-67. [14] Bellows, B.D., Hreiz, A. Lieuwen, T., “Nonlinear Dynamics of an Unstable Swirl Combustor: FrequencyLocking and Open-Loop Control”, Proc. 20th International Colloquium on Dynamics of Explosions and Reactive Systems, 2005. [15] Nayfeh, A.H., Mook, D.T., Nonlinear Oscillations, J. Wiley & Sons, 1995. [16] Abom, M., Boden H., Error Analysis of Two-Microphone Measurements in Ducts with Flow. J. Acoust. Soc. Am., 83(6), pp.2429–2438, 1988. [17] Bellows, B.D, Lieuwen, T., “Nonlinear Response of a Premixed Combustor to Forced Acoustic Oscillations”, AIAA paper 2004-0455, 2004.
9 American Institute of Aeronautics and Astronautics