Hindawi Publishing Corporation Mathematical Problems in Engineering Volume 2015, Article ID 851313, 13 pages http://dx.doi.org/10.1155/2015/851313
Research Article Normal Inverse Gaussian Model-Based Image Denoising in the NSCT Domain Jian Jia,1 Yongxin Zhang,2,3 Li Chen,2 and Zhihua Zhao2 1
School of Mathematics, Northwest University, Xi’an 710127, China School of Information Science and Technology, Northwest University, Xi’an 710127, China 3 Luoyang Normal University, Luoyang 471022, China 2
Correspondence should be addressed to Jian Jia;
[email protected] Received 15 October 2015; Revised 8 December 2015; Accepted 9 December 2015 Academic Editor: Daniel Zaldivar Copyright © 2015 Jian Jia et al. This is an open access article distributed under the Creative Commons Attribution License, which permits unrestricted use, distribution, and reproduction in any medium, provided the original work is properly cited. The objective of image denoising is to retain useful details while removing as much noise as possible to recover an original image from its noisy version. This paper proposes a novel normal inverse Gaussian (NIG) model-based method that uses a Bayesian estimator to carry out image denoising in the nonsubsampled contourlet transform (NSCT) domain. In the proposed method, the NIG model is first used to describe the distributions of the image transform coefficients of each subband in the NSCT domain. Then, the corresponding threshold function is derived from the model using Bayesian maximum a posteriori probability estimation theory. Finally, optimal linear interpolation thresholding algorithm (OLI-Shrink) is employed to guarantee a gentler thresholding effect. The results of comparative experiments conducted indicate that the denoising performance of our proposed method in terms of peak signal-to-noise ratio is superior to that of several state-of-the-art methods, including BLS-GSM, K-SVD, BivShrink, and BM3D. Further, the proposed method achieves structural similarity (SSIM) index values that are comparable to those of the block-matching 3D transformation (BM3D) method.
1. Introduction The objective of image denoising, a classical but still very active area in image processing, is to retain useful details while removing as much noise as possible to recover the original image from a noisy image [1]. Following the development of the fast wavelet decomposition method by Mallat [2], wavelet transform has been used extensively in various fields. Its use rapidly extended from mathematics and signal processing to other fields, such as image denoising, an important image processing technique that has developed rapidly with the introduction of wavelets. The threshold method, developed by Donoho [3] in 1995, provides a viable treatment option for the wavelet coefficients of nonlinear processing and, consequently, significantly advanced the field of image denoising. Other feasible wavelet-based approaches have also been developed. Hard and soft thresholds emerged first, followed by Bayesian threshold [4, 5] methods that significantly enhanced the
denoised results. Recently, various intrascale correlation coefficient threshold methods and a coefficient threshold method under high-dimensional space [6] have also been developed. Through continuous improvement of the threshold method, wavelet denoising methods have achieved increasingly better denoised results. These methods are supported by the underlying wavelet theory. Further, the denoising effect of the wavelet continues to improve with active research being carried out on the scaling relation in the transform domain. In general, there are two key questions associated with image denoising based on wavelet domain statistical models: (1) how to choose the prior distribution model of the wavelet coefficients and (2) how to determine the appropriate denoising algorithm with respect to the distribution model. The most important topic in wavelet denoising is the wavelet coefficients statistical model. The objective of the research being conducted in this area is to make an accurate model of the wavelet coefficients, which are non-Gaussian and related to each other. Chang et al. [7] modelled the prior
2 distribution model of the wavelet coefficients of the original image using a generalized Gaussian model and developed the Bayes-Shrink denoising algorithm. Crouse et al. [8] carried out denoising using a hidden Markov tree model, whereas Portilla et al. [9] used a Gaussian scale mixtures model. S¸endur and Selesnick [10] proposed a Bivariate model and a corresponding Bishrink algorithm that achieved good image denoising performance. Achim et al. [11] proposed an 𝛼distribution that approximates the distribution of the wavelet coefficients of SAR images. Xie et al. [12] used a finite Gaussian mixture model to approximate the distribution of wavelet coefficients. Although each of these models reflects only a portion of the feature information of the wavelet coefficients, they have contributed to improvements in the denoising of images. Sparse representation based on an overcomplete dictionary is a novel image representation theory. Various structural features of an image can be effectively captured by using the redundancy of the overcomplete dictionary, ultimately resulting in the image being effectively represented. The K-SVD algorithm [13], which adaptively updates the dictionary based on 𝐾-means clustering, has exhibited good performance in image compression and restoration. The SA-DCT approach [14] exploits a shape-adaptive transform on neighbourhoods whose shapes are adaptive to salient image details and thus predominantly contain homogeneous signals. The shape-adaptive transform can achieve a very sparse representation of the true signal in these adaptive neighbourhoods. Dabov et al. developed a block-matching 3D transformation (BM3D) iterative image reconstruction algorithm [15] that is considered one of the best image denoising algorithms in the literature. This paper combines current multiscale, multiresolution analysis to propose a novel nonsubsampled contourlet transform (NSCT) denoising scheme based on the normal inverse Gaussian (NIG) probability density function (PDF). This proposed scheme uses the NIG distribution to gain the Bayesian maximum a posteriori estimator of NSCT coefficients, which are heavy-tailed in nature. First, the parameters of the NIG model are adaptively estimated via a local window that models the intrascale dependency between coefficients. Then, optimal linear interpolation thresholding algorithm named OLI-shrink [16] is utilised. Because the NSCT is translation invariant and has sufficient redundant information, the proposed algorithm can effectively extract the image orientation information and better meet human visual requirements. Experimental results show that the proposed algorithm has better performance than other image denoising methods, including nonsubsampled contourlet transform domain denoising and BLS-GSM [9]. Even though the proposed scheme is a probability-based algorithm, it nevertheless achieves outstanding denoising performance in terms of both peak signal-to-noise ratio (PSNR) and subjective visual quality. We explore the use of the proposed scheme for image denoising and show that it achieves better results than the K-SVD algorithm [13] for all noise levels and performs better than the BM3D algorithm [15] for most noise levels.
Mathematical Problems in Engineering The remainder of this paper is organized as follows. Section 2 outlines the basic idea underlying NSCT and the basic image processing scheme. Section 3 discusses the edge coefficient of NSCT statistics modelling and imparts basic knowledge necessary to develop the proposed denoising algorithms, including NIG prior, maximum a posteriori probability, parameter estimation, and OLI-Shrink. Experimental results are presented and discussed in Section 4. Finally, concluding remarks are given in Section 5.
2. Nonsubsampled Contourlet Transform (NSCT) 2.1. Overview of NSCT. Wavelet transform is used extensively in image and voice signal processing fields because of its frequency localisation and multiscale and multiresolution properties. However, it only represents point-singularities efficiently in a one-dimensional domain and is less efficient for line-singularities and curve-singularities (edges) in a two-dimensional domain. Wavelet transform also suffers from several fundamental shortcomings, including poor directional selectivity for the anisotropy of its basis function and lack of invariance in shift and orientation [17]. Thus, wavelet transform does not possess optimal properties for two-dimensional signals such as natural images. These two drawbacks of wavelet transform limit its ability to fully capture the directional information in natural images. Consequently, many researchers have begun to focus on methods of expressing image geometry structures more effectively in order to overcome the inability of wavelet transformation to adequately represent the geometric structure information of images. These activities have led to the introduction of ridgelet transform [18], curvelet transform [19], and contourlet transform [20] for singular analysis of two-dimensional or higher images, techniques which can achieve good sparsity for spatially localised details, such as edges and singularities. Because such details are typically abundant in natural images and convey a significant portion of the information embedded therein, these transforms have become useful in image processing [21, 22]. NSCT, proposed by da Cunha et al. in 2006, outperforms the abovementioned transforms [23] in image processing. Its main properties are multiresolution, localisation, directionality, and anisotropy. The directionality property, in particular, permits NSCT to resolve intrinsic directional features that characterise the analysed image. NSCT is based on a nonsubsampled pyramid structure and nonsubsampled directional filter banks, which enables it to realise and develop a flexible, multiscale, multidirectional, and shift-invariable image decomposition that can be efficiently implemented via the a` trous algorithm. At the core of the NSCT scheme is the nonseparable, two-channel, nonsubsampled filter bank. The nonsubsampled pyramid decomposition structure is realised via a multistage iterative process. An image is decomposed into a two-dimensional, low-frequency subband and a two-dimensional, high-frequency subband using filters. The multistructure can be realised by performing iterative filtering on the low-frequency subband. Compared to the
Mathematical Problems in Engineering
3 Low frequency image
Image
Nonsubsampled pyramid filter bank (NSPFB)
Low frequency image
Bandpass image
NSPFB
High frequency directional subband images NSDFB
Bandpass image
Nonsubsampled directional filter bank (NSDFB)
High frequency directional subband images
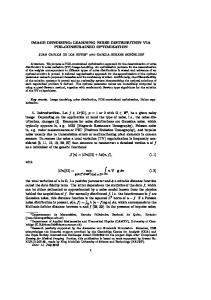
Figure 1: NSCT flow graph.
contourlet transformation, the filters of NSCT have better frequency selectivity and regularity, which can better perform subband direction decomposition. In contrast to wavelet decomposition, NSCT is a multiscale, multiresolution, and multidirectional analysis method. Because of the flexibility of the direction decomposition achievable using NSCT, more detailed information about the image can be obtained during the image decomposition process. The resulting transform not only has the multiscale and time-frequency-localisation properties of wavelets but also offers a high degree of directionality and anisotropy. Figure 1 illustrates the NSCT processing scheme [24]. 2.2. Image Denoising Method Based on NSCT. The objective of image denoising is to recover an image from its noisy version. In general, a denoising problem can be described as follows. Let 𝑋𝑖,𝑗 be the original image of size 𝐼×𝐽 and let 𝑌𝑖,𝑗 be the observation image which has been corrupted by additive white Gaussian noise 𝜀𝑖,𝑗 with zero mean and variance 𝜎2 . Let (𝑖, 𝑗) be the pixel position in the image. Then, assume that the corrupted image satisfies
(2) Determine the correct threshold value and perform threshold processing on the high-frequency coefficients in the NSCT domain to obtain the new transform coefficients, while leaving the low-frequency coefficients unchanged. The threshold processing includes soft and hard threshold processing. (3) Perform inverse NSCT on the processed highfrequency coefficients and low-frequency coefficients ̂ which is to obtain the denoised image estimation, 𝑋, the estimation of the original image, 𝑋. The key issue in threshold denoising is selection of the threshold value, which directly determines the denoising effect. A relatively small threshold value may retain the decomposition coefficients as much as possible and thus retain more detailed information about the image. However, a small threshold value may retain an undesired amount of noise in the denoised result. Conversely, a relatively large threshold value may destroy the high-frequency information of the image and produce a false Gibbs phenomenon in the denoised image.
𝑌𝑖,𝑗 = 𝑋𝑖,𝑗 + 𝜀𝑖,𝑗 , 𝑖 = 1, 2, . . . , 𝐼, 𝑗 = 1, 2, . . . , 𝐽, 𝜀𝑖,𝑗 ∼ 𝑁 (0, 𝜎2 ) .
(1)
The goal of denoising is to construct the optimal approximation of 𝑋𝑖,𝑗 using the observation data 𝑌𝑖,𝑗 to minimize the mean square error (MSE) between the optimal approximâ𝑖,𝑗 and the original signal 𝑋𝑖,𝑗 : tion 𝑋 MSE =
1 ̂ 2 1 𝐼 𝐽 ̂𝑖,𝑗 − 𝑋𝑖,𝑗 )2 , 𝐸 𝑋 − 𝑋 = ∑ ∑ 𝐸 (𝑋 𝑁 𝑁 𝑖=1 𝑗=1
(2)
𝑁 = 𝐼 × 𝐽. The basic steps in the threshold denoising algorithm are as follows: (1) Determine the decomposition level, 𝐾, of NSCT and perform NSCT on the noisy image, 𝑌, to obtain the high and low-frequency coefficients of the decomposition.
3. Marginal Statistical Modelling on the NSCT Subband Coefficients 3.1. Normal Inverse Gaussian Distribution. The important features of the image statistics in the NSCT domain is that they are non-Gaussian, have a high kurtosis, sharp central peak, and heavy tails. These features are expected because images often primarily comprise homogeneous regions with some important details such as edges; the homogeneous regions provide coefficients that are close to zero, and the edges provide a small number of coefficients with large magnitudes. The NIG model developed by Barndorff-Nielsen [25] is a normal variance-mean mixture distribution, in which the inverse Gaussian PDF is used as the mixing distribution. In theory, the hybrid model can overcome the disadvantages of the traditional model, which cannot meet the needs of modelling. Because of the flexibility with which parameters can be selected, the hybrid model can describe curves of any shape. Consequently, we chose the NIG model
4
Mathematical Problems in Engineering
to describe the distribution of the NSCT coefficients of an image. The probability density function can be defined as
0.14 0.12
𝛼𝛿 ⋅ exp [𝑝 (𝑥)] ⋅ 𝐾1 [𝛼𝑞 (𝑥)] , 𝑓𝑥 (𝑥) = 𝜋𝑞 (𝑥)
(3)
where 𝑝(𝑥) = 𝛿√𝛼2 − 𝛽2 + 𝛽(𝑥 − 𝜇), 𝑞(𝑥) = √𝛿2 + (𝑥2 − 𝜇2 ), and 𝐾1 (⋅) denotes a modified Bessel function of the second kind with index one. As can be seen, the distribution of NIG is specified by the four parameters (𝛼, 𝛽, 𝜇, 𝛿). The flexibility of the values of the four parameters makes the NIG density a suitable model for a variety of unimodal, positive, kurtotic data. Parameter 𝛼 is the feature factor which controls the steepness of the density; a smaller value for 𝛼 indicates a slower decay rate with heavier tails. Parameter 𝛽 controls skewness: for 𝛽 < 0, the density is skewed to the left; for 𝛽 > 0, the density is skewed to the right; and 𝛽 = 0 implies a symmetric density around 𝜇, which is a translation parameter. The 𝛿 parameter is scale-like. For most images, the corresponding decomposition coefficients are generally symmetrical distributions; thus, 𝛽 = 𝜇 = 0 is assumed to correspond to NIG. Consequently, the probability density function corresponding to NIG can be simplified as follows: 2 2 𝛼𝛿 exp (𝛼𝛿) 𝐾1 (𝛼√𝑥 + 𝛿 ) . 𝑓𝑥 (𝑥) = √𝑥2 + 𝛿2 𝜋
(4)
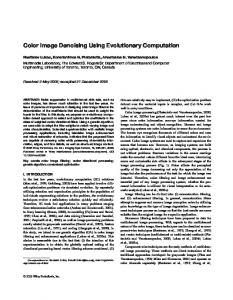
3.2. Marginal Distribution of the NSCT Coefficients. In recent years, the Bayes denoising algorithm, which is based on a coefficient’s statistical model in the transform domain, has become a hot topic in the field of image denoising. By establishing a reasonable prior probability distribution model for the edge of the coefficients, it estimates the original image using Bayesian theory and balances suppression of noise and retention of signals better than other denoising algorithms. Bayes’ algorithm is more flexible than conventional threshold algorithms. Its key to success is to accurately model the prior marginal distribution of coefficients firstly. The main area of research in this case is the marginal distribution statistical models of image NSCT coefficients. For flexible selection of model parameters, the NIG distribution can accurately model the data with different tails [26]. This paper uses the NIG distribution to fit the marginal statistical distribution of the NSCT coefficients. Because an image typically comprises a smooth area and details such as edges, decomposition coefficients corresponding to smooth regions are, for the most part, close to zero. Only some edges correspond to the high-magnitude transform coefficient. Thus, in the NSCT domain, the image decomposition coefficients show highly non-Gaussian features such as high kurtosis, sharp central peaks, and heavy tails. We used an image of Barbara, which includes texture and structure, to test how well the NIG distribution fits the NSCT coefficients. Figure 2 shows the results obtained. The histogram distribution (solid line) of the third layer subband of NSCT coefficients in the first direction is shown in the figure, with the NIG PDF (dashed line) and Gaussian PDF
0.1 0.08 0.06 0.04 0.02 0 −40
−30
−20
−10
0
10
20
30
40
Coefficient’s histogram NIG PDF Gaussian PDF
Figure 2: Probability density of the NSCT coefficients in a specific subband of a 512 × 512 pixel Barbara image and the NIG PDF and Gaussian PDF fitted to this density.
(dotted line) fitted to this density. As shown in the figure, the NIG PDF can accurately model the coefficient distribution, especially the heavy tail. The distribution demonstrates a sharp peak near to zero and long tails to both sides of the peak, which more closely fit the coefficient’s histogram. It also fits the degree of the distribution of the coefficients on the other subbands well. Similar statistical characteristics of the histograms of other test images still hold. 3.3. Bayesian Estimation. Assume that an original image 𝑋 has been corrupted by additive white Gaussian noise: 𝑌 = 𝑋 + 𝑁,
(5)
where 𝑌 denotes the observed noisy image and 𝑁 denotes the white Gaussian noise. Given 𝑌, denoising attempts to return 𝑋 as accurately as possible. After NSCT transformation of the observed image, the transformed decomposition coefficients are 𝑦 = 𝑥 + 𝑛,
(6)
where 𝑦, 𝑥, and 𝑛 denote NSCT coefficients of the noisy image, noise-free original image, and noise, respectively. The ̂ purpose of Bayesian denoising is to obtain 𝑥(𝑦), which is the estimation of 𝑥. Bayesian maximum a posteriori estimation can be denoted as follows: 𝑥̂ (𝑦) = arg max {𝑓𝑥|𝑦 (𝑥 | 𝑦)} , 𝑥
(7)
where 𝑓𝑥|𝑦 (𝑥 | 𝑦) is the conditional density of the observation 𝑦 given 𝑥.
Mathematical Problems in Engineering
5
̂ can be calculated using the Bayesian rule: 𝑥(𝑦) 𝑥̂ (𝑦) = arg max {𝑓𝑥|𝑦 (𝑥 | 𝑦)} 𝑥
= arg max {𝑓𝑦|𝑥 (𝑦 | 𝑥) ⋅ 𝑓𝑥 (𝑥)} 𝑥
(8)
= arg max {𝑓𝑛 (𝑦 − 𝑥) ⋅ 𝑓𝑥 (𝑥)} . 𝑥
These equations allow us to write this estimation in terms of 𝑓𝑛 (⋅) and 𝑓𝑥 (⋅), which are the probability distribution of noise coefficients and the prior distribution of the noise-free image coefficients, respectively. From the assumption on the noise, 𝑓𝑛 (⋅) is a zero-mean Gaussian function with variance 𝜎𝑛2 ; that is, 𝑛2 1 ⋅ exp (− 2 ) . 𝑓𝑛 (𝑛) = √2𝜋𝜎𝑛 2𝜎𝑛
(9)
Solving (8) by using (9) and performing a logarithm on the independent variable, (8) can be written as 2
(𝑦 − 𝑥) + 𝜁 (𝑥)] , 𝑥̂ (𝑦) = arg max [− 2𝜎𝑛2 𝑥
(10)
where 𝜁(𝑥) = ln 𝑓𝑥 (𝑥) is a convex, differentiable function. Let ̂ the first derivative of −(𝑦 − 𝑥)2 /2𝜎𝑛2 + 𝜁(𝑥) be zero. Then, 𝑥(𝑦) can be computed to obtain the maximum a posteriori; thus 𝑦 − 𝑥̂ ̂ = 0. + 𝜁 (𝑥) 𝜎𝑛2
(12)
where √𝛿2 + 𝑦2 ) (𝛼 𝐾 2𝑦 0 𝛼𝑦 . 𝐵 = 2 + ⋅ 𝛿 + 𝑦2 √𝛿2 + 𝑦2 𝐾 (𝛼√𝛿2 + 𝑦2 ) 1
𝛿 = √𝜉 ⋅ ̂𝑘2 (1 − 𝜌2 ), 𝛼=
(13)
Parameters 𝛼 and 𝛿 are estimated from every subband. As a result, (12) is adaptive to every subband and can remove noise from all the subbands adaptively. Equation (12) is also similar to the classical soft threshold function. The threshold value is 𝜎𝑛2 𝐵 and can be changed depending on the values of the coefficients. The noise-based coefficient is greater with larger threshold values. Conversely, the signal-based coefficient is larger with smaller threshold values. 3.4. Parameter Estimation. Image denoising via (12) needs to estimate the NIG distribution parameters 𝛼 and 𝛿 and the noise variance 𝜎𝑛2 . The parameters used in the experiments
𝜉 (𝛿√1 − 𝜌2 )
(14)
,
where 𝜉 = 3 ⋅ (𝛾4 − 4𝛾32 /3)−1 and 𝜌 = 𝛾3 √𝜉/3. 3.5. Thresholding Algorithm. Denoising by wavelet is performed by the thresholding algorithm, in which coefficients smaller than a specific value, or threshold, are cancelled. It can also be utilised in other transform domains, such as the NSCT domain. Hard and soft thresholding are two popular methods. In hard thresholding algorithms, any coefficient, 𝑦, less than or equal to the threshold, 𝜆, is replaced with zero. That is, {0, 𝛿𝜆𝐻 (𝑦) = { 𝑦, {
(11)
Because 𝜁 (𝑥) is discontinuous and singular in the vicinity ̂ is different from 𝑦, (11) cannot of zero and the symbol of 𝑥(𝑦) be solved in closed form. Bhuiyan et al. [27] developed an estimated solution that overcomes this drawback. It is defined as 𝑥̂ (𝑦) = sign (𝑦) ⋅ max (𝑦 − 𝜎𝑛2 𝐵, 0) ,
can be estimated according to the actual distribution of different subband coefficients. For different noise levels, these parameters can be used to obtain different degrees of threshold processing given different decomposition coefficients. Let ̂𝑘1 , ̂𝑘2 , ̂𝑘3 , and ̂𝑘4 denote the one to four-order cumulants of the noisy coefficients, respectively. Thence, the skewness and kurtosis of the coefficients of the clear image are 3/2 2 𝛾3 = ̂𝑘3 /(̂𝑘2 ) and 𝛾4 = ̂𝑘4 /(̂𝑘2 ) , respectively. At this time, the parameters 𝛼 and 𝛿 can be estimated using the following two equations:
𝑦 ≤ 𝜆 𝑦 > 𝜆.
(15)
In soft thresholding algorithms, however, any coefficient, 𝑦, less than the threshold 𝜆 is replaced with zero, and the others are modified by subtracting the threshold value 𝜆 in accordance with the following equation: 𝛿𝜆𝑆
{0, (𝑦) = { sign (𝑦) (𝑦 − 𝜆) , {
𝑦 ≤ 𝜆 𝑦 > 𝜆.
(16)
Soft thresholding is more efficient and yields more visually pleasing images than hard thresholding, but soft thresholding does not use the optimal value for modification of large coefficients. In order to overcome this limitation, Fathi and Naghsh-Nilchi [16] developed a new thresholding algorithm (OLI-Shrink) which uses optimal linear interpolation between each coefficient and its corresponding subband mean to modify dominant coefficients: 𝛿𝜆OLI
{0, (𝑦) = { 𝑦 − 𝜂 (𝑦 − 𝜇) , {
𝑦 ≤ 𝜆 𝑦 > 𝜆,
(17)
where 𝜇 is the mean value of the coefficient of the corresponding subband, 𝜆 = 𝜎2 𝐵 as in (12), and 𝜂 is computed as follows: 𝜂=
𝜎𝑛2 𝜎𝑛2 ≅ . 𝜎𝑥2 + 𝜎𝑛2 𝜎𝑦2
(18)
6
Mathematical Problems in Engineering
Here, the true value 𝑥 is estimated by a weighted linear interpolation of the unconditional mean of 𝑥 and the observed value 𝑦. Even if this formula is derived on the assumption that the transform domain coefficients in a subband of a natural image have Gaussian PDFs, it can still function efficiently. 3.6. Monte-Carlo Estimates of NSCT Domain Noise Coefficient Variance. The nonorthogonal nature of NSCT may lead to different noise variances in different directional subbands. Thus, the Monte-Carlo method is used to obtain the noise coefficient variance 𝜎𝑛2 (𝑘) of NSCT, which corresponds to each subband at each scale. In some image denoising applications, the value of the input noise variance is known or can be measured based on information other than the corrupted image. In other cases, we can estimate the noise variance by applying the robust median estimator on the HH1 subband’s HH1 ), as outlined by Donoho [3]: coefficients (𝑌𝑖,𝑗 𝜎̂𝑛 =
HH1 ) median (𝑌𝑖,𝑗 0.6745
.
(19)
The specific steps are as follows. Step 1. Perform orthogonal wavelet transform on the noisy image and estimate the noise standard deviation, 𝜎̂𝑛 , using (19). Step 2. Construct a white Gaussian noise image the same size as the original image with mean zero and variance 𝜎̂𝑛2 . Step 3. Perform NSCT transformation on the noise image and obtain the noise NSCT coefficients variance 𝜎̂𝑛2 (𝑘) in each high-frequency subband. Step 4. Go to Step 2 and repeat the above steps five times. The final coefficient variance, 𝜎𝑛2 (𝑘), is obtained by averaging the coefficient variances obtained. 3.7. Detailed Implementation. In summary, we apply the NIG model as a prior model of NSCT coefficients to estimate denoised NSCT coefficients and employ OLI-Shrink to guarantee a more gently thresholded effect. The proposed method can be summarized as follows. Step 1. Perform NSCT decomposition to obtain a series of NSCT coefficients, 𝑦. Step 2. Estimate the noise variance in each high-frequency subband using the method outlined in Section 3.6. Step 3. For each subband in each level higher than two, compute the threshold value and statistical parameters: (a) the terms 𝛿 and 𝛼 using (14); (b) the threshold value 𝜆 = 𝜎𝑛2 𝐵 using (13), where the 𝜎𝑛2 used here is equal to 𝜎𝑛2 (𝑘) in corresponding subbands; (c) the subband’s variance (𝜎𝑦2 );
(d) the subband’s mean (𝜇); (e) the term 𝜂 using (18). Step 4. Threshold the coefficients of all subbands using (17); Step 5. Perform inverse NSCT to reconstruct the denoised image.
4. Experimental Results To investigate the feasibility and the effectiveness of the proposed image denoising method in removing additive Gaussian white noise, we first conducted experiments on the grayscale images Lena and Barbara, each measuring 512×512 pixels. The images were obtained from http://www.cs.tut.fi/ ∼foi/GCF-BM3D, and we verified that they were the same as the images used by Dabov et al. [15]. Using these images, we redid Dabov et al.’s entire denoising experiment. The original images were corrupted with zero mean and Gaussian white noise, with the standard deviation, 𝜎, of the noise varying over the range 5 to 100. For comparison, we also applied several existing methods to denoise the same images. BivShrink [10] was implemented using software obtained from http://eeweb .poly.edu/iselesni/WaveletSoftware/denoise2.html, which describes the implementation of this algorithm using both the separable DWT and the complex dual-tree DWT. We chose the complex dual-tree DWT method because it gives better denoised results. The BLS-GSM denoising method [9] was implemented using software obtained from http://decsai.ugr .es/∼javier/denoise/index.html. The SA-DCT denoising method [14] was implemented using software obtained from http://www.cs.tut.fi/∼foi/SA-DCT. The K-SVD [13] denoising method was implemented using software obtained from http://www.cs.technion.ac.il/∼elad/software/, and the image reconstruction algorithm [15] based on block matching and 3D filtering was implemented using software obtained from http://www.cs.tut.fi/∼foi/GCF-BM3D. Ram et al. [28] recently proposed an image processing scheme based on reordering of patches. They applied their proposed approach to image denoising and showed that it generally performs better than the BM3D algorithm for high noise levels. Thus, we implemented this denoising method using software obtained from http://www.cs.technion.ac.il/∼elad/software/. The decomposition level of the proposed method was set at five and the decomposed direction from coarse scale to fine scale ranged over the values 4, 8, 8, 16, and 16. The local window size was 11 × 11 when estimating local parameters. The quantitative analysis results obtained are listed in Table 1. Each denoising method outlined above was quantitatively measured in terms of peak signal-to-noise ratio (PSNR). The details of the denoised images are given in Figures 3 and 5 to help the reader observe the qualitative differences between the different methods. As shown in Table 1, the proposed method achieved the best results among all the denoising methods, except for some of the results from BM3D and Ram’s method, with an average increase in PSNR of approximately 0.29 dB compared to Ram’s method and 0.17 dB compared to BM3D. In particular, when compared with denoised results obtained by K-SVD
Mathematical Problems in Engineering
7
Table 1: Denoising results (PSNR in dB) of the various denoising methods with different noise standard deviations, 𝜎. The best result for each image and setting is displayed in boldface. Image
Method
Lena
Barbara
BivShrink BLS-GSM SA-DCT K-SVD Ram’s BM3D Proposed BivShrink BLS-GSM SA-DCT K-SVD Ram’s BM3D Proposed
5/34.16 38.05 38.56 38.54 38.61 38.33 38.72 39.13 36.74 37.85 37.49 38.10 37.75 38.31 38.36
10/28.14 35.32 35.68 35.58 35.51 35.39 35.93 36.18 33.38 34.10 33.50 34.45 34.41 34.98 34.82
15/24.61 33.59 33.96 33.87 33.71 33.81 34.27 34.52 31.27 31.93 31.39 32.42 32.70 33.11 32.84
𝜎/PSNR 20/22.11 25/20.18 32.33 31.36 32.72 31.75 32.63 31.66 32.40 31.37 32.68 31.78 33.05 32.08 33.32 32.37 29.75 28.61 30.38 29.19 30.00 28.95 30.85 29.57 31.50 30.54 31.78 30.72 31.45 30.38
50/14.16 28.24 28.69 28.60 27.85 29.01 28.86 29.37 25.23 25.50 25.43 25.48 27.39 27.17 27.10
75/10.63 26.44 26.96 26.76 25.82 27.24 27.02 27.57 23.53 23.67 23.52 22.97 25.54 25.10 25.26
100/8.14 25.21 25.83 25.51 24.55 26.00 25.57 26.26 22.48 22.65 22.49 21.87 24.24 23.49 24.01
Bold number indicates best performing method in separate column.
(a) Noise-free image
(b) BivShrink
(c) BLS-GSM
(d) SA-DCT
(e) K-SVD
(f) Ram’s
(g) BM3D
(h) Proposed
Figure 3: Fragments of noisy (𝜎 = 25, PSNR = 20.18 dB) Barbara image and corresponding estimates with different methods.
method, the average PSNR increase for the proposed method was 1.09 dB. For image Barbara, Ram’s method actually performed better than the BM3D algorithm for high noise levels. Ram’s method also had a higher PSNR value than BM3D for the Lena image at high noise levels, but it was inferior to our proposed method for all noise levels. The denoising performance of our proposed algorithm is illustrated in Figure 3, which depicts fragments of a few noisy (𝜎 = 25) modifications of the original Barbara image and fragments of various image denoising results.
In Figure 3, it can be seen that our proposed method exhibits outstanding performance which is superior to the other methods, especially in terms of retaining the image details, such as the small stripes in the tablecloth. BM3D and the proposed method produce fewer artefacts and better preserve the edges and other details than the other methods. The homogeneous region is smoother and the texture line on the tablecloth and trousers is clearer than the results from the other methods. The denoised images in Figures 3(g) and 3(h) are relatively mild, have fewer scratch effects,
8
Mathematical Problems in Engineering 1
0.8 0.6
0.5
0.4 0 Difference (dB)
Difference (dB)
0.2 0 −0.2 −0.4 −0.6
−1 −1.5
−0.8
−2
−1 −1.2
−0.5
0
10
20
30
40
50
60
70
80
90
100
Standard deviation 𝜎 of the noise BivShrink BLS-GSM SA-DCT K-SVD
BM3D Ram’s Proposed
(a) Lena denoised results
−2.5
0
10
20
30 40 50 60 70 80 Standard deviation 𝜎 of the noise
BivShrink BLS-GSM SA-DCT K-SVD
90
100
BM3D Ram’s Proposed
(b) Barbara denoised results
Figure 4: Performance gain in terms of PSNR values attained by various schemes versus the proposed scheme.
show most of the texture features clearly, and retain their original geometric features, such as the clear checkerboard tablecloth pattern. The resulting image following denoising by BLS-GSM (Figure 3(c)) appears to have better overall effects; however, close inspection shows that the image has been smoothed too much and, as a consequence, has lost much detailed information, information which is very important in image denoising. Figures 3(d) and 3(e), obtained from SA-DCT and K-SVD, have excessive smoothing and insufficient contrast, and some small details are missing. Ram’s method appears to be efficient in homogeneous regions but is less effective in the detailed regions. The evaluation values in Table 1 show that the methods applied to produce Figures 3(b)–3(f) are significantly worse than BM3D and the proposed method. In conclusion, it is clear that our denoised method exhibits outstanding performance and preserves detailed information, especially texture information. In order to better understand the numerical results, we further compared the gain of BivShrink, BLS-GSM, SADCT, K-SVD, Ram’s method, and the proposed method, normalised with respect to BM3D, as shown in Figure 4. In the figure, the superiority of the proposed method is clear. In the case of image Lena, the proposed method outperforms the other methods and provides significant improvements over BM3D. Compared with BM3D, the performance of Ram’s method is slightly inferior when the standard deviation is small. BLS-GSM and SA-DCT have similar results, which are better than that of BivShrink. The performance of the proposed method is as expected. Image Barbara comprises similar image textures and can therefore provide more information to BM3D and Ram’s method to train their datasets. As a result, their output is a bit better than that of the proposed method at the start (Figure 4(b)).
BM3D is based on block structure [29], which tends to oversmooth edge pixels after denoising. As a result, its reconstructed image shows obvious blocking artefacts under certain conditions, especially when the noise variance is relatively large. Figures 5(a) and 5(b) show fragments of the reconstructed Barbara images obtained using BM3D and the proposed scheme, respectively. When the noise standard deviation is 50 for the Barbara image, the denoised results with BM3D and the proposed scheme have virtually the same PSNR value. However, it is clear that the stripe information in Figure 5(a) has essentially been replaced by smooth areas, whereas the stripe is still clearly visible in Figure 5(b). From the above results, it is clear that the more competitive denoising methods are Ram’s method, BM3D, and the proposed method. To provide a more thorough comparison of these three methods, we assessed their performance on a test set containing noisy versions of seven images with eight different noise levels. For the proposed method, four-level decomposition and the decomposed direction from coarse scale to fine scale were 4, 8, 16, and 16 for the images House and Peppers, with sizes 256 × 256 pixels. The PSNR values for the results obtained using the three schemes are listed in Table 2. The results obtained by our scheme are inferior to those of Ram’s method for the images House, Peppers, and Montage in most cases. The PSNR values for the images Fingerprint, Man, and Couple are significantly better than those obtained by BM3D and Ram’s method. Our method performed as expected for Boats and Hill, providing the highest PSNR values. Further, our results are better than those achieved by Ram’s algorithm by approximately 0.31 dB on average for the entire number lists belonging to Ram’s algorithm and our scheme, respectively, in Table 2. Further, our scheme
Mathematical Problems in Engineering
9
Table 2: Denoising results (PSNR in dB) for noisy versions of seven images, obtained with BM3D, Ram’s method, and the proposed scheme. The best result for each image and noise level is displayed in boldface. Image
Method
Boats
Fingerprint
Man
Couple
Hill
House
Peppers
Ram’s BM3D Proposed Ram’s BM3D Proposed Ram’s BM3D Proposed Ram’s BM3D Proposed Ram’s BM3D Proposed Ram’s BM3D Proposed Ram’s BM3D Proposed
5/34.16 37.07 37.28 37.50 36.17 36.51 36.36 37.38 37.82 37.78 37.12 37.52 37.36 36.92 37.14 37.31 38.76 39.83 39.44 37.62 38.12 37.64
10/28.14 33.68 33.92 34.07 32.00 32.46 32.62 33.67 33.98 34.17 33.60 34.04 33.80 33.48 33.62 33.93 35.82 36.71 36.13 34.22 34.68 34.12
15/24.61 31.91 32.14 32.25 29.83 30.28 30.58 31.77 31.93 32.29 31.74 32.11 31.90 31.77 31.86 32.21 34.38 34.94 34.27 32.33 32.70 32.18
𝜎/PSNR 20/22.11 25/20.18 30.69 29.72 30.88 29.91 31.00 30.05 28.37 27.33 28.81 27.70 29.16 28.10 30.48 29.55 30.59 29.62 31.04 30.11 30.46 29.42 30.76 29.72 30.62 29.66 30.64 29.76 30.72 29.85 31.07 30.22 33.33 32.55 33.77 32.86 32.98 32.00 31.02 29.92 31.29 30.16 30.83 29.80
50/14.16 26.72 26.64 27.23 24.10 24.36 24.91 26.74 26.59 27.42 26.39 26.38 26.83 27.17 27.08 27.72 29.77 29.37 28.88 26.72 26.41 26.65
75/10.63 25.03 24.96 25.67 22.44 22.68 23.12 25.17 25.10 25.90 24.69 24.63 25.27 25.61 25.58 26.31 27.68 27.20 27.00 24.75 24.48 24.81
100/8.14 23.92 23.74 24.57 21.46 21.33 21.87 24.15 23.97 24.82 23.50 23.37 24.19 24.58 24.45 25.29 26.20 25.50 25.64 23.32 22.91 23.51
Bold number indicates best performing method in separate column.
(a) BM3D, PSNR = 27.17 dB
(b) Proposed, PSNR = 27.10 dB
Figure 5: Fragments of the grayscale Barbara image denoised by BM3D and our proposed algorithm for noise with 𝜎 = 50.
outperforms BM3D by more than 0.85 dB (Man, 𝜎 = 100) and 0.16 dB on average for all results obtained by the BM3D method as listed in Table 2. In order to facilitate a more comprehensive comparison, the noisy and denoised images obtained with our proposed scheme for 𝜎 = 25 are shown in Figures 6 and 7. An image has a specific structure and its pixels have strong affiliations. These affiliations reflect the configuration
information in the visual scene. In order to better reflect the structural similarity between two images, Wang et al. [30] developed an image quality assessment method based on structural distortion called the structural similarity (SSIM) index. There are also several similar structural information based image quality metrics (IQMs), including lowlevel feature similarity induced full reference image quality assessment metric, namely FSIM [31] and sparse feature
10
Mathematical Problems in Engineering
Lena
Barbara
Boats
House
PSNR = 29.72 dB
PSNR = 32.55 dB
PSNR = 29.91 dB
PSNR = 32.86 dB
PSNR = 30.05 dB
PSNR = 32.00 dB
(a)
PSNR = 31.78 dB
PSNR = 30.54 dB (b)
PSNR = 32.08 dB
PSNR = 30.72 dB (c)
PSNR = 32.37 dB
PSNR = 30.38 dB (d)
Figure 6: Denoising results (PSNR) for the images Lena, Barbara, Boat, and House (𝜎 = 25, PSNR = 20.18 dB): (a) noisy images; (b) Ram’s results; (c) BM3D results; and (d) our proposed scheme’s results (PSNR scores are given below each image).
fidelity (SFF) [32]. The closer the IQMs are to one, the higher the structural similarity between the two images is. In image denoising, the IQMs indicate the ability of the denoising algorithm to maintain the image structure. Table 3 shows the SSIM, FSIM, and SFF index values for image
Barbara following denoised processing by BM3D and the proposed method. The average PSNR value for the proposed method is smaller than that of BM3D for image Barbara by approximately 0.06 dB in Table 1. However, as the SSIM index listed in Table 3 shows, the denoising results for the proposed
Mathematical Problems in Engineering
Fingerprint
Man
11
Couple
Hill
Peppers
PSNR = 29.76 dB
PSNR = 29.92 dB
PSNR = 29.85 dB
PSNR = 30.16 dB
PSNR = 30.22 dB
PSNR = 29.80 dB
(a)
PSNR = 27.33 dB
PSNR = 29.55 dB
PSNR = 29.42 dB (b)
PSNR = 27.70 dB
PSNR = 29.62 dB
PSNR = 29.72 dB (c)
PSNR = 28.10 dB
PSNR = 30.11 dB
PSNR = 29.66 dB (d)
Figure 7: Fragments of noisy (𝜎 = 25, PSNR = 20.18 dB) grayscale images and their corresponding estimates: (a) noisy images; (b) Ram’s results; (c) BM3D results; and (d) our proposed scheme’s results (PSNR scores are given below each image).
12
Mathematical Problems in Engineering Table 3: Image quality metrics for image Barbara following denoising by BM3D and the proposed method. 𝜎
2
5
10
15
20
25
30
35
50
75
100
Average
BM3D SSIM Proposed
0.9970 0.9971
0.9891 0.9899
0.9767 0.9771
0.9650 0.9644
0.9530 0.9517
0.9406 0.9391
0.9272 0.9264
0.9123 0.9140
0.8706 0.8773
0.8013 0.8204
0.7364 0.7695
0.9154 0.9206
FSIM
BM3D Proposed
0.9983 0.9983
0.9932 0.9932
0.9840 0.9836
0.9757 0.9741
0.9676 0.9652
0.9600 0.9569
0.9526 0.9491
0.9446 0.9418
0.9244 0.9217
0.8917 0.8933
0.8618 0.8697
0.9504 0.9497
SSF
BM3D Proposed
0.9997 0.9997
0.9987 0.9988
0.9965 0.9966
0.9943 0.9943
0.9921 0.9920
0.9899 0.9896
0.9876 0.9874
0.9851 0.9852
0.9787 0.9786
0.9675 0.9678
0.9553 0.9569
0.9859 0.9861
Bold number indicates best performing method in separate column for each image quality metrics.
method are superior to those for BM3D in maintaining the original image structure when the value of 𝜎 is below 15 or above 30, and it outperforms the average for 𝜎 in the range 2– 100. For FSIM and SFF index, familiar results can be given in Table 3. Sometimes they are equal to each other; sometimes they alternately outperform the other side.
5. Conclusion In this paper, we proposed a new image processing method based on the Bayesian framework that uses the key facets of the Bayesian denoising method to correctly estimate the distribution model of the decomposition coefficients. The proposed method comprises a nonsubsampled contourlet transform denoising algorithm based on the normal inverse Gaussian prior model, which has parameters that can be selected flexibly and changed adaptively. The model can accurately describe the sharp peak of the NSCT decomposition coefficients at zero and heavy-tailed characteristics distributed on both sides symmetrically; consequently, Bayesian denoising can be used to effectively remove noise from images. The results of experiments conducted indicate that the proposed method can effectively eliminate Gaussian white noise. Further, visual and quantitative evaluations show that it performs significantly better than existing state-of-theart image denoising methods. The NSCT’s high redundancy consequentially leads to an overloading computational cost of proposed method, and this high computational cost may limit proposed method’s real time application in practice. Even if quantitative comparison of various denoising methods’ computation efficiency is not our study emphasis, how to reduce the complexity of the algorithm and improve the operational efficiency becomes the next focus of the study. In future, we will try to transplant proposed method on other programming platforms such as C++ and adopt parallel compiling technique to improve running efficiency. This proposed method also can be naturally extended in other image processing fields, such as image impainting, image restoration, and image fusion.
Conflict of Interests The authors declare that there is no conflict of interests regarding the publication of this paper.
Acknowledgments This research was supported by the National Natural Science Foundation of China (no. 61379010), National Natural Science Foundation of China (no. 61502219), and Postdoctoral Science Foundation of China (no. 2015M582697). The authors would like to thank the editor and the anonymous reviewers for their valuable and insightful comments on this paper.
References [1] P. Qiu and P. S. Mukherjee, “Edge structure preserving image denoising,” Signal Processing, vol. 90, no. 10, pp. 2851–2862, 2010. [2] S. Mallat, A Wavelet Tour of Signal Processing, Academic Press, Amsterdam, The Netherlands, 3rd edition, 2009. [3] D. L. Donoho, “De-noising by soft-thresholding,” IEEE Transactions on Information Theory, vol. 41, no. 3, pp. 613–627, 1995. [4] F. Abramovich, T. Sapatinas, and B. W. Silverman, “Wavelet thresholding via a Bayesian approach,” Journal of the Royal Statistical Society. Series B. Statistical Methodology, vol. 60, no. 4, pp. 725–749, 1998. [5] A. Piˇzurica, W. Philips, I. Lemahieu, and M. Acheroy, “A joint inter- and intrascale statistical model for Bayesian wavelet based image denoising,” IEEE Transactions on Image Processing, vol. 11, no. 5, pp. 545–557, 2002. [6] S. Tan, L. Jiao, and I. A. Kakadiaris, “Wavelet-based Bayesian image estimation: from marginal and bivariate prior models to multivariate prior models,” IEEE Transactions on Image Processing, vol. 17, no. 4, pp. 469–481, 2008. [7] S. G. Chang, B. Yu, and M. Vetterli, “Adaptive wavelet thresholding for image denoising and compression,” IEEE Transactions on Image Processing, vol. 9, no. 9, pp. 1532–1546, 2000. [8] M. S. Crouse, R. D. Nowak, and R. G. Baraniuk, “Wavelet-based statistical signal processing using hidden Markov models,” IEEE Transactions on Signal Processing, vol. 46, no. 4, pp. 886–902, 1998. [9] J. Portilla, V. Strela, M. J. Wainwright, and E. P. Simoncelli, “Image denoising using scale mixtures of Gaussians in the wavelet domain,” IEEE Transactions on Image Processing, vol. 12, no. 11, pp. 1338–1351, 2003. [10] L. S¸endur and I. W. Selesnick, “Bivariate shrinkage functions for wavelet-based denoising exploiting interscale dependency,” IEEE Transactions on Signal Processing, vol. 50, no. 11, pp. 2744– 2756, 2002.
Mathematical Problems in Engineering [11] A. Achim, P. Tsakalides, and A. Bezerianos, “SAR image denoising via Bayesian wavelet shrinkage based on heavytailed modeling,” IEEE Transactions on Geoscience and Remote Sensing, vol. 41, no. 8, pp. 1773–1784, 2003. [12] H. Xie, L. E. Pierce, and F. T. Ulaby, “SAR speckle reduction using wavelet denoising and Markov random field modeling,” IEEE Transactions on Geoscience and Remote Sensing, vol. 40, no. 10, pp. 2196–2212, 2002. [13] M. Elad and M. Aharon, “Image denoising via sparse and redundant representations over learned dictionaries,” IEEE Transactions on Image Processing, vol. 15, no. 12, pp. 3736–3745, 2006. [14] A. Foi, V. Katkovnik, and K. Egiazarian, “Pointwise shapeadaptive DCT for high-quality denoising and deblocking of grayscale and color images,” IEEE Transactions on Image Processing, vol. 16, no. 5, pp. 1395–1411, 2007. [15] K. Dabov, A. Foi, V. Katkovnik, and K. Egiazarian, “Image denoising by sparse 3-D transform-domain collaborative filtering,” IEEE Transactions on Image Processing, vol. 16, no. 8, pp. 2080–2095, 2007. [16] A. Fathi and A. R. Naghsh-Nilchi, “Efficient image denoising method based on a new adaptive wavelet packet thresholding function,” IEEE Transactions on Image Processing, vol. 21, no. 9, pp. 3981–3990, 2012. [17] I. W. Selesnick, R. G. Baraniuk, and N. Kingsbury, “The dualtree complex wavelet transforms—a coherent framework for multiscale signal and image processing,” IEEE Signal Processing Magazine, vol. 22, no. 6, pp. 123–151, 2005. [18] M. N. Do and M. Vetterli, “The finite ridgelet transform for image representation,” IEEE Transactions on Image Processing, vol. 12, no. 1, pp. 16–28, 2003. [19] J.-L. Starck, E. J. Cand`es, and D. L. Donoho, “The curvelet transform for image denoising,” IEEE Transactions on Image Processing, vol. 11, no. 6, pp. 670–684, 2002. [20] M. N. Do and M. Vetterli, “The contourlet transform: an efficient directional multiresolution image representation,” IEEE Transactions on Image Processing, vol. 14, no. 12, pp. 2091–2106, 2005. [21] M. Dong, J. Zhang, and Y. Ma, “Image denoising via bivariate shrinkage function based on a new structure of dual contourlet transform,” Signal Processing, vol. 109, pp. 25–37, 2015. [22] H. Zhong, K. Ma, and Y. Zhou, “Modified BM3D algorithm for image denoising using nonlocal centralization prior,” Signal Processing, vol. 106, pp. 342–347, 2015. [23] A. L. da Cunha, J. Zhou, and M. N. Do, “The nonsubsampled contourlet transform: theory, design, and applications,” IEEE Transactions on Image Processing, vol. 15, no. 10, pp. 3089–3101, 2006. [24] K. Zhang, Y. H. Sheng, and H. Y. Lv, “Stereo matching cost computation based on nonsubsampled contourlet transform,” Journal of Visual Communication and Image Representation, vol. 26, pp. 275–283, 2015. [25] O. E. Barndorff-Nielsen, “Normal inverse Gaussian distributions and stochastic volatility modelling,” Scandinavian Journal of Statistics, vol. 24, no. 1, pp. 1–13, 1997. [26] X. Zhang and X. L. Jing, “Image denoising in contourlet domain based on a normal inverse Gaussian prior,” Digital Signal Processing, vol. 20, no. 5, pp. 1439–1446, 2010. [27] M. I. H. Bhuiyan, M. O. Ahmad, and M. N. S. Swamy, “Waveletbased despeckling of medical ultrasound images with the symmetric normal inverse Gaussian prior,” in Proceedings of
13
[28]
[29]
[30]
[31]
[32]
the IEEE International Conference on Acoustics, Speech and Signal Processing (ICASSP ’07), pp. I-721–I-724, IEEE, Honolulu, Hawaii, USA, April 2007. I. Ram, M. Elad, and I. Cohen, “Image processing using smooth ordering of its patches,” IEEE Transactions on Image Processing, vol. 22, no. 7, pp. 2764–2774, 2013. Q. S. Lian and S. Z. Chen, “Sparse image representation using the analytic Contourlet transform and its application on compressed sensing,” Acta Electronica Sinica, vol. 36, no. 6, pp. 1293–1298, 2010. Z. Wang, A. C. Bovik, H. R. Sheikh, and E. P. Simoncelli, “Image quality assessment: from error visibility to structural similarity,” IEEE Transactions on Image Processing, vol. 13, no. 4, pp. 600– 612, 2004. L. Zhang, L. Zhang, X. Mou, and D. Zhang, “FSIM: a feature similarity index for image quality assessment,” IEEE Transactions on Image Processing, vol. 20, no. 8, pp. 2378–2386, 2011. H.-W. Chang, H. Yang, Y. Gan, and M.-H. Wang, “Sparse feature fidelity for perceptual image quality assessment,” IEEE Transactions on Image Processing, vol. 22, no. 10, pp. 4007–4018, 2013.
Advances in
Operations Research Hindawi Publishing Corporation http://www.hindawi.com
Volume 2014
Advances in
Decision Sciences Hindawi Publishing Corporation http://www.hindawi.com
Volume 2014
Journal of
Applied Mathematics
Algebra
Hindawi Publishing Corporation http://www.hindawi.com
Hindawi Publishing Corporation http://www.hindawi.com
Volume 2014
Journal of
Probability and Statistics Volume 2014
The Scientific World Journal Hindawi Publishing Corporation http://www.hindawi.com
Hindawi Publishing Corporation http://www.hindawi.com
Volume 2014
International Journal of
Differential Equations Hindawi Publishing Corporation http://www.hindawi.com
Volume 2014
Volume 2014
Submit your manuscripts at http://www.hindawi.com International Journal of
Advances in
Combinatorics Hindawi Publishing Corporation http://www.hindawi.com
Mathematical Physics Hindawi Publishing Corporation http://www.hindawi.com
Volume 2014
Journal of
Complex Analysis Hindawi Publishing Corporation http://www.hindawi.com
Volume 2014
International Journal of Mathematics and Mathematical Sciences
Mathematical Problems in Engineering
Journal of
Mathematics Hindawi Publishing Corporation http://www.hindawi.com
Volume 2014
Hindawi Publishing Corporation http://www.hindawi.com
Volume 2014
Volume 2014
Hindawi Publishing Corporation http://www.hindawi.com
Volume 2014
Discrete Mathematics
Journal of
Volume 2014
Hindawi Publishing Corporation http://www.hindawi.com
Discrete Dynamics in Nature and Society
Journal of
Function Spaces Hindawi Publishing Corporation http://www.hindawi.com
Abstract and Applied Analysis
Volume 2014
Hindawi Publishing Corporation http://www.hindawi.com
Volume 2014
Hindawi Publishing Corporation http://www.hindawi.com
Volume 2014
International Journal of
Journal of
Stochastic Analysis
Optimization
Hindawi Publishing Corporation http://www.hindawi.com
Hindawi Publishing Corporation http://www.hindawi.com
Volume 2014
Volume 2014