Structural Engineering and Mechanics, Vol. 56, No. 1 (2015) 000-000 000
DOI: http://dx.doi.org/10.12989/sem.2015.56.1.000
Numerical modeling of dynamic compaction process in dry sands considering critical distance from adjacent structures Majid Pourjenabia and Amir Hamidi School of Engineering, Kharazmi University, Tehran, Iran
(Received May 6, 2014, Revised September 11, 2015, Accepted September 15, 2015) Abstract. Dynamic compaction (DC) is a useful method for improvement of granular soils. The method is
based on falling a tamper (weighting 5 to 40 ton) from the height of 15 to 30 meters on loose soil that results in stress distribution, vibration of soil particles and desirable compaction of the soil. Propagation of the waves during tamping affects adjacent structures and causes structural damage or loss of performance. Therefore, determination of the safe or critical distance from tamping point to prevent structural hazards is necessary. According to FHWA, the critical distance is defined as the limit of a particle velocity of 76mm/s. In present study, the ABAQUS software was used for numerical modeling of DC process and determination of the safe distance based on particle velocity criterion. Different variables like alluvium depth, relative density, and impact energy were considered in finite element modeling. It was concluded that for alluvium depths less than 10m, reflection of the body waves from lower boundaries back to the soil and resonance phenomenon increases the critical distance. However, the critical distance decreases for alluvium depths more than 10m. Moreover, it was observed that relative density of the alluvium does not significantly influence the critical distance value. Keywords: dynamic compaction; numerical modeling; ABAQUS; cap plasticity model; critical distance;
fourier amplitude; spectral acceleration
1. Introduction Dynamic compaction (DC) is a reliable method for compacting granular soils. This method is based on dropping a tamper (weighing from 5 to 40 tons) from the height of 15 to 30 meters and results in required compaction and shear strength of the soil. Menard and Broise (1975) introduced DC method for different types of granular soils including ballast fills or natural sandy gravels. After that, a number of researchers applied the method at the field or laboratory to investigate the improvement process of sandy soils. In addition, analytical and numerical methods have also been applied to survey the effect of different parameters on effectiveness of the method. As an early filed study, Mayne et al. (1984) studied Field measurements from over 120 sites and determined the response of the ground improved by DC. Mayne (1985) collected a summary of peak particle velocities from 12 sites and presented correlations to predict peak particle velocity Corresponding author, Associate Professor, E-mail:
[email protected] a Graduate Student Copyright © 2015 Techno-Press, Ltd. http://www.techno-press.org/?journal=sem&subpage=8
ISSN: 1225-4568 (Print), 1598-6217 (Online)
Majid Pourjenabi and Amir Hamidi
based on tamping weight, falling height and distance from tamping point. Zou et al. (2005) studied application of DC method for construction of a road embankment and compared the result satisfactory with those observed from compaction by rolling. Hwang and Tu (2006) measured ground vibrations during DC at an industrial site and presented various vibration measurements including velocity time histories, Fourier spectrum, response spectrum and amplitude attenuations with distance. According to this study, peak practical velocity form DC project reduces to less than 76 mm/s 10 meters far from tamping point. They also concluded that isolation trenches are not effective in reduction of vibration and noise during DC process. Hua et al. (2008) investigated DC effects on a plastic clay and showed acceptable treatment results for the soil. Also Feng et al. (2010) reported the results of DC method for a very coarse grained soil placed over soft clay in a coastal reclamation area and indicated its acceptable treatment. Rollins and Kim (2010) also studied different case histories and provided 15 projects at 10 locations in US where collapsible soils were treated using DC. In some cases, cohesionless and low-plasticity collapsible soils were successfully compacted. In other projects, thin clay layers in the profile absorbed energy and compaction effectiveness severely reduced. They presented correlations for estimating maximum depth of improvement, degree of improvement, crater depth and level of vibration based on measurements gathered from various sites. Hamidi et al. (2011) monitored vibration parameters during several phases of DC in different blow counts and distances and presented correlations between peak particle velocity and distance form tamping point. In the laboratory, physical modeling has also been widely used to model DC phenomenon. Oshima and Takada (1997) modeled DC process in centrifugal system and focused on compaction area under tamping point besides effective improvement depth. Jafarzadeh (2006) tested a physical model and studied different features of DC method. Using the results of the tests, he proposed some relationships for crater depth having good agreements with site data. Arslan et al. (2007) modeled DC in laboratory with different tamper shapes in granular soils. Based on the results, they concluded that conical tampers yield higher depths of improvement compared to the flat-bottom tampers. Analytical methods have also been applied for investigation of DC process. Mayne and Jones (1983) estimated the magnitude and duration of dynamic stresses during impact forces using a simple theory. Chow et al. (1990) presented a formulation to predict the degree and depth of improvement during DC of loose granular soils. Chow et al. (1992) used a simplified model based on one-dimensional wave equation theory to calculate the interaction of the pounder and compacting soil. Chow et al. (1994) also presented a method to evaluate the effect of print spacing on the ability of DC method in loose sands. Also they applied wave equation theory to predict lateral deformations during impacts around tamper. Roesset et al. (1994) used a simple mass-spring-dashpot model to assess the characteristics of forces transmitted to the ground by a falling weight. Minaev (2002) studied the results of theoretical and experimental investigations on DC of slightly cohesive saturated soils and indicated the possiblity of improvement by amplification of the oscillations in compaction zone and attenuating them appreciably beyond the limits of the area. Numerical methods have also been involved in the literature as a strong tool for predicting DC ability in recent years. Pan and Selby (2002) numerically simulated DC of loose soils using ABAQUS software considering a force-time plot or modeling the free fall of a rigid tamper. Ghassemi et al. (2010) used cap plasticity model in a fully coupled hydro-mechanical finite element code, PISA and applied it to evaluate DC process in saturated granular soils. Jahangiri et al. (2010) analyzed a case history of DC project by numerical simulation and developed design
Numerical modeling of dynamic compaction process in dry sands considering critical distance...
charts with good capability for determination of print spacing in DC. Jia and Zhou (2010) conducted two dimensional numerical simulation of DC using PFC2D code. Based on the results, DC phenomenon was well simulated and change in dynamic stresses and strains were really traced and recorded. Li et al. (2011) compared numerical simulation of DC with field measurements. They found that the numerical simulation can explain all sorts of phenomenon and can serve for design of DC. Pourjenabi et al. (2013) modeled DC operation in dry sand using ABAQUS and compared the results of modeling implementing two different constitutive laws (i.e., cap plasticity and Mohr-Coulomb criterion). They showed that cap plasticity serves better predictions of the crater depth and relative density variations with depth compared to the Mohr-Coulomb model. Waves are distributed in all directions after impacts exerted by a tamper on the soil. Stress distribution causes soil particles to vibrate and affects adjacent structures where they may have structural damage and loss of performance. Maximum particle velocity to avoid any hazard of adjacent structures is limited to 76 mm/s based on FHWA (Lukas 1995). Therefore, determination of the safe distance between tamping point and the other end where particle velocity is less than 76 mm/s is necessary (especially for pipelines and industrial facilities). Mayne (1985) showed that peak particle velocity is less that 76 mm/s at 10 to 20 meters far from tamping point. Few researchers focused on the safe distance during DC process. The safe distance from tamping point can be determined by several approaches such as installation of velocity sensors in the field. This method is time consuming and does not seem to be economical. Due to the ability of numerical methods in predicting different aspects of DC process, in present research, for the first time, three dimensional finite element modeling is performed using ABAQUS software to predict the safe distance in different tamping energies and soil conditions. Based on the results, some recommendations are presented to avoid structural damages during improvement process.
2. Wave equations Three-dimensional equations of motion for x, y and z directions can be written in the following forms 2u xx xy xz x y z x 2
(1)
2 v xy yy yz x y z y 2
(2)
2 w xz yz zz x y z z 2
(3)
Where xx, yy and zz are normal stresses, xy, yz and xz are shear stresses, is the soil density and u, v and w are displacements in x, y and z directions. These equations are solely based on equilibrium considerations and their results can be used for any type of stress-strain behavior. After solving the equations as well as related stress-strain constitutive relations, two groups of waves will be achieved named as dilatational wave (p-wave) and distortional wave (s-wave). For p-waves, the soil particle displacements are parallel to the direction of wave propagation and value of velocity is equal to Vp. For s-waves, the particle motion is constrained to a plane perpendicular
Majid Pourjenabi and Amir Hamidi
Fig. 1 Yield surface of the cap model in stress invariants space
to the direction of wave propagation with lower velocity value, Vs. 3. Constitutive model applied in numerical analysis Constitutive model applied in the numerical analysis was cap plasticity. The model is able to predict hardening behavior of soil during tamping and has particularly been used to predict the behavior of soils under impact loads (Ghassemi et al. 2010). Yield surface of the model consists of two different parts and is indicated in Fig. 1 at the first and second stress invariants plane (J1-J2D). The first part is a linear shear yield surface based on Drucker-Prager yield criterion in Eq. (4) and the second one is a moveable cap that is defined by Eqs. (5)-(6) and is used to express failure under isotropic effective stresses. f1 J 2 D J1 0
(4)
f 2 ( J1 l )2 R2 J 2 D ( x l )2 0
(5)
X R. 1 .R
(6)
l
α and are constants of Drucker-Prager failure criterion. X is the hardening parameter, R is the material parameter, and l is the first invariant of stress at the intersection point of the fixed yield surface with the cap. The cap is extended due to the soil hardening as a function of plastic volumetric strains according to (Eq. (7)).
1 X Ln(1 v ) X 0 D W p
(7)
Where W and D are material parameters and X0 is the initial stresses induced due to the gravity analysis.
4. Numerical modeling Three dimensional modeling has been performed using ABAQUS software. During compaction
Numerical modeling of dynamic compaction process in dry sands considering critical distance...
Fig. 2 Dimensions and discretization of the model
and multiple impacts, soil parameters such as friction angle, density and shear modulus were modified and updated considering induced volumetric strains and change in the void ratio. Large deformations are considered in modeling process. In the first step, gravity analysis is performed to determine initial stresses. The time for each impact was 60sec and the minimum time increment was 10-8sec; which is appropriately small for dynamic analysis and specially impact problems.
5. Verification of the model Verification of the numerical model was performed using two different sets of data. At first, direct results of DC process such as crater depth and depth of improvement were compared between present model and centrifuge tests of Oshima and Takada (1997). At the second part, a comparison was made between particle velocities determined from numerical model and field observations conducted by Huang and Tu (2006). 5.1 Verification of the numerical tool using experimental data Oshima and Takada (1997) modeled DC on dry sand using centrifuge test under centrifugal acceleration of 100 g (Oshima and Takada 1997). The material was a sandy soil passing a 2 mm sieve with a fine fraction of 6%. The models were compacted to initial relative density of 35% with a water content of 4%. A two dimensional 18 m in 14 m axisymmetric finite element mesh shown in Fig. 2 was considered for simulation of the tests in prototype scale. Features of soil and cap plasticity model parameters are depicted in Table 1. The soil and hardening parameters considered in present study
Majid Pourjenabi and Amir Hamidi Table 1 Soil and model parameters for experimental studies of Oshima and Takada (1997) Parameter Friction angle Cohesion Soil density Young’s modulus Poisson’s ratio R W D
Value 29.9 (degree) 0 15.7 kN/m3 25 MPa 0.25 4.33 0.4 1810-4 (m2/kN)
Fig. 3 Comparison results of centrifuge test and numerical modeling (a) The 5th blow (b) The 10th blow
Numerical modeling of dynamic compaction process in dry sands considering critical distance...
(a)
(b) Fig. 4 Views of the model in ABAQUS (a) 3D finite element meshing (b) Compaction points and measurement layout
are consistent with values applied by Li et al. (2011) numerical analyses in which they studied the similar sandy soil. Interface elements have also been used to define the contact between tamper and ground surface using a friction coefficient of 0.5 in ABAQUS. Also damping ratio was assumed 5% of the critical damping. Contours of the change in relative density for a 400t.m energy per drop (W=20 t and H=2 0 m) are shown in Fig. 3. In this figure X axis is distance from center of tamping point and Y axis is depth of soil body. The results of numerical model and centrifuge tests are compared as contour lines of the increase in relative density (dDr=10, 20 and 40%) for the 5th and 10th blow counts. According to Fig. 3(a), the crater depths in the 5th blow was 1.1 m and 1.2 m for centrifuge tests and numerical analysis. Also 10, 20 and 40% increase in relative density were observed up to the maximum depths of 5.6, 3.9 and 2.9 m in numerical model which were consistent with experimental values recorded in 5.0, 4.1 and 3.1 m, respectively. For the 10th blow based on Fig. 3(b), the crater depths increased to 1.4 m and 1.7 m in centrifuge tests and numerical simulations, respectively. Also, 10, 20 and 40% increase in relative density observed up to 6.5, 5.1 and 4.1m associated to the experimental values of 6.4, 5.6 and 4.1 m, respectively. Consistency of the experimental and numerical results indicates the ability of numerical tool in simulation of DC process. 5.2 Verification of the numerical tool using field data Hwang and Tu (2006) used field measurements to determine particle velocity during DC
Majid Pourjenabi and Amir Hamidi
process for a site in Central Taiwan. The soil consisted mainly deep-thick layer of gray silty fine sand, occasionally interbedded with a layer of silty clay and a gravelly soil with a thickness of 60~120 cm backfilled on the ground surface. The shear wave velocity varied from 150~200 m/s on the ground surface to 200~300 m/s at a depth of 15 m and 300~340 m/s at a depth of 60 m below the ground surface. Three dimensional finite element modeling performed using ABAQUS to compare the results of the numerical simulation with the field particle velocity measurements. Fig. 4(a) depicts a three dimensional view of the applied model. Data of the field measurements were selected from velocity records during DC along sensor stations 20, 30, 40, 70, 110, and 175 m from the center of tamping points. In present study, numerical modeling performed for a 20 ton tamper falling from 20 m height (400 t.m energy per drop) executed in 9 tamping points as shown in Fig. 4(b). Due to restrictions for the results of field and soil parameters, particle velocity at 20 meters from tamping point in model was used in verification and training of model parameters. Features of the soil and hardening parameters are included in Table 2. Gravity analysis conducted as the first step to exert initial stresses and afterwards DC pattern was followed according to the tamping points shown in Fig. 4(b).
Table 2 Soil and model parameters in field studies of Hwang and Tu (2006) Parameter Friction angle Cohesion Soil density Young’s modulus Poisson’s ratio R W D
Value 28 (degree) 0.98 (kPa) 15.8 kN/m3 10.8 MPa 0.3 1.15 0.5 510-4 (m2/kN)
Fig. 5 Variation of the velocity with time for a distance of 20 m from the central tamping point (T5) in numerical analysis
Numerical modeling of dynamic compaction process in dry sands considering critical distance...
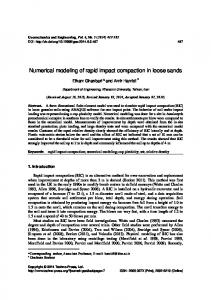
Fig. 6 The average attenuation of PGV in field and numerical modeling for the 8th impact point
Fig. 5 indicates the variation of particle velocity with time for a distance of 20m from the central tamping point (T5) in numerical analysis. The figure shows that particle velocity can be considered approximately zero in time intervals between adjacent impact points. Consequently, each tamping point can be analyzed separately from the others. Maximum particle velocity is detected at the 8th tamping point (with minimum distance from sensors) due to the isotropic behavior considered for the soil. Fig. 6 displays the variation of peak ground velocity (PGV) with distance for the 8th tamping point (T8). In this Figure, maximum allowable velocity (76 mm/s) is also specified with a dashed line. Reasonable agreement is observed between the results of numerical simulation and field measurements. These outcomes verify the ability of the numerical tool in simulation of DC process.
6. Factors affecting the safe distance from adjacent structures during compaction In a comprehensive review to determine the safe distance from adjacent structures during DC where the soil particles velocity is less than 76 mm/s, different parameters should be involved like alluvium depth, relative density, compaction energy and number of tamping blows per each point.
In this survey, the simulation was conducted considering 6 alluvium thicknesses (5, 7.5, 10, 12.5, 15 and 17.5 m) and 3 different soil densities. The soil densities were assumed associated to the average standard penetration resistance, SPT N-values of 10, 20, and 30. A Menard’s number of (n=0.5) was considered to calculate the required tamping energy according to Eq. (8). In this equation, tamper weight (W), falling height (H) and desired improvement depth (D) are related as follows (Menard and Broise 1975). Table 3 shows different parameters assumed in numerical modeling of the alluvium. D n WH
(8)
Majid Pourjenabi and Amir Hamidi Table 3 Different alluvium parameters considered in numerical modeling SPT N-value 10 20 30
Dr (%) 49 63 77
c (kN/m2) 0 0 0
ϕdeg)
γ (kg/m3)
27.3 32.3 36.2
1620 1680 1740
E (kN/m2) 24500 49000 73500
0.3 0.3 0.3
Table 4 Cap plasticity model parameters considered in numerical modeling Parameter R W D
Value 4.33 0.5 510-4 (m2/kN)
Fig. 7 Critical distance variation with number of blows for alluvium with SPT N-value of 10
Table 4 also depicts hardening parameters of the cap plasticity model. The behavior of tamper was considered to be elastic with an elasticity modulus of 23500 MN/m2. Particle velocity at different distances from each tamping point was determined by numerical modeling. The critical or safe distance was defined as the length between tamping point and other end where the particle velocity increases 76 mm/s.
Numerical modeling of dynamic compaction process in dry sands considering critical distance...
Fig. 8 Variation of the critical distance with SPT N-value
Fig. 7 depicts the variation of critical distance with number of blows for different combinations of the variables like alluvium depth, Tamper weight and falling height (for a specified SPT Nvalue of 10). As the figure shows, a significant drop has occurred in the critical distance value after the first blowcount. After that, it remained nearly constant between 10th to 12th drops. Therefore, numerical modeling was performed up to the 12th blowcount. At the first blowcount, the soil under tamping point is loose and wave propagation is similar in both horizontal and vertical directions. After the first impact, the soil becomes denser due to the settlement under tamping point. It results to the difference in damping and energy transmission for horizontal and vertical directions and consequent reduction of the critical distance value. In this regard, if destructive effects at the first impact are controlled, the critical distance decreases at other blows and larger area of the site can be improved. Fig. 8 displays variation of the critical distance with SPT N-value (relative density) for different alluvium depths. It is evident that variation of the critical distance with density is small (less than 0.5 m). Therefore, it can be understood that initial relative density has little effect on the critical distance and can be neglected. Fig. 9 indicates the variation of critical distance with alluvium depth for different densities. According to the figure, critical distance increases with alluvium thickness up to the depth of 10m where a marked drop occurs in its value and reaches to an almost constant value afterwards. This type of behavior emphasizes the need for controlling the frequency of the impact loading. Predominant period (T) corresponding to the fundamental frequency of vibration for an alluvium with a depth of H and average shear wave velocity of Vs can be determined as follows (Kramer 1996) T
4H V s
(9)
Moreover, lower and upper limits of the resonance period are 0.5 and 2 times of the
Majid Pourjenabi and Amir Hamidi
Fig. 9 Critical distance variation with alluvium depth
Fig. 10 Variation of predominant period with alluvium depth for 10, 11 and 12 th blow counts (a) SPT N-value=10 (b) SPT N-value=20 (c) SPT N-value=30
Numerical modeling of dynamic compaction process in dry sands considering critical distance...
Fig. 10 Continued
Fig. 11 (a) Fourier amplitude (b) Spectral acceleration determined at different distances at the soil with SPT N-value=20 and D=10 m
Majid Pourjenabi and Amir Hamidi
fundamental period, respectively (Kramer 1996). Fig. 10 indicates the limits of resonance period besides the period of impact as an external loading for 10 th, 11th, and 12th blowcounts. According to this figure, up to an alluvium depth of 10m, impact period is approximately between resonance period limits. This results to an increase in critical distance. For alluvium depths more than 10 m, the period of impact loading is no more between resonance limits which results in a reduced critical distance value. Fig. 11(a) shows Fourier amplitude for 10 m depth alluvium with average SPT N-value of 20 in different distances from tamping point. As the figure implies, maximum acceleration amplitude has occurred in a frequency of 3 Hz in all cases. Transmitted energy of vibration decreased as the distance from tamping point increased which results to zero Fourier amplitude at a distance about 20 m far from the drops. Fig. 11(b) displays that spectral acceleration is a more regular parameter to illustrate the attenuation of acceleration with distance. Based on the figure, spectral acceleration decrease with increase of distance from tamping point. The predominant period is smaller in near distances due to the lower damping effects, however, more damping effects in larger distances results in an increased predominant period.
Fig. 12 Fourier amplitude and spectral acceleration at a distance of 10m from tamping point for different blowcounts: (a) 10th blow (b) 11th blow (c) 12th blow
Numerical modeling of dynamic compaction process in dry sands considering critical distance...
Fig. 12 Continued
Fig. 12 displays the Fourier amplitude and spectral acceleration for a 10 m depth alluvium with different densities calculated at 10 m distance from the tamping point. Fig. 12(a) shows Fourier amplitude and spectral acceleration for 10th blow count. The peak point of the Fourier amplitude in this figure proved little change in the critical distance with relative density as previously depicted in Fig. 8. Figs. 12(b) and 12(c) indicate the same results for 11th and 12th impacts. Maximum spectral accelerations for three last impacts recorded at average predominant periods of 0.4, 0.3 and 0.26s for SPT N-values of 10, 20 and 30, respectively. Decrease in predominant period with increase in relative density is apparent due to the increase in stiffness of the soil. This trend was observed in present study for all alluvium and tamping conditions.
7. Conclusions In this research, Numerical modeling of DC in dry sand with different relative densities and thicknesses was carried out and the minimum safe distance for structures was calculated. • The particle velocity for each tamping point was independent from other ones. Considering the isotropic behavior of the soil, the maximum particle velocity was recorded at the nearest distance to the tamping location. • The largest critical distance was determined at the first impact and it decreased with increase in the number of blows. It remained nearly constant after the 10th blow count. • Variation of the critical distance with relative density was small and its effects on the critical distance can be ignored. • Alluvium depth was the most effective parameter on the critical distance value. In present study, the critical distance increased with alluvium depth up to 10m depth due to the resonance effects. After that, it decreased with further increase in alluvium depth. • The predominant period decreased with increase in relative density during tamping.
Majid Pourjenabi and Amir Hamidi
References Arslan, H., Baykal, G. and Ertas, O. (2007), “Influence of tamper weight shape on dynamic compaction”, Ground Improv., 11(2), 61-66. Chow, Y.K., Yong, D.M., Yong, K.Y. and Lee, S.L. (1990), “Monitoring of dynamic compaction by deceleration measurements”, Comput. Geotech., 10(3), 189-209. Chow, Y.K., Yong, D.M., Yong, K.Y. and Lee, S.L. (1992), “Dynamic compaction analysis”, Geotech. Eng., 118(8), 1141-1157. Chow, Y.K., Yong, D.M., Yong, K.Y. and Lee, S.L. (1994), “Dynamic compaction of loose granular soils: effect of print spacing”, Geotech. Eng., 120(7), 1115-1133. Das, B.M. (1993), Principle of Soli Dynamics, PWS-KENT, America. Feng, S.J., Shui, W.H., Gao, W.H., He, L.J. and Tan, K. (2010), “Field evaluation of dynamic compaction on granular deposits”, Perform. Constr. Facil., 25(3), 241-249. Ghassemi, A., Pak, A. and Shahir, H. (2010), “Numerical study of the coupled hydro-mechanical effects in dynamic compaction of saturated granular soils”, Comput. Geotech., 37, 10-24. Hamidi, B., Nikraz, H. and Vaeaksin, S. (2011), “Dynamic compaction monitoring in a saturated site”, Intentional Conference on Advances in Geotechnical Engineering, Australia pp. 267-272 Hua, L.J., Bo, Y.J., Hu, X. and Wei, C. (2008), “Dynamic compaction treatment technology research of red clay soil embankment in southern mountains”, J. Central South Univ. Tech., 15, 50-57. Hwang, J.H. and Tu, T.Y. (2006), “Ground vibration due to dynamic compaction”, Soil Dyn. Earthq. Eng., 26, 337-346. Jafarzadeh, F. (2006), “Dynamic compaction method in physical model test”, Scientia Iranica, 13, 187-192. Jahangiri, Gh., Pak, A. and Ghassemi, A. (2010), “A novel numerical method for determination of print spacing in dynamic compaction operation of dry sand”, 4thInternational Conference on Geotechnical Engineering and Soil Mechanics, Tehran. Jia, M. and Zhou, J. (2010), “Investigation of mechanical response induced in dynamic compaction of sandy soils with PFC2D”, GeoShanghai 2010 International Conference, 261-268. Kramer, S.L. (1996), Geotechnical Earthquake Engineering, Prentice Hall, America. Li, W., Gu, Q., Su, L. and Yang, B. (2011), “Finite element analysis of dynamic compaction in soft foundation”, Procedia Eng., 12, 224-228. Lukas R.G. (1995), “Geotechnical engineering circular No. 1- Dynamic compaction”, FHWA-SA-95-037. Mayne, P.W. and Jones, J.S. (1983), “Impact stresses during dynamic compaction”, Geotech. Eng., 109(10), 1342-1346. Mayne, P.W., Jones, J.S. and Dumas, J.C. (1984), “Ground response to dynamic compaction”, Geotech. Eng., 110(6), 757-774. Mayne, P.W. (1985), “Ground vibrations during dynamic compaction”, Vibration Problems in Geotechnical Engineering, Proceeding of a symposium sponsored by the geotechnical Engineering Division, ASCE Detroit, Michigan, 247-265 Menard, L. and Broise, Y. (1975), “Theoretical and practical aspects of dynamic consolidation”, Geotechnique, 25(1), 3-16 Minaev, O.P. (2002), “Effective method for dynamic compaction of slightly choesivesaturated soils”, Soil Mech. Found. Eng., 39(6), 208-213. Oshima, A. and Takada, N. (1997), “Relation between compacted area and ram momentum by heavy tamping”, 14th International Conference on Soil Mechanics and Foundation Engineering, 3, 1641-1644. Pan, J.L. and Selby, A.R. (2002), “Simulation of dynamic compaction of loose granular soils”, Adv. Eng. Softw., 33, 631-640. Pourjenabi, M., Ghanbari, E. and Hamidi, A. (2013), “Numerical modeling of dynamic compaction in dry sand using different constitutive models”, 4th ECCOMAS Thematic Conference on Computational Methods in Structural Dynamics and Earthquake Engineering. Roesset, J.M., Kausel, E., Cuellar, V., Monte, J.L. and Valerio, J. (1994), “Impact of weight falling onto the
Numerical modeling of dynamic compaction process in dry sands considering critical distance... ground”, Geotech. Eng., 120(8), 1394-1412. Rollins, K.M. and Kim, J. (2010), “Dynamic compaction of collapsible soils based on U.S. case histories”, Geotech. Geoenviron. Eng., 136(9), 1178-1186. Zou, W.L., Wang, Z. and Yao, Z.F. (2005), “Effect of dynamic compaction on placement of high-road embankment”, Perform. Constr. Facil., 19(4), 316-323.
CC