Optimal Load Distribution in Large Scale WLAN Networks Utilizing a Power Management Algorithm Mohamad Haidar University of Arkansas at Little Rock
Robert Akl University of North Texas
Hussain Al-Rizzo University of Arkansas at Little Rock
Yupo Chan University of Arkansas at Little Rock
Rami Adada University of Arkansas at Little Rock
[email protected]
[email protected]
[email protected]
[email protected]
[email protected]
Abstract In this paper we present an algorithm, based on power management of Access Points (AP), to reduce congestion in Wireless Local Area Networks (WLANs). The algorithm finds the Most Congested Access Point (MCAP) and adjusts its transmitted power in discrete steps and determines the optimal users’ assignment such that an optimal load distribution is achieved. Results show that the algorithm is capable of significantly reducing the overall congestion in the WLAN.
1. Introduction Minimizing congestion in large scale WLANs has received significant attention in the past few years [1]-[4]. In [1, 2], the authors proposed an approach of minimizing AP congestion in WLANs by formulating an optimal Integer Linear Programming (ILP) problem. The optimization objective is to minimize the maximum congested AP, which quantitatively represents congestion at the hot spot in WLAN service areas. By using a free space propagation model to determine association of demand points with candidate APs, the WLAN design process can be easily performed. The authors in [1, 2] assumed the transmitted power by APs to be fixed at all times. In [3], the authors proposed a load balancing technique that allows a wireless station to join an AP depending on the number of already associated stations and the mean Received Signal Strength Indicator (RSSI). Each AP updates its mean RSSI and the number of associated stations continuously in each beacon or probe response frame. The algorithm performed well under traffic consisting of three APs and 30 users.
However, the algorithm was neither tested for larger networks nor dealt with individual power management of APs while balancing the load. The authors in [4] proposed a load-balancing scheme for overlapping wireless cells. Load Balancing Agents (LBA) running in each AP broadcast periodically the local load via the Ethernet backbone and determine whether the AP is overloaded, balanced or under-loaded. Users in overloaded APs will be forced to dissociate from their corresponding AP to associate with only under-loaded AP. Although the authors have shown experimentally that their balancing scheme increases the total network throughput and decreases the packet delay, it did not take into account the power management of APs. In this paper, we propose solving an optimization problem by adjusting the power transmitted by the MCAP until one or more users can no longer associate with any AP or their data rate demand can no longer be accommodated. The paper will show that the performance of the devised algorithm is better than those described in [1, 2] for various network topologies. The remainder of the paper is organized as follows. Power management algorithm is presented in section 2. In section 3, numerical results are presented, and finally section 4 concludes the paper.
2. The Power Management Algorithm The WLAN under consideration consists of a grid of M APs distributed in a single-floor indoor environment. A set of randomly distributed N users seek to associate with an AP. Each user is defined by its data rate, U bits/s, randomly assigned between 100 kb/s to 1.1 Mb/s. An algorithm has been developed to determine the power level at each user’s location based on
the No Line of Sight (NLOS) commercial Path Loss model described in (1) [5]: d d PL(d) = PL0 +29.4log10( ) +6.1xα log10( ) +2.4y +1.3xy s (1) d0 d0 where PL0 is the free space path loss, d is the distance between user i and APj, d 0 < d is the received power reference point at 1 meter (indoor), and xα, xs, and y are mutually independent Gaussian random variables of zero mean and unit variance. Once the power received by a user from an AP exceeds the receiver sensitivity value of -90 dBm, that user becomes a candidate for association with that AP. Thus initially a user can be a candidate for association with several APs. We seek to redistribute users’ association in order to minimize the overall congestion in the network. This is achieved by first identifying the MCAP. The objective function is defined as minimizing congestion at the MCAP. This is done with the additional constraint that each user must be associated with one-and-only one AP. The congestion factor is defined as [2]: Cj =
U 1 + U 2 + ... + UNj , BW j
(2)
N
subject to
min max {C 1, C 2,..., CM } , xij , 1 ≤ i ≤ N 1 ≤ j ≤ M
(3)
ij
=1
(3.1)
i =1
M
Ui • xij i =1 BWj
Cj = ∑
(3.2)
for j=1,…,M
Objective (3) minimizes the maximum congestion at the MCAPs. Constraint (3.1) states that each user must be assigned to one-and-onlyone AP. xij is a binary variable that is 1 when user i is assigned to APj and 0 otherwise. The constraint stated in (3.2) defines the congestion factor at the APs. It should be noted that as the users’ association is changing due to the decrease of power transmitted from the MCAP, the new MCAP may not be the same as the previous MCAP. The algorithm appropriately relocates the MCAP at each iteration based on the new bandwidth utilization, and decrements its power assuming the average data rate of the defined users is constant over the current simulation period. The algorithm can be summarized as follows: •
where Cj is the congestion factor at AP j, j is the set of APs, Ui is the data rate for user i, and BWj is the maximum bandwidth of 11 Mbps. The commercial software LINGO [6] is used to solve the ILP, which is described below. The transmitted power of each AP is set to 20 dBm. Initially, the assignment is found for all the users using equally-distributed power level. The algorithm then identifies the MCAP. The MCAP is defined as the AP with the maximum bandwidth utilization as defined in (2). The transmitted power of the MCAP is then decremented by 1 dBm, the association matrix is recomputed from the propagation model, and we invoke LINGO to optimize the user distribution based on this newly generated users’ association scheme. This procedure continues until one or more users on the network can not associate with an AP or its/their demand can no longer be accommodated The objective is a measure of minimum congestion of the MCAP achieved under the constraints defined in (2) [1]. The ILP becomes:
∑x
•
•
•
• • •
•
Compute the Received Signal Strength Indicator (RSSI) at each user from each AP using the path loss model in (1). Associate users with APs with the highest RSSI and identify the MCAP by calculating congestion at each AP (2); Generate a binary matrix that assigns 1 if a user’s RSSI exceeds the threshold value or 0 otherwise. Invoke LINGO to solve the ILP optimization problem using the objective function and constraints defined in (3), (3.1) and (3.2); Identify the new MCAP; Decrement the power level of the new MCAP by 1 dBm; and Repeat the previous steps until one or more users can no longer associate with an AP. The last iteration, the one just before a user or more lose association with their APs, will be considered the one with the best power levels, best user’s association, and best load at APs.
Note that in all the simulations run, the algorithm reached the best solution within few minutes. The final solution provides the power level of the individual APs and the final users’ association such that each user is connected to one AP.
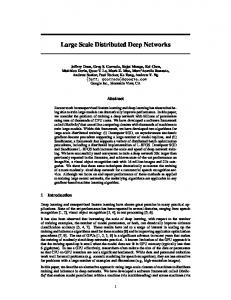
3. Numerical results The following results have been obtained for a single-floor building, 100 meters in length, 100 meters in width, and 3 meters in height. Figure 1 displays the distribution of APs, users, and the power level obtained from the propagation model. In scenario 1 we created a graphical representation of the power level of the 4 APs and random placement of 20 users. The average traffic per user is randomly generated for each scenario, between 100 Kbps and 1 Mbps, and is shown in Table 1. Each AP provides a maximum bandwidth of 11 Mbps (IEEE 802.11b).
Figure 1. Power level map for scenario 1 at ground level (0 meters), receiver level (1.5 meters) with 20 users, and AP level (3 meters) with 4 APs.
Table 1. Average traffic demand per user User Traffic User Traffic Number (kbps) Number (kbps) 741 330 1 11 566 518 2 12 667 962 3 13 467 849 4 14 576 607 5 15 349 725 6 16 738 974 7 17 936 165 8 18 683 763 9 19 805 155 10 20
We then generated an initial users’ association based on a receiver sensitivity value of -80 dBm as depicted in Table 2. As can be seen from Table 2, a user can be a candidate for association to multiple APs if its signal level exceeds the threshold value. For instance, U1 can connect to AP1, AP2 and AP3 while U10 can connect to AP2 and AP4, and U19 can connect only to AP3. Another table was constructed based on the highest RSSI to compute the initial congestion at APs. Next, LINGO is used to solve the model described in (2) while continuously decrementing the transmitted power at the MCAP by 1 dBm. Results are shown in Tables 3 and 4. Table 2. Initial Associations’ Matrix Users AP1 AP2 AP3 AP4 U1 1 1 1 0 U2 U3 U4 U5 U6 U7 U8 U9 U10 U11 U12 U13 U14 U15 U16 U17 U18 U19 U20
0 0 0 1 1 0 0 0 0 1 0 1 0 1 1 1 1 0 1
0 0 0 1 1 1 0 0 1 0 0 0 1 1 0 1 1 0 1
1 0 0 1 0 0 1 1 0 1 1 0 1 0 1 0 0 1 0
0 1 1 1 0 0 1 0 1 0 1 0 1 1 0 0 0 0 0
Table 3. Comparison between Optimal user’s assignment with and without power management (bolded numbers correspond to the effect of minimizing the MCAPs)
AP1 AP2 AP3 AP4
Initial Congestion factor: Before optimization, No Power Management (NPM) 0.7323 0.4735 0.2283 0.2393
Congestion factor solution according to [2]:No Power Management (NPM) 0.5416 0.5378 0.3547 0.2393
Congestion factor of the proposed algorithm: With Power Management (WPM) 0.4404 0.4155 0.4559 0.3615
Table 4. Optimal user’s assignment with power management.
Users U1 U2 U3 U4 U5 U6 U7 U8 U9 U10 U11 U12 U13 U14 U15 U16 U17 U18 U19 U20
AP1 0 0 0 0 0 1 0 0 0 0 0 0 1 0 0 1 1 0 0 0
AP2 1 0 0 0 1 0 1 0 0 1 0 0 0 0 0 0 0 1 0 1
AP3 0 1 0 0 0 0 0 0 1 0 1 0 0 1 0 0 0 0 1 0
AP4 0 0 1 1 0 0 0 1 0 0 0 1 0 0 1 0 0 0 0 0
As we can see from Table 3, algorithm in [2] was able to reduce initial congestion at AP1 only. However, our proposed algorithm was able to distribute the load more efficiently across other APs while decrementing the transmitted power discretely by 1 dBm until no user can associate with any AP. Table 4 displays the final association matrix that confirms that each user is associated with one AP which is the first constraint in the optimization model. The solution provided by our algorithm for the network under consideration was reached after power was dropped on AP1 from 20 dBm to 11 dBm, AP2 to 9 dBm, AP3 to 4 dBm and AP4 dropped to 3 dBm, Figure 2.
Figure 2. Power level map for scenario 1 after power adjustment.
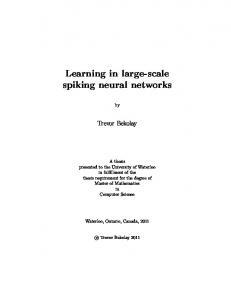
Figure 3 summarizes the results obtained for scenario 1. Congestion Factor Com parison 0.8 0.7 Init ial Congest ion Fact or : No Power Management
0.6 0.5 0.4
Congest ion Fact or according t o [ 2]
0.3 0.2 0.1 0 AP1
AP2
AP3
AP4
Congest ion Fact or wit h Power Management
A P n um be r
Figure 3. Summary graph of proposed algorithm vs Algorithm in [2] for scenario 1
Different scenarios have been tested further in order to validate the model’s scalability. In scenario 2, we used 9 APs and 30 users over a 160 meters length, 160 meters width and 3 meters height area. Com parison betw een Congestion Factors 0.6000 0.5000
Init ial Congest ion Fact or , NPM
0.4000 0.3000
Congest ion Fact or based on [ 2]
0.2000 0.1000 0.0000
A P n um be r
Congest ion Fact or based on Power Management
Figure 4. Summary graph of proposed algorithm vs Algorithm in [2] for scenario 2.
The algorithm in [2] only reduced the congestion at AP6, the MCAP. On the other hand, our proposed algorithm provided more efficient distribution of load by bringing down the transmitted power on AP1 to AP9 from 20 dBm to 15 dBm, 12 dBm, 3 dBm, 3 dBm, -2 dBm, 4 dBm, 18 dBm, 11 dBm and 10 dBm, respectively. In scenario 3, we assumed 16 APs and 40 users over a 220 meters length, 220 meters width and 3 meters height area.
one or more users can not associate anymore or their data rate can not be accommodated anymore. The algorithm has been shown to provide improved results compared to the No Power Management (NPM) algorithm described in [1, 2]. The model has shown to perform well for networks of different topologies. Work is undergoing to extend the model to include interand intra-cell interferences and channel number assignment which will be the subject of further publication.
Congestion Factor Comparison (16 APs)
Acknowledgment: This research work was funded, in part, by an MRI grant from the National Science Foundation (Grant #: CNS – 0619069).
Initial congestion factor: NPM Congestion Factor based on [2] Congestion factor with power Management
5. References
Congestion Factor (10^-3)
0.4500 0.4000
[1] Y. Lee, K. Kim, and Y. Choi. “Optimization of AP
0.3500 0.3000
placement and Channel Assignment in Wireless
0.2500
LANs.” LCN 2002. 27th Annual IEEE Conference on
0.2000 0.1500
Local Computer Networks, pages 831-836, November
0.1000 0.0500
2002. AP 15
AP 13
AP 11
AP 9
AP 7
AP 5
AP 3
AP 1
0.0000
AP number
[2] R. Akl and S. Park. “Optimal Access Point selection and Traffic Allocation in IEEE 802.11
Figure 5. Summary graph of proposed algorithm vs Algorithm in [2] for scenario 3.
Networks,” Proceedings of 9th World Multiconference
The algorithm in [2] only reduced congestion on AP9, Figure 5, whereas our proposed algorithm reduced congestion at AP3, AP4, AP6, and AP 14 and efficiently distributed the load by bringing down the transmitted power on AP3 to 7 dBm, AP4 to 15 dBm, AP6 to 7 dBm, AP7 to 18 dBm, AP8 to 7 dBm, AP9 to 4 dBm, and AP11 to AP16 to 14 dBm, 5 dBm, 13 dBm, 11 dBm, 3 dBm, and 1 dBm. Finally, the scalability of the model was shown over three scenarios where the average congestion factor of the network was improved by assigning users efficiently to APs.
2005):
on Systemics, Cybernetics and Informatics (WMSCI Communication
and
Network
Systems,
Technologies and Applications, paper no. S464ID, July 2005. [3] I. Papanikos, M. Logothetis, "A Study on Dynamic Load Balance for IEEE 802.11b Wireless LAN," Proc. 8th International
Conference
on
Advances
in
Communication & Control, COMCON 8, Rethymna, Crete/Greece, June 2001. [4] H. Velayos, V. Aleo, and Karlsson, “Load Balancing in Overlapping Wireless LAN Cells”, Proceedings of IEEE ICC 2004, Paris, France, June
4. Conclusion In this paper, an algorithm to reduce the congestion at APs and balance the load of users has been proposed. The algorithm extends the optimization algorithm presented in [2] to include power management. It adjusts the power of the MCAP in discrete steps of 1 dBm until
2004. [5] J. Lei, R. Yates, L. Greenstein, and H. Liu, “Wireless Link SNR Mapping Onto An Indoor Testbed,” Proceedings of IEEE Tridentcom 2005, Trento, Italy, Feb 2005 [6] L. S. Inc., “LINGO,” http://www.lindo.com.