OPTIMAL SELECTION OF SPEECH DATA FOR AUTOMATIC SPEECH RECOGNITION SYSTEMS Arkadiusz Nagórski 1,2, Lou Boves 2, Herman Steeneken 1 1
2
TNO-Human Factors, Soesterberg, the Netherlands Department of Language and Speech, University of Nijmegen, the Netherlands email:
[email protected],
[email protected],
[email protected]
ABSTRACT This paper presents a method designed to select a limited set of maximally information rich speech data from a database for optimal training and diagnostic testing of Automatic Speech Recognition (ASR) systems. The method uses Principal Component Analysis (PCA) to map the variance of the speech material in a database into a low-dimensional space, followed by clustering and a selection technique. It appears that a very straightforward implementation of this procedure automatically detects at least two criteria for a classification of speakers of standard Dutch, viz. gender and the way in which the /r/ is produced. To verify the power of the technique to improve ASR, data sets of equal size selected with this method and obtained randomly were used to train a recognition system on Dutch connected digits. The results show an improvement in the recognition performance when optimal data sets were used, especially for the conditions where the sub-corpora used for training were relatively small.
1. INTRODUCTION Automatic Speech Recognition (ASR) uses speech databases to train or assess speech recognition systems. Databases usually contain speech material from many speakers collected under different conditions [1]. Those conditions can be varied intentionally, but variation may also arise accidentally. Even well controlled recording sessions may yield speech material with a noticeable variety in speaking style, pronunciation, accents, vocal effort, environmental conditions, etc. Consequently, contemporary ASR databases contain a large amount of speech material with variability in basic speech parameters like gender, age or dialect of speakers [2]. The variety of speech material within a database is necessary to cover a wide range of real speech conditions. This variety is also necessary to train or test recognition systems task independently. However, in task specific settings the presence of irrelevant variations degrades recognition performance. The size of speech databases is an important factor in ASR technology. Large databases contain a huge amount of data, but many of these data may belong to the same category, hence have similar acoustic or linguistic properties. Using all of these data is not necessarily cost-effective, because they may not add any additional information that could be important for training or testing. Omitting redundant data and selecting only the informative part, we have a chance to reduce the amount of data and the processing time needed for efficient training or evaluation of speech recognition systems.
In some ASR development and testing tasks, speech databases of limited size have been used successfully due to their specific design. For example small vocabulary databases may use Consonant-Vowel-Consonant (CVC) words to create specific diagnostic speech material. After a manipulation of speech signal parameters, a limited set of speech material can be representative of the assessment of a wide range of recognition systems. This approach was presented earlier for connected word recognition by RAMOS [3]. This paper presents a study for the optimal selection of speech material from a database. The optimal selection should be understood here as selecting a set of speech data that has a small size and is representative of either the entire database or a specific application, depending on the experimental aims. As an alternative to the optimal selection we can consider random selection of data. When the data selected optimally are used for training, we would expect a better performance of a recognition system than the performance obtained for a system trained with a data set of the same size selected randomly. When the data selected optimally are used for evaluation of a recognition system, one would expect reliable results of the assessment, similar to those ones obtained for large testing corpora. Diagnostic information could also be obtained as the test data are related to specific acoustic or linguistic parameters. The goal of this work is to develop a method that allows to find a sample of data that has parametrical properties representative of the other speech data in a database. To capture these properties, the Principal Component Analysis (PCA) of speech data is applied, followed by clustering and a selection technique. We have verified this approach by a series of recognition experiments to check the effectiveness of the method for the optimal selection of training data sets. The paper is organized as follows. Section 2 highlights issues related to variability in speech data. Section 3 presents an experiment for the optimal selection of speech data including a description of the speech material and methods. The results are presented and discussed in Section 4. Section 5 presents the main conclusions and suggestions for further research.
2. VARIABILITY IN SPEECH DATA The assumption that guided the ideas presented in this paper is that an optimal account of the variability in speech data may be more effective than using all the data. For a specific database we know what variability to expect. For example the variability may concern the gender, age or dialect of speakers. This information can usually be found in the specification of a database.
To illustrate the issue of data variability, we may consider a single speech property like gender. In this case the problem seems to be simple, because we intuitively expect only two possibilities: speakers can be female or male. But in a space of acoustic parameters, a complete separation between female and male speakers does not exist [4], [5]. Instead, two classes can be observed that represent speakers that have voices similar to a female or a male voice, respectively. The problem of data variability is also closely related to the accuracy of statistical modeling of speech data. In speech recognition systems based on Hidden Markov Models (HMMs) [8], statistical parameters of models are averaged over features extracted from training data. The type of speech material used to train a recognition system will influence statistical parameters of HMMs and therefore recognition performance. In most cases the problem of data variability has a complex structure. Many parameters are used to characterize speech signals in order to find a complete, physical description of speech. A large number of parameters causes the problem of data variability to become highly multidimensional. However, we can find a more parsimonious representation of speech parameters. Linear techniques for dimensionality reduction give a possibility to reduce the number of parameters while retaining the most significant information about data variability. One of these techniques is the PCA suitable for Gaussian distributed data [6]. Another possible technique is the Independent Component Analysis (ICA) proposed in [7] and aimed to analyze nonGaussian distributed data. Properties of a recognition system based on HMMs imply that we should adhere the assumption of Gaussian distributed data and therefore make use of the PCA.
3. EXPERIMENT This section explains the procedure for the optimal selection of data sets from a database. First the speech material is described, then the data analysis and selection. The design of the experiments in which the effectiveness of the optimal selection was tested is also presented. 3.1. Speech data Speech data used in this experiment come from the Dutch Polyphone database [2]. This speech database contains speech collected from 5050 native speakers. In this study a subset of this database is used, limited to 7646 utterances containing only digits spoken by female and male speakers between 21 and 60 years from 12 provinces of the Netherlands. In this way we obtain a vocabulary of 10 words (digits) and 18 phones. The word-phone dictionary based on SAMPA notation [9] is presented in Table 1. We limited this work to the issue of connected digit recognition to simplify the problem of PCA and reduce the number of free parameters, mainly to assess the procedure in a well-understood environment. For the purposes of the experiment, the data set of 7646 utterances was divided onto 3 subsets: train set (3750 utterances), test set (3099 utterances) used for final evaluation, and development set (797 utterances) used to check a progress of a training procedure. Additionally, we defined a subset of 769 utterances from the train set. This subset consisted of utterances taken randomly from each group of data (see section 3.2.1) in an equal proportion (20%) and was initially used to train a recognition system in order to obtain a forced time aligned transcription of utterances on the state-phone level [8]. This
transcription was used then to form input data (supervectors) for the purposes of PCA. Table 1. The word-phone dictionary of Dutch digits used in the experiment. 0 1 2 3 4
digit nul een twee drie vier
Phones nYl e: n t w e: dri vir
5 6 7 8 9
digit vijf zes zeven acht negen
phones v Ei f zEs z e: v @ Axt n e: x @
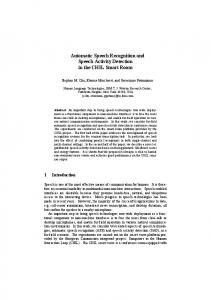
3.2. Methods The same recognition system was trained and tested with identical settings of all relevant parameters. Only different data sets were used for training. The speech recognition system was based on 3-state HMMs, trained for each phone with MFCC features by the Baum-Welch algorithm [8]. 15 MFCC coefficients (c1-c15) were extracted every 10 ms form 16 ms time windows. Cepstral liftering and channel normalization techniques were also applied during the feature extraction. Prior to the cepstral transformation, MEL-scale filtering of signal spectra was performed in 16 bands distributed between the frequency range 80 Hz and 3800 Hz. The number of Gaussian mixture components per state was incremented from 1 to 8 components by a factor of two. The design of the experiment is presented in Figure 1. There are two different ways of selecting the training data. In one case the PCA and classification is used to make an optimal selection of representative training data. In the other case an equally large data set is selected randomly. Finally, each data set is separately used to train a recognition system of fixed parameters in order to compare the recognition performance using an independent test set. The procedure based on the PCA includes steps described in the following sections.
train set
data grouping & creating supervectors
random set
optimal set
PCA
clustering & selection
training & development test
main test
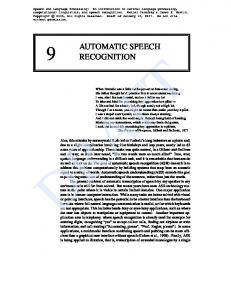
Figure 1. The experimental procedure. 3.2.1 Grouping speech data and creating supervectors From the description of the database, we know the properties of speakers. We decided to segregate utterances of the train set into 48 groups that are combinations of the following speaker properties: gender (female, male), two age ranges (21-40, 41-60 years old), and 12 Dutch provinces. Data from these groups are used to create supervectors. A supervector is a parametrical representation of speech data that will be used for the PCA and classification. We defined a supervector as a vector of 810 variables derived from MFCC features and averaged over the duration of a particular state that was occupied in the HMM of a phone during the forced alignment of speech data. The structure of a supervector is presented in Figure 2. Each supervector
A E phone state s1 s2 s3 s1 s2 s3 coeff. c1 - c15 ... ...
...
z s1 s2 s3
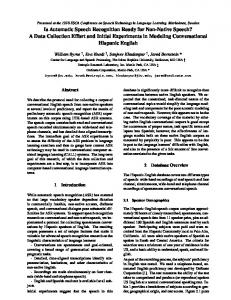
Figure 2. The structure of a supervector. consists of data of 18 phones in a fixed order. A phone segment includes data of 3 states with their 15 MFCC coefficients. Because not every utterance contains all 18 different phones, phones incorporated in a supervector may come from different utterances that belong to the same group of speakers. Hence a supervector is related to the properties of a group and not to the properties of a particular utterance or speaker. In this way we obtained 2112 supervectors from the train set of data, with on average 44 supervectors per group. The present implementation of this method implies certain limitations. When a supervector is a mixture of data from several utterances, then selection of a single supervector will result in more than one utterance to be included in the training data. 3.2.2 PCA and selection of supervectors The principal component analysis was based on the covariance matrix calculated for all supervectors and the first 10 Principal Components (PCs) were computed. Table 2 presents the percentage of variance explained by the first 10 PCs. It can be seen that the first principal component PC1 explains by far the largest portion of the total variance (7.9%). Similar results were obtained in another study [4]. The variance explained by PC1 seems to be low, but considering the fact that supervectors originally had a dimensionality of 810, the average variance of each variable is 0.12%. Although the remaining PCs have relatively low and almost equal variance, we used the first five PCs for clustering and selection purposes. These PCs explain together 12,5% of the total variance in the input data. As a result of the PCA we obtain a new space of speech signal parameters that represent the variability in data in a more compact manner. A projection of supervectors into this eigen space is shown in Figure 3. Points plotted as dots or crosses on the top and bottom graphs of Figure 3 represent observations of female or male supervectors, respectively.
The selection algorithm picked up the required amount of supervectors that were placed in the shortest distance from centroids (see Figure 3). We may consider a centroid as a representative observation of data parameters, and the distance from the centroid as a measure of dissimilarity from this observation.
Table 2. Percentage of variance explained by the first 10 PCs.
4. RESULTS AND DISCUSSION
PC % var
1
2
3
4
5
6
7
8
9
10
7.9 1.5 1.1 1.0 .97 .83 .81 .78 .74 .72
The next step in the procedure deals with clustering of data projected into the principal component space and with selection of supervectors. The number, size and position of clusters was left to the clustering algorithm to decide. The number of clusters was incremented till the average variance weighted within the clusters relative to the total variance of the data did not change by more than 5% between successive splits. The weight of a cluster was defined as a ratio of the number of observations in the cluster to the total number of data. The clustering algorithm looked for the cluster with the dimension of maximum variance weighted. Then, this dimension was split and two new centroids were initially set at a distance of ±0.2 standard deviation from the original one. After each split of a cluster, data were classified again on the basis of the Euclidean distance measure from centroids. Following this method we obtained 4 clusters in the 5 dimensional space (see Figure 3).
Figure 3. The projection of input (top) and 4% selected (bottom) female (dots) and male (crosses) supervectors into first 3 PCs (with the percent of variance explained by PCs in brackets). The middle graphs illustrate the placement of 4 centroids (big crosses) and the range of the selection (circles).
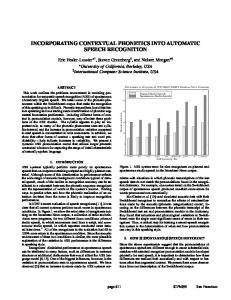
We investigated five cases of selection where 0.5%, 1%, 2%, 4% and 8% percent of all supervectors was optimally selected, what resulted in data sets of 95, 215, 401, 723 and 1198 unique utterances, respectively. Optimal and random data sets of equal size where used then to train the same recognition system. We also checked the recognition performance of the system trained with all utterances from the train set. Figure 4 presents the results of development tests performed after each increase of Gaussian mixture components during the training procedure (plot a, b) and the results of the main test (plot c). The results are represented by the percent of correctly recognized phones (Corr score) and the accuracy (Acc score) that additionally takes into account insertions of phones in scoring recognition results [8]. The results of the PCA show a clear separation of female and male data along the dimension of the biggest variance (7.9%) represented by PC1 (see Figure 3). We can also observe two concentrations of data in the dimension PC2 (1.5% of the variance explained). From the loadings of the raw variables on this dimension it can be inferred that PC2 gets mainly weights
a)
b)
c)
Figure 4. Recognition scores (Corr, Acc) obtained for utterances from the development test (plot a, b) and the main test (plot c) as a function of the number of training utterances selected optimally (solid line) and randomly (dashed line), with respect to the number of Gaussian mixture components per state of HMMs. from the parts of the supervectors that are associated with the phonemes /r/ and /i/. This finding is rather interesting. /r/ in Dutch shows a large variation in articulation, ranging from uvular trill to dental approximant. In the digit vocabulary /i/ appears only as the left or right neighbor of /r/, and its properties are known to be heavily influenced by /r/-coarticulation. The dimension PC3 shows a noticeable difference in a variance of female and male data, but this variation remains to be explained. We noticed that MFCC coefficients of higher order (>5) are helpful to identify the regions of data concentrations. Analyzing the factor loadings of PCs, we found that the three states of the phones have a comparable contribution to the PCA. This will allow us to reduce the size of the supervectors in future experiments. We also found that voiced phones /E/, /Ei/, /e:/, /Y/ (vowels) and /r/, /w/, /z/ (voiced consonants) are related to the variability represented by the dimension PC1 (gender). The results of the recognition experiments show a noticeable advantage in recognition scores when the optimal data sets where used to train the recognition system. The recognition performance showed a ceiling level when the optimal sets of training data had between 401 and 723 utterances. It is striking to see that in the case of optimal selection recognition performance tends to decrease as more training data is added. This unexpected effect needs further analysis. It is less surprising to see that the advantage of optimal over random selection grows as the size of the training data sets decreases. We also observe that Acc scores degraded faster then Corr scores in case of limitation of the number of training utterances, especially in the case of optimal selection. The number of Gaussian mixture components mainly had an impact on the absolute level of recognition performance, which increased in accordance with the number of mixture components. The advantage of optimal selection is also evident for HMMs with a single or small number of Gaussian mixture components.
5. CONCLUSION This paper introduced a method for the optimal selection of speech data from a database. Principal Component Analysis to map the variance in the speech data into a low-dimensional space, clustering and a selection technique were combined to extract a representative sample of training data. We found that this method applied to a commonly used database brought positive results for recognition of Dutch digits. When the size of
a training corpus was limited, the optimal selection of training data maintained recognition performance despite the reduction of the size of the training corpus. Moreover, it appeared that the approach succeeded in detecting a source of variation in standard Dutch that cannot be traced back to any of the well-known social or demographic variables, viz. the pronunciation of the /r/, which can be an uvular trill of a dental approximant. Future research will first of all investigate the suggestion that it may be profitable to leave out the least representative speakers or utterances from a training database. We will also investigate the possibility to improve utterance and speaker selection by performing the clustering and selection in another feature space (e.g. MEL spectra instead of cepstra). In addition, we also plan to focus on the use of the tool to support error analysis of a test corpus. In this way we hope to get diagnostics on the placement of error data in the principal component space. We also plan to expand the study to other speech databases, and especially focus on databases that allow to control the inter-speaker variability.
REFERENCES [1] R. P. Lippmann, “Speech recognition by machines and humans”, Speech Communication 1997, vol. 22, pp. 1-15 [2] E. A. den Os et al., “The Dutch Polyphone Corpus”, Eurospeech 1995, vol. 1, pp. 825-828 [3] H. J. M. Steeneken et al., “RAMOS - Recognizer Assessment by means of Manipulation Of Speech”, Eurospeech 1989, vol. 2, pp. 316-319 [4] Ch. Huang et al., “Analysis of speaker variability”, Eurospeech 2001, vol. 2, pp. 1377-1380 [5] R. Kuhn et al., “Rapid speaker adaptation in eigenvoice space”, IEEE Speech & Audio Processing 2000, vol. 8, no. 6, pp. 695-707 [6] I. T. Jolliffe, “Principal Component Analysis”, SpringerVerlag, Berlin 1986 [7] A. Hyvärinen et al., “Independent Component Analysis: algorithms and application”, IEEE Neural Networks 13, 2000, pp. 411-430 [8] S. Young et al., “The HTK Book ver. 3.0”, Cambridge University 2000 [9] http://www.phon.ucl.ac.uk/home/sampa/home.htm