13th World Conference on Earthquake Engineering Vancouver, B.C., Canada August 1-6, 2004 Paper No. 2903
OPTIMISED ARRAY DESIGN FOR MICROTREMOR ARRAY STUDIES APPLIED TO SITE CLASSIFICATION; COMPARISON OF RESULTS WITH SCPT LOGS. Authors: Michael W. ASTEN1, Trevor DHU2 and Nelson LAM3 SUMMARY The microtremor method (MTM) using spatial autocorrelation (SPAC) processing is a useful tool for gaining thickness and shear wave velocity (SWV) of sediments. These parameters are essential for site response modeling and regolith classification for earthquake hazard and risk assessments. Complications arise if the wave field is strongly directional (ie. insufficiently averaged in azimuth) or contains multiple Rayleigh modes. Theoretical studies compare the use of triangular, hexagonal and semi-circular arrays and show how the latter is preferable in the presence of strongly directional seismic noise, while the hexagonal array is superior in maximising the range of detectable wavelengths. Both hexagonal and semicircular arrays can identify multiple-mode wave propagation. Observed coherency-frequency curves are inverted in coherency space (without the intermediate step of obtaining a dispersion curve from field data) to yield a profile of SWV and layer thicknesses to depths up to one hundred metres. The MTM using SPAC has achieved a precision of +-10% or better in the Vs30 zone of unconsolidated but moderately homogeneous sediments. The results show a good to strong correlation with seismic cone penetrometer tests (SCPTs) from Perth (Western Australia). Moreover, the microtremor data has an additional advantage of being capable of non-invasively detecting the base of sediments where the SCPT method fails in coarse gravels. MTM combined with SPAC has the potential to provide SWV profiles of soils and near-surface basement rocks, suitable for input into a site response model. INTRODUCTION The background to the microtremor method (MTM) used for estimating shear-wave velocities (SWVs) has been reviewed by many authors (eg. Tokimatsu [1]; Asten [2]; Okada [3]; Asten, [4]). Microtremors are the background movement of the earth attributable to non-seismic sources. In the frequency band of interest in this study (1 to 30 hz), sources are principally cultural noise such as vehicle traffic and industrial machinery. For studies in metropolitan areas, the MTM is especially useful as the seismic noise 1
Centre for Environmental and Geotechnical Applications of Surface Waves (CEGAS), School of Geosciences, Monash University, Melbourne Australia. Email:
[email protected] 2 Geoscience Australia, Canberra Australia. Email:
[email protected] 3 CEGAS, Dept. of Civil Engineering, Univ. of Melbourne, Australia Email:
[email protected]
which degrades active seismic methods (such as seismic reflection and refraction surveys) provides a plentiful source of energy for passive seismic methods. Microtremor seismic energy propagates primarily as surface waves, with the majority of the energy in the fundamental mode. Vertical-component geophones will detect only Rayleigh waves, while horizontalcomponent instruments detect both Rayleigh and Love modes. See Asten [5, 2] Asten and Dhu [6] and Okada [3] for reviews of studies of the modes of microtremors. Microtremor studies using threecomponent arrays of geophones have been reported by Chouet [7] and Okada [3] but the use of verticalcomponent SPAC processing remains the most common approach. The fundamental Rayleigh mode generally dominates high-frequency microtremor energy, and the basic spectral ratio method of site classification, as well as more sophisticated interpretation tools such as the spatial autocorrelation or spatially averaged coherecy (SPAC) method, assume energy is confined to this single mode. However, this restriction is not always the case, and higher modes can be identified, both in the spectra shown in this paper, and in measured propagation velocities (eg Asten [2]; Bodin [8]; Asten [9]). Higher modes of surface-wave propagation have the potential to influence both measured microtremor spectra and measured propagation velocities, both of which affect the interpretation of regolith thickness and geotechnical properties. The majority of studies using microtremor wave-fields can be placed into two groups, specifically: single station spectral methods, and array studies where the propagation velocity is sought. In the first group, the use of single-station horizontal/vertical spectral ratios (HVSR) of seismic microtremors is now a standard tool for calculating natural site period. This natural period can then be used in regolith site classification for earthquake hazard and risk studies (Nakamura [10]; Field and Jacobs [11]; Lermo and Chavez-Garcia [12]; Lachet and Bard [13]; Ibs von Seht and Wohlenberg [14]). Plots of spectral ratio against period may show multiple peaks which may be loosely described as harmonics of shear-wave resonances (Bodin et al[8]), but can be more rigorously analysed in terms of higher-mode Rayleigh-wave propagation (Asten [9]) . In the second group of studies, array methods are used to measure the phase velocities of microtremor energy. The most successful results from array studies of high-frequency microtremors (> 1Hz) have been achieved using the SPAC method first described by Aki [15]. The strength of SPAC techniques is that they are effective in yielding wave scalar velocity when the wave field is multi-directional or omnidirectional. In contrast, beam-forming methods as used by eg. Capon [16], Liu et al [17], and Satoh et al [18], lose resolution when multiple sources are present, even when waves are restricted to a single mode. In this paper we study five array types in order to develop criteria for assessing the effectivness of the spatial averaging process, and to recognise features of field data which indicate when assumptions of spatial averaging have been violated with adverse effects on accuracy of phase velocity estimates. We then apply the SPAC method to three samples of field data where known geology allows a assessment of the accuracy of a novel inversion method for SPAC data, performed in coherency space rather than velocity space. Finally we consider the implications of this tool for earthquake risk and site response studies. ARRAY GEOMETRIES Critical to the success of the SPAC method is the effectiveness of spatial averaging achieved by the combination of array geometry and distribution of sources. In this paper we review some properties of five array types in order to develop criteria for adequacy of the spatial averaging process, and to recognise
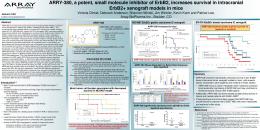
features of field data which indicate when assumptions of spatial averaging have been violated with adverse effects on accuracy of phase velocity estimates. The classic array shapes reported in literature are triangular three or four-station arrays shown in Figure 1 (a-b). Asten [5, 2], Asten et al [20] and Asten et al [21] use a seven-station hexagonal array (Figure 1c) in order to improve spatial averaging and provide measurements over multiple inter-station separations. More dense arrays of up to 36 stations in a semi-circular geometry have been used by Chouet et al [7] (and references therein), for the study of surface-wave propagation near volcanoes. However, this sophistication of design is rarely possible in microtremor surveys intended to cover multiple sites. Ohori et al [19] used a linear cross array which can be approximated for the purpose of this study as a fivestation square array (Figure 1d) or as a right-angled triangle. This paper also considers a semi-circular array of seven stations (Figure 1e) representing a simplification of that described by Chouet et al [7].
(a)
(b)
r1 r
(a),(b): triangular arrays.
r2
r2
(c)
r4
r1 r3
(d)
r1
Fig. 1. Common array geometries used for microtremor studies using SPAC methods.
(c ): hexagonal array. (d): square or linear cross array. (e): semi-circular array.
(e)
r1
r2 r2 MODELLING SPAC
The process of modelling SPAC for an azimuthal distribution of noise-free plane waves, as observed by a set of geophone pairs distributed in azimuth, may be expressed as a summation of complex coherencies c (f) of amplitude unity, and phase given by c (f) = exp { i rk cos(θ - φ) } , where r is the displacement of one geophone relative to a reference geophone, at azimuthal angle θ, k is the spatial wavenumber at frequency f, and φ is the azimuth of propagation of the plane wave across the array. In the ideal case of a single plane wave observed by an infinity of geophones placed around a circle centred on a single reference geophone, the summation is expressed as an integration which yields a purely real SPAC, given by Okada [3], equ. 3.72, as
1 2π
∫
2π 0
exp { irk cos (θ − φ ) }dθ = J 0 (rk )
- (1)
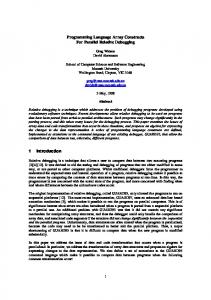
where J0 is the Bessel function of the first kind of zero order with the variable rk. The same result will be obtained for omni-directional plane waves (an infinity of azimuths) observed by a single pair of geophones (ie integrate over φ with θ fixed). In this study we investigate the quality of this approximation when the plane wave sources are restricted to a range of azimuths ∆ (where ∆ < 90o), and a finite number of n geophones equi-spaced around a circle or semi-circle. For simplicity the azimuthal range is approximated in this study by a finite set of propagation directions at intervals of 1o over the range ∆. We make the strict assumption that wave energy at any frequency propagates at a single scalar velocity (commonly the fundamental Rayleigh mode for verticalcomponent microtremor energy). The left-hand side of equ (1) thus becomes a double summation over a finite number of plane waves, and n geophone pairs. The averaged coherency is in general a complex number, hence we compare both the real and imaginary parts of the summation with the theoretical ideal of the function J0. We also assume for the purpose of simplicity in modelling that the scalar wave velocity is constant with respect to frequency; this assumption in not true in practice, but it does not affect the SPAC method or the conclusions of this study since SPAC averaging is applied to each frequencywavenumber independently. Figure 2 shows modelled SPAC wave-number spectra for the case of a square cross array, where the incident wave-field is narrow in azimuthal spread (∆ = 5o) from four different azimuths (0o to 30o).
Fig. 2. Modelled SPAC for n=2, ∆ =5o, for four different dominant directions of wave propagation. The solid line is Real (c(f)), dashed line is Im (c(f)), and the thin solid line is theoretical Jo(kr). At the top right of each plot is a diagram of the array geometry (centre plus two geophones only in this case) together with an arc depicting the range of wave azimuths summed in the model. The modelled SPAC curve overlays the plot of the theoretical Jo(kr) curve for kr