Journal of Physics: Conference Series
PAPER • OPEN ACCESS
Optimization of fuzzy inference system by using table look-up method to predict white sugar price in the international market To cite this article: N Azizah et al 2018 J. Phys.: Conf. Ser. 1097 012074
View the article online for updates and enhancements.
This content was downloaded from IP address 139.81.205.128 on 12/10/2018 at 13:20
ICRIEMS 5 IOP Conf. Series: Journal of Physics: Conf. Series 1097 (2018) 1234567890 ‘’“” 012074
IOP Publishing doi:10.1088/1742-6596/1097/1/012074
Optimization of fuzzy inference system by using table look-up method to predict white sugar price in the international market N Azizah1, K A’yun2, T W Septiarini3, D U Wutsqa4 and A M Abadi4 1
Graduate Programs of Mathematics Education Yogyakarta State University, Kolombo Street 01, Sleman, Yogyakarta, Indonesia 2 Graduate Programs of Mathematics Gadjah Mada University, Sleman, Yogyakarta, Indonesia 3 Departments of Mathematics and Computer Science, Faculty of Science and Technology, Prince of Songla University, Pattani, Thailand 4 Mathematics Department, Faculty of Mathematics and Science Yogyakarta State University, Kolombo Street 01, Sleman, Yogyakarta, Indonesia
[email protected] Abstract. The study aims to investigate the most optimum rules of fuzzy inference
systems to forecast the white sugar price in the international market. The fuzzy rules are optimized by using a table look-up method. As a comparison, we also employ fuzzy time series methods that developed by Chen, Singh, and Heuristic. The main differences among the four methods are on the inputs determination for prediction and on the algorithm to calculate the prediction. The performance of the method is evaluated using MAPE (Mean Absolute Percentage Error). The MAPE values of white sugar price forecasting yielded by a fuzzy inference system with table lookup are 2.83 % on training data and 7.66 % on checking data. Furthermore, the MAPE values resulted by fuzzy time series model of Chen, Singh, and heuristic are 8.52%, 8.62% and 8.01% on training data, and 6.44%, 6.47%, and 6.44% on checking data, respectively. The table lookup delivers the highest performance on the training data, while it delivers the lowest performance on checking data. However, the fluctuation of its forecasts is more reasonable, since it follows the fluctuation of the actual data, while the other three methods deliver constant forecasts which are not reasonable. 1. Introduction White sugar is a commodity which has an important role in the world. It produces a lot of income for many countries. White sugar industries can absorb many workers. In Indonesia, white sugar becomes one of the strategic economic commodities. Historical records showed that the white sugar became the oldest and leading industry since the days of colonialism the pre-World War II era of 1930-1940, and Java became one of the largest white sugar producers in the world, as well as the second largest exporter of white sugar after Cuba. The on-peak production was achieved in 1931 with 3 million tons per year and approximately 2.40 million tons is exported. At that time, a total of 179 white sugar mills were operated in the Indonesian territory with productivity levels reached 14.80 tons of white sugar per
Content from this work may be used under the terms of the Creative Commons Attribution 3.0 licence. Any further distribution of this work must maintain attribution to the author(s) and the title of the work, journal citation and DOI. Published under licence by IOP Publishing Ltd 1
ICRIEMS 5 IOP Conf. Series: Journal of Physics: Conf. Series 1097 (2018) 1234567890 ‘’“” 012074
IOP Publishing doi:10.1088/1742-6596/1097/1/012074
hectare or 130 tons of white sugarcane per hectare [1]. Nevertheless, white sugar market conditions and the Indonesian white sugar industry are not always running well. White sugar prices in the international market continued to decline to the lowest point in 1999. This gave a negative effect to the white sugar industry in Indonesia. The decline of white sugar prices is mainly due to almost all major producing countries and major consumers making substantial interventions to the white sugar industry and trade [1]. It clearly shows that the price of white sugar in the international market has a major impact on the development of the white sugar industry in the country. Therefore it is important to know the international white sugar price, so we can prepare the planning of production and protection efforts to guarantee the stability of domestic white sugar industry. White sugar price data are published every month, so it corresponds to time series data. Predicting white sugar price in the international market can be done through various time series forecasting methods. The very famous classical method is an Autoregressive Integrated Moving Average (ARIMA). Now, many researches develop methods using soft computing approach. These approaches include a neural network (NN), a fuzzy inference system, and a combination of neural network and fuzzy logic which is called neuro fuzzy method. Predicting consumer price index of education, recreation, and sports in Yogyakarta [2], foreign tourist flows to Yogyakarta [3] and Islamic Month calendar effect in tourism data of Prambanan temple [4] have applied neural network, and predicting number of train passengers in Yogyakarta [5] has applied neuro fuzzy. The fuzzy inference system has been used for predicting silver prices [6], the number of fertilizers ordered [7], and the production of pottery souvenir [8]. The fuzzy inference system can also be used not only for time series prediction, but also can be used for classification the tomatoes ripeness [9], and for decision making in the selection of the used car in Sleman Yogyakarta [10]. A specific fuzzy application on time series data is known as fuzzy time series. Many researchers have developed fuzzy time series models to predict many things [11], such as predicting Jakarta Composite Index [12], the number of Trans Jogja passengers [13], stock price of Bank Mandiri (Persero) Tbk (BMRI.JK) [14] and enrollment at the Alabama University [15-18]. Some of the methods that can be used in fuzzy time series are Chen [16], Heuristic [17] and Singh[18, 19]. In this study, we construct a fuzzy inference system model in predicting white sugar price in international markets. The problems in fuzzy inference system are the determination of the number of the rules and the selection of the rules involved in the system. Here, we employ lookup tables to solve those problems. The fuzzy inference system consists of four main components: fuzzification, rules, inference, and defuzzification [20]. The proposed model is compared to the fuzzy time series analysis of Chen, Heuristic, and Singh methods. The comparison is based on the Mean Absolute Percentage of prediction resulted from the method. 2. Fuzzy time series analysis Fuzzy time series is a forecasting method using time series data. Some of the methods that can be used in the fuzzy time series are Chen[16], Heuristic[17], and Singh [18, 19]. These three methods have similarities in the procedure of compiling the system but have differences in the number of inputs involving in the models, and calculation algorithm. The procedure for preparing the system is (1) Define the universe of discourse and the intervals of the input-output variables; (2) Define the fuzzy sets and fuzzify the data of the input-output variables; (3) Define the fuzzy relationships by rules; (4) Forecast [16-19]. The first difference of the three methods is in the input determination. Chen method is a first order fuzzy time series model [16]. Let 𝑥𝑥𝑡𝑡 represents the time series variable at time t. In Chen method, the variable at time lag 𝑡𝑡 − 1 denoted as 𝑥𝑥𝑡𝑡−1 is set as the influencing factor of 𝑥𝑥𝑡𝑡 [18]. The heuristic method is basically a fuzzy time series first order model similar to the Chen model and has easy calculations and better estimates. In a Heuristic model, domain-specific knowledge (or heuristics) is integrated with the Chen model to increase estimates [17]. The Singh method is a fuzzy time series of third order models, this means we predict the value of variable 𝑥𝑥𝑡𝑡 by using the values of variables at time lag 𝑡𝑡 − 1 , 𝑡𝑡 − 2 , and 𝑡𝑡 − 3 denoted as 𝑥𝑥𝑡𝑡−3 , 𝑥𝑥𝑡𝑡−2 and 𝑥𝑥𝑡𝑡−1 [18, 19]. 2
ICRIEMS 5 IOP Conf. Series: Journal of Physics: Conf. Series 1097 (2018) 1234567890 ‘’“” 012074
IOP Publishing doi:10.1088/1742-6596/1097/1/012074
The differences of Chen method with other methods is in the process of calculation algorithm. The calculation by using Chen method needs to consider the following conditions (1) If the fuzzified data of year 𝑖𝑖 is 𝐴𝐴𝑗𝑗 , and there is only one fuzzy logical relationship in the fuzzy logical relationship groups in which the current state of the data is 𝐴𝐴𝑘𝑘 , which is shown as follows 𝐴𝐴𝑗𝑗 → 𝐴𝐴𝑘𝑘 , where 𝐴𝐴𝑗𝑗 and 𝐴𝐴𝑘𝑘 are fuzzy sets and the maximum membership value of 𝐴𝐴𝑘𝑘 occurs at interval 𝑢𝑢𝑘𝑘 , and the midvalue of 𝑢𝑢𝑘𝑘 is 𝑚𝑚𝑘𝑘 , then the forecasted data of year 𝑖𝑖 + 1 is 𝑚𝑚𝑘𝑘 ; (2) If the fuzzified data of year 𝑖𝑖 is 𝐴𝐴𝑗𝑗 , and then are the following fuzzy logical relationships in the fuzzy logical relationship groups in which the current states of the fuzzy logical relationships are 𝐴𝐴𝑗𝑗 , respectively, which is shown as 𝐴𝐴𝑗𝑗 → 𝐴𝐴𝑘𝑘1 , 𝐴𝐴𝑗𝑗 → 𝐴𝐴𝑘𝑘2 , … , 𝐴𝐴𝑗𝑗 → 𝐴𝐴𝑘𝑘𝑘𝑘 where 𝐴𝐴𝑗𝑗 , 𝐴𝐴𝑘𝑘1 , 𝐴𝐴𝑘𝑘2 , … , 𝐴𝐴𝑘𝑘𝑘𝑘 are fuzzy sets, and the maximum membership values of 𝐴𝐴𝑗𝑗 , 𝐴𝐴𝑘𝑘1 , 𝐴𝐴𝑘𝑘2 , … . 𝐴𝐴𝑘𝑘𝑘𝑘 occur at intervals 𝑢𝑢1 , 𝑢𝑢2 , … , 𝑢𝑢𝑝𝑝 , respectively, and the midvalue of 𝑢𝑢1 , 𝑢𝑢2 , … , 𝑢𝑢𝑝𝑝 are 𝑚𝑚1 , 𝑚𝑚2 , … , 𝑚𝑚𝑝𝑝 , respectively, then the forecasted data of year 𝑖𝑖 + 1 is �𝑚𝑚1 + 𝑚𝑚2 + … + 𝑚𝑚𝑝𝑝 �⁄𝑝𝑝; and (3) If the fuzzified data of year 𝑖𝑖 is 𝐴𝐴𝑗𝑗 , and there do not exist any fuzzy logical relationship groups whose current state of data is 𝐴𝐴𝑗𝑗 , where the maximum membership value of 𝐴𝐴𝑗𝑗 occurs at interval 𝑢𝑢𝑗𝑗 , and the midvalue of 𝑢𝑢𝑗𝑗 is 𝑚𝑚𝑗𝑗 , then the forecasted data of year 𝑖𝑖 + 1 is 𝑚𝑚𝑗𝑗 [16]. Slightly different from Chen method, the calculation in Heuristic method still uses the same principle as in Chen method. This study assumes that there is a heuristic knowledge showing the increase or decrease of data for the next year. With this characteristic, the Heuristic model yields better prediction than the other models [17]. Meanwhile, Singh method has considerable differences in the computational algorithm as illustrated in the process of rule arrangement for forecasting enrollment in the University of Alabama. Before forecasting, the fuzzification process of actual data is performed and established logical fuzzy relations using rules “If 𝐴𝐴𝑖𝑖 is the fuzzy production of year 𝑛𝑛 and 𝐴𝐴𝑗𝑗 is the fuzzify production of year 𝑛𝑛 + 1, then the fuzzy logical relation is denoted as 𝐴𝐴𝑖𝑖 → 𝐴𝐴𝑗𝑗 . Here 𝐴𝐴𝑖𝑖 is called current state and 𝐴𝐴𝑗𝑗 is next state” [18].
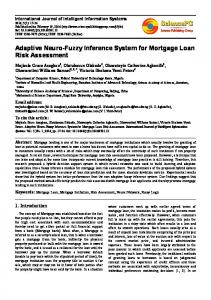
3. Fuzzy inference system Fuzzy inference system (FIS) is a system that can be used to forecast the time series data. Fuzzy inference system has three important points to note, they are setting of the input-output variables, the fuzzy set defined in the input-output variables and the rules used in the inference [21]. In fuzzy systems, the fuzzy membership functions of input and output parameters are determined based on the survey results of a particular area and with the help of expert knowledge [21]. Furthermore, a set of if-Then fuzzy rules is used to represent the structure of the fuzzy model. The fuzzy rule has two elements, antecedent and the consequence. The antecedent variable contains information about the operating conditions of the process. The consequence is an element to show the model validity for given operating conditions [22]. Lookup tables are used in the rule formation process. In this study, the process of predicting the white sugar price in the international market is illustrated in Figure 1.
Figure 1. Fuzzy Inference System
3
ICRIEMS 5 IOP Conf. Series: Journal of Physics: Conf. Series 1097 (2018) 1234567890 ‘’“” 012074
IOP Publishing doi:10.1088/1742-6596/1097/1/012074
The lookup tables are developed through five steps i.e (1) Define fuzzy sets that is cover the input and output spaces, (2) Develop rule from one input-output pair, (3) Assign a degree of every rule generated in step 2, (4) Create the fuzzy rule to forecasting and (5) Construct the fuzzy system based on the fuzzy rule base [23]. In the compiled model, each rule has the same weight so that step 3 is not performed. The building of a fuzzy system proceeds as follows. Step 1: Determine the system of inputs and output. The number of inputs in the forecast depends on the parameters model used. At this step, the inputs are set based on the time series theory. The data are further split into training data (TRD) and checking data (CHD). Training data serve to build the system, checking data intend to check the system that has been made [23]. Step 2: Determine the universal set of inputs and output. The set of universes in this model is determined by 𝑈𝑈 = [𝐷𝐷𝑚𝑚𝑚𝑚𝑚𝑚 − 𝐷𝐷1 , 𝐷𝐷𝑚𝑚𝑚𝑚𝑚𝑚 − 𝐷𝐷2 ] where 𝐷𝐷1 and 𝐷𝐷2 are two proper positive numbers. It is important to note that the universal set compiled contains all the data that will be used for predicting[23]. Step 3: Define the fuzzy set membership function on inputs and output. In this model, the membership functions used in the inputs and output are the pseudo-trapezoid membership function [23]. Step 4: Define fuzzy rules by following five steps in lookup tables. After fuzzification, then the rules are made. The established rules represent the relationship between input and output. Each rule is in implication form. The operator used to connect between two inputs is the AND operator, and that maps between input-output is IF-THEN. Propositions that follow the IF are called antecedents, whereas the propositions that follow THEN are consequent. In the process of making the rules, if we find several rules with the same antecedents producing different consequences, we need reduce the rule by taking the highest degree of membership of the rule [23]. Step 5: Perform the Mamdani inference. Mamdani inference uses min implication function and composition between max rules. In the min implication function, it will be taken the minimum value of the fuzzy set of each rule. The inference is done through formula (1) [23]. (1) Step 6: Perform defuzzification with the center of gravity defuzzifier method. The fuzzy set obtained from the inference process will be changed using the defuzzifier to be a crisp set. The centroid defuzzifier is expressed as[23]. 𝑦𝑦 ∗ =
∫𝑉𝑉 𝑦𝑦𝜇𝜇𝐵𝐵′ (𝑦𝑦)𝑑𝑑𝑑𝑑 ∫𝑉𝑉 𝜇𝜇𝐵𝐵′ (𝑦𝑦)𝑑𝑑𝑑𝑑
(2)
where 𝜇𝜇𝐵𝐵′ (𝑦𝑦) is a fuzzy set membership function after inference. The white sugar price prediction in international market 𝑥𝑥�(𝑡𝑡) is the crisp set obtained using formula (2).
4. Research method This study is conducted to see how fuzzy inference system by using a look up table can predict the price of white sugar on the international market. The data of white sugar prices in the international market in USD / Ton are published by the Ministry of Trade of the Republic of Indonesia [24]. The procedure of fuzzy inference system by using a look up table is performed using all the steps described above. The prediction accuracy of the fuzzy inference system by using a look up table is compared to the prediction accuracies of Chen, Heuristic, and Singh methods. The proposed method to predict the white sugar price is constructed based on theories in time series analysis, and then perform the fuzzy inference system by using a look up table. The steps are presented in the flowchart in Figure 2.
4
ICRIEMS 5 IOP Conf. Series: Journal of Physics: Conf. Series 1097 (2018) 1234567890 ‘’“” 012074
IOP Publishing doi:10.1088/1742-6596/1097/1/012074
Figure 2. Proposed Method Procedures In time series analysis, a data stationary is a required assumption to obtain the proper model. So, we need to check the data stationary before the prediction process. A time series data is said to be stationary if the mean, covariance and variance are constant over time. The stationary test is done by the Augmented Dickey Fuller (ADF) test [25]. In the Augmented Dickey Fuller test, the data are stationary if the p-value