Mar 13, 2006 - Sensingâ, (submitted), 2006. [Technical report version available at https://www.ee.washington.edu/techsite/papers/documents/UWEETR-.
This full text paper was peer reviewed at the direction of IEEE Communications Society subject matter experts for publication in the ICC 2007 proceedings.
Optimizing Throughput with Carrier Sensing Adaptation for IEEE 802.11 Mesh Networks Based on Loss Differentiation Hui Ma, Soo Young Shin, Sumit Roy Dept. of Electrical Engineering University of Washington, Box 352500 Seattle, WA 98195-2500 {mahui,wdragon,roy}@ee.washington.edu
Abstract— In high density (HD) mesh networks, packet losses can occur due to co-channel interference (asynchronous interference) or collisions (synchronous interference). In this paper, we first propose a novel method of estimating the probability of collision and interference statistically. Further, we integrate this differentiation method with physical carrier sensing adaptation in a novel centralized algorithm to improve the aggregate throughput in HD mesh network. Extensive simulations results show that the on-line algorithm approaches the optimal throughput predicted by analytical models. Index Terms— Physical Carrier Sense, Mesh Networks, AdHoc, Contention Window Size, Adaptation
I. I NTRODUCTION Wireless networks at the ‘edge’ are proliferating both in numbers and scale. In the next generation networks, ad hoc mesh (or multihop) networks are likely served as an intermediary that provides broadband connectivity to the backbone Internet for mobile client devices in various environments such as campus, office and home. The proliferation of consumer electronic and wireless-enabled mobile computing devices will continually increase the node density that must be supported by such mesh networks. In such dense environments, exploiting the limited system bandwidth available via spatial reuse becomes a key to improving the aggregate network throughput. Physical carrier sensing (PCS) with tunable thresholds (PCS threshold) is proven to be an efficient method for managing mutual interference from simultaneous co-channel transmissions in a mesh network [1], [2], [3]. Here, each node samples the energy level in the medium and initiates channel access only if the received signal strength is below the PCS threshold. PCS with variable threshold has been shown to yield better aggregated throughput comparing to the static PCS threshold in IEEE 802.11 [11]. Zhu et al. [1] derived the optimal PCS threshold that maximizes the aggregate one-hop throughput for a regular topology given a minimum required SNR; an adaptive PCS threshold algorithm was suggested based on periodic measurement of Packet Error Rate (PER) and evaluated on a real test-bed in [2]. A novel analytical model was introduced This work was supported in part by Intel Corpn. and T-Mobile USA.
in [3] for determining the optimal carrier sensing range by minimizing the sum of the hidden terminal event and exposed terminal event. It was shown that an optimal PCS threshold achieves a trade-off between the amount of spatial reuse and the PER due to hidden terminals, thereby improving the overall network throughput. Hence, real-time measurement of the effect of hidden terminals is the key towards design of effective adaptation algorithms in high density (HD) mesh networks. In a HD mesh network, the probability of collisions (apart from asynchronous interference) is significant, because of potentially simultaneous transmissions starting in the same time slot. Any adaptation scheme that does not consider these collisions can lead to lower-than-optimal aggregate throughput or even diverge in extreme conditions. Therefore, in the design of adaptation algorithm for HD mesh, determining the cause of the packet losses (e.g. differentiation of measured PER into those resulting from hidden terminals and collisions, respectively) is one of the primary challenges. The above is particularly difficult because the typical response to a packet transmission is coarse (binary): in ACK based systems, the transmitter only knows success/failure and not the cause of losses. There has been several attempts to distinguish the cause of packet losses in wireless networks. For example, [4] relies on request-to-send/clearto-send (RTS/CTS) exchange in 802.11 for differentiation. However, RTS/CTS suffers from inefficiency and fundamental limitations in spatial reuse [1] [8]. In [5], all stations broadcast their transmission time for the failed transmissions, which contributes to additional communication and processing overhead. Exploiting the capture effect was proposed in [6] for detecting collisions, which requires re-designing the receive chain in the IEEE 802.11 hardware. In [7], although a novel loss differentiation MAC was proposed, it required a new MAC frame, thereby compromising compatibility with existing IEEE 802.11 standard. Therefore, there continues to exist a need for low-overhead, robust yet accurate loss differentiation method for IEEE 802.11 HD mesh networks. In this paper, we contribute a
1-4244-0353-7/07/$25.00 ©2007 IEEE
This full text paper was peer reviewed at the direction of IEEE Communications Society subject matter experts for publication in the ICC 2007 proceedings.
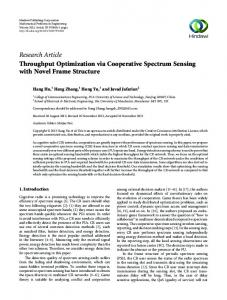
novel idea to distinguish and estimate the probability of collision and interference. This method is fully compatible with IEEE 802.11 standard and does not need any physical layer modifications, nor does it incur overhead such as RTS/CTS. The innovation is based on the following insight obtained from multiple OPNET [9] simulations: the loss probability due to interference was found to be insensitive to CWmin (min. contention window size used for collision resolution) in HD mesh. Based on this observation, an algorithm is proposed to estimate the probability of interference and collision for each individual link and subsequently used to tune PCS threshold and contention resolution mechanism respectively. Extensive simulations results show that the adaptive tuning with loss differentiation can always make the PCS threshold converge to its optimal value. The rest of this paper is organized as follows. We first discuss the method of classification of collisions and interference in this paper. Next, we study the statistical characteristics of collisions and interference via OPNET simulation and propose the new PCS adaptation algorithm. We conclude the paper with a suite of performance evaluation experiments and allied discussions. II. C LASSIFICATION OF PACKET L OSSES In this paper, the packet losses are classified into two categories such as collision and interference, which are illustrated in Fig. 1:
Signal Packet Interference Received Power
Start Time
a) Interference 1 Signal Packet Interference b) Collision Signal packet Interference c) Interference 2
Fig. 1.
Illustration of different packet losses
1) Collision (Synchronous Interference): one or several concurrent packets start at the same time slot and they cause the reference (signal) packet to be corrupted. Collision events are denoted by C. 2) (Asynchronous) Interference 1: In the absence of C, if the receive signal strength prior to the reference packet arrival is strong enough to cause the reference packet to be dropped; this event is considered as Interference Type 1, and is denoted by I1. 3) (Asynchronous) Interference 2: In the absence of C and I1, the sum of one or more subsequent arriving packets can cause the reference packet to be corrupted; this is Interference Type 2 and is denoted by I2.
TABLE I S IMULATION SET- UP TO STUDY STATISTICAL CHARACTERISTICS IN IEEE 802.11 A
Channel frequency (GHz) Link distance (m) Packet size (bytes) Link data rate (Mbps) Transmission power (mW) Path loss exponent γ CWmin CWmax Retry Limit RTS/CTS mechanism Number of S-R pairs
5.18 10 1500 or 300 12 or 48 1 (γ = 2) or 30 (γ = 3.5) 2 or 3.5 15, 31, 63, 127 and 511 1023 7 Disabled 10, 30, 50 or 100
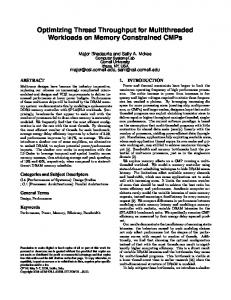
Note that asynchronous link-layer interference has been divided into two sub-categories: event I1 refers to inference prior while event I2 denotes interference after arrival of reference packet. Both of them are referred as hidden terminal problem in the literature. The event due to asynchronous interference, including both I1 and I2, will be denoted by I. Second, some packet losses may be caused by both asynchronous and synchronous interference. Since it is difficult to separate the precise cause in such cases, they will be only classified into collisions for convenience. III. S TATISTICAL C HARACTERISTICS OF C OLLISIONS AND I NTERFERENCE IN HD M ESH N ETWORKS In this section, we study the statistical characteristics of collisions and interferences. Energy detection based PCS is assumed and simulated in this paper. The simulations are carried out in OPNET using the modified physical carrier sensing module [10] developed in [3]. Loss differentiation is inserted into the OPNET physical layer model to carefully examine the timing of the receptions of two or more packets. The cause of packets loss is determined by comparing SNIR (Signal to Noise and Interference Ratio) of all segments in a frame to some preset threshold, S0 , determined by the data rate. A. Simulation Set-up In the simulation, random ad-hoc networks will be used; all source nodes are first located randomly with uniform distribution over a 100m x 100m square area. Each transmitter then sends saturated traffic to its dedicated receiver, which is located in a randomly selected direction with 10 m separation distance. The node density in the network will be varied by changing the number of sender and receiver (S-R) pairs. Fig. 2 (a) shows the network topology of a 50-pair mesh network. The reception sensitivity was set such that the reception range was 10 m; thus a receive node can only receive packets from a source upto a maximum distance of 10 m. Different PCS threshold and CWmin will be used in the simulations to study the statistical characteristics of collisions and interference. The other parameters used for the simulations are listed in
This full text paper was peer reviewed at the direction of IEEE Communications Society subject matter experts for publication in the ICC 2007 proceedings.
50−Pair Random: 12Mbps, packet size=1500Bytes γ=2 1 CWmin=15 Pr{C} CWmin=15 Pr{I}
50
Throughput of CWmin127 Throughput of CWmin15
CWmin=127 Pr{C} CWmin=127 Pr{I} 0.8
40
CWmin=511 Pr{C}
0.6
0.4
20
0.2
10
0 −16
(a) Network topology Fig. 2.
30
Throughput of CWmin511
−14
−12
−10
−8
−6
−4
Normalized PCS Threshold θ (dB)
−2
0
Throughput (Mbps)
Probablity
CWmin=511 Pr{I}
0
(b) Differentiated loss probabilities and throughput of the whole network as a function of PCS Threshold Network
Simulations for differentiating loss probabilities in a random 50-pair mesh network
Table I. The SNIR threshold S0 is determined from OPNET modulation curves at 10% packet error rate (PER). For 300 and 1500 byte frames, S0 equals to 6.78 and 7.54dB respectively. B. Results and Discussions Extensive simulations for various parameters as shown in Table I were conducted. All simulations have similar trends and hence we only show one group of results: for 50 pairs with 1500 byte packets, 12 Mbps link data rate and path loss exponent of 2. Fig. 2(b) shows the differentiated loss probabilities for all links in the network as a function of normalized PCS threshold 1 . We further show the results for some specific individual links in Fig. 3: best, medium and worst link in terms of throughput for θ = −9dB. In Fig. 2 and Fig. 3, the probabilities of collision, P r{C} and interference, P r{I}, for different CWmin values such as 15, 127, and 512 are shown. Compared with the huge difference in the probabilities of collision for each CWmin, we arrive at the following key observation: Changing CWmin has minor effect on the probability of interference for each link. This is valid as |θ| approaches or exceeds S0 , which equals 7.54 dB for 1500 bytes packet at 12Mbps data rate. This range is the reasonable operational range for PCS threshold due to its low PER; hence, P r{I} is only dependant on the PCS threshold and independent of CWmin. Therefore, if event I could be differentiated from event C, the PCS threshold adaptation can exploit the P r{I} as the measurement of the hidden terminal effect. Further, because of the independence, P r{I} of each individual link can be 1 The normalized PCS threshold θ is defined as the ratio (in dB) between the actual PCS threshold and the reception sensitivity.
estimated based on link PER by minimizing P r{C} with a large CWmin. In addition, from Fig. 2(b), as the PCS threshold decreases, P r{C} for CWmin=15 increases. This implies that decreasing PCS threshold cannot lower the PER due to collisions and may even increase it, since the number of contending stations will increase. Moreover, P r{I} is not independent of the PCS threshold and thus lowering PCS threshold to minimize P r{I} is not appropriate for estimating P r{C} based on link PER. Also, in Fig. 2 (b), the aggregate throughout as a function of PCS threshold for different CWmin values are also shown. Here, the impact of carrier sensing on throughout can be observed. When θ is close to 0, which means that the carrier sensing range approaches to its minimum, the hidden terminal problem are pronounced and make the probability of interference very high. The hidden terminal problem can be reduced by decreasing PCS threshold; however the exposed terminal problem becomes more pronounced in this case, which prevents simultaneous transmissions and reduces spatial reuse. Therefore, tuning PCS threshold directly affects both hidden and exposed terminal problems. Both problems decrease the system throughput. Clearly, this inherent tradeoff lies at the core of optimizing the performance of mesh networks by balancing the number of simultaneous transmissions in the system and the probability of interference at any node. Finally, varying CWmin from 15 to 127 shows nearly the same aggregate throughput with the same PCS threshold. This is due to the tradeoff of collisions and idle time slots. However, the the aggregate throughout of CWmin=511 is much lower than the others, because of too much idle slots due to large backoff time.
This full text paper was peer reviewed at the direction of IEEE Communications Society subject matter experts for publication in the ICC 2007 proceedings.
Link_a in Random Network:12Mbps,packet size=1500Bytes γ=2
Link_b in Random Network:12Mbps,packet size=1500Bytes γ=2
0.9
0.8
0.7
0.9
0.8
0.7
0.6
Probablity
Probablity
Link_c in Random Network:12Mbps,packet size=1500Bytes γ=2
1
CWmin=15 Pr{C} CWmin=15 Pr{I} CWmin=127 Pr{C} CWmin=127 Pr{I} CWmin=511 Pr{C} CWmin=511 Pr{I}
0.5
1
CWmin=15 Pr{C} CWmin=15 Pr{I} CWmin=127 Pr{C} CWmin=127 Pr{I} CWmin=511 Pr{C} CWmin=511 Pr{I}
0.9
0.8
0.7
0.6
Probablity
1
0.5
0.6
0.5
0.4
0.4
0.4
0.3
0.3
0.3
0.2
0.2
0.2
0.1
0.1
0.1
0 −16
−14
−12
−10
−8
−6
−4
Normalized PCS Threshold θ (dB)
−2
0
0 −16
−14
−12
(a) Medium link Fig. 3.
−10
−8
−6
−4
Normalized PCS Threshold θ (dB)
−2
0
CWmin=15 Pr{C} CWmin=15 Pr{I} CWmin=127 Pr{C} CWmin=127 Pr{I} CWmin=511 Pr{C} CWmin=511 Pr{I}
0 −16
(b) Best link
−14
−12
−10
−8
−6
−4
Normalized PCS Threshold θ (dB)
−2
(c) Worst link
Differentiated loss probabilities of individual links as a function of PCS threshold in a random 50-pair mesh network
IV. PCS A DAPTATION WITH L OSS D IFFERENTIATION A. Estimation for the Probability of Interference and Collision Based on the key discovery in the previous section – “changing CWmin has minor effect on the probability of interference for each link”, a method to estimate P r{I} and P r{C} for each individual link with default CWmin (Cwmin=15 in 802.11a) is devised. Such information will be used in the adaptation algorithm. During the estimation, the whole network will be forced to use a large CWmin (e.g. 127) to minimize P r{C}. Then, the observed PER for large CWmin can be assumed to equal P r{I}. Finally, P r{C} for each link can be acquired by subtracting P r{I} from the total PER with the default CWmin. B. Proposed PCS Adaptation Algorithm In this section, the previous centralized PCS adaptation algorithm in [2] is extended using the additional statistical information for differentiation of packet losses. The proposed PCS adaptation algorithm is designed to adaptively search the optimal PCS threshold for optimizing aggregate network performance (throughput) while satisfying the maximum PER (interference) constraint on each link. In the proposed algorithm, time is divided into two segments: adaptation and normal operation. The adaptation segment is a period during when the proposed algorithm performs adaptation in run-time by simply forcing the whole network to use a large CWmin. For example, adaptation can be performed on a fixed schedule such as the first several minutes in each hour. After determining the suitable CS threshold, all stations will use the default CWmin value in the normal operation segment. The following notations will be used in our algorithm: • i: iteration index corresponding to PCS threshold updating period • T : PCS threshold updating period • Ta : adaptation segment, Ta = kT, k ∈ N • Pm (i): The PER of the link with highest PER within ith PCS threshold updating period with the large CWmin
pmin , pmax : Targeted minimum, maximum PER γcs (i): PCS threshold used after ith PCS threshold update • δ: PCS adaptation step • γmin , γmax : minimum, maximum PCS threshold The operation of the proposed PCS adaptation algorithm is as followings. All stations measure the per-link PER (the ratio between the number of received ACK and the number of transmitted data packets within a specific time duration, T ). The PER of the link with highest value, Pm (i), will be used for the linear adaptation algorithm to determine the PCS threshold for the next operation segment based on following Equation: max(γcs (i − 1) − δ, γmin ) if Pm (i) > pmax min(γcs (i − 1) + δ, γmax ) Pm (i) < pmin γcs (i) = γcs (i − 1) otherwise (1) If a large CWmin for estimating P r{I} is not used, the proposed algorithm is identical to [2]. The new algorithm will be compared with [2] in the following simulations. • •
C. Simulation Evaluation For the proposed adaptation algorithms, the random topology with different node densities are used for the simulation. The simulation parameters are the same as those used in Fig. 2. For averaging the PER, T is set to 10 s. The reception sensitivity was set to −66.8 dbm such that the reception range was 10 m; thus a receive node can only receive packets up to a maximum distance of 10 m. We set the target PER ranges such as (pmin , pmax ) = (0.05, 0.1), (0.1, 0.2), (0.2, 0.3) or (0.3, 0.4), δ = 1 dB and (γmin , γmax )=(−85.8 dbm,−66.8 dbm) for the PCS adaptation. Here, γmax was set to the reception sensitivity; while γmin was set to make the PCS adaptation range large enough to minimize P r{I}. The initial PCS threshold for each (pmin , pmax ) is set to γmax . For each (pmin , pmax ), the PCS adaptation algorithm will run for Ta = 200 s (k = 20) with the initial PCS threshold. Thus there will be 20 PCS updating periods for each (pmin , pmax ). The simulation will continue with the finalized PCS thresholds as a result of the adaptation and the default CWmin value for
0
This full text paper was peer reviewed at the direction of IEEE Communications Society subject matter experts for publication in the ICC 2007 proceedings.
(p
,p
min
(0.05, 0.1)
50
) (0.2,0.3)
(0.05, 0.1)
(0.3,0.4)
45
40
40
Gain 90%
30
25
20
Adapation Segment 15
5
200
300
25
20
500
600
800
900
1100
Algorithm in [2] Proposed CWmin=127 Proposed CWmin=255 Proposed CWmin=511
10
Algorithm in [2] Proposed CWmin=127 Proposed CWmin=255 Proposed CWmin=511 0
30
15
Operation Segment
10
5
0
1200
0
200
300
Simulation Time (s)
(p
,p
min
(0.05, 0.1)
−66
)
(p
,p
min
(0.2,0.3)
(0.3,0.4)
(0.05, 0.1)
−66
800
900
1100
1200
γmax
−68
−68
−70
−70
−72
−72
)
max
(0.1,0.2)
(0.2,0.3)
(0.3,0.4)
PCS Threshold (dBm)
max
PCS Threshold (dBm)
600
(a) Average throughput
max
(0.1,0.2)
500
Simulation Time (s)
(a) Average throughput
−74
−74
−76
−76
−78
−78
Adaptation Segment
−80
−80
−82
Algorithm in [2] Proposed CWmin=127 Proposed CWmin=255 Proposed CWmin=511
Operation Segment
−84
−84
γmin 0
200
300
500
600
800
900
1100
Algorithm in [2] Proposed CWmin=127 Proposed CWmin=255 Proposed CWmin=511
−82
γmin
−86
(0.3,0.4)
35
Throughput (Mbps)
Throughput (Mbps)
35
γ
(0.2,0.3)
50
45
0
(pmin,pmax) (0.1,0.2)
max
(0.1,0.2)
1200
−86
0
200
PCS adaptation in random 50-pair mesh network
another 100 s (duration chosen based on traffic patterns) to accurately measure network performance post PCS adaptation. 1) Simulation Results and Discussion: Fig. 4 shows average throughput and changes of PCS threshold in the random 50pair mesh network with our proposed algorithm. The results in [2] are compared with our proposed algorithm. For our proposed algorithm, three different CWmin values such as 127, 255 and 511 were investigated respectively in the estimation for P r{I} and carrier sensing adaptation. From Fig. 4 (b), PCS threshold (solid line) with the algorithm in [2] cannot converge even for a high target PER range like (0.3, 0.4) and will keep on decreasing to the minimum value γmin = −86.8 dBm. This is due to fact that this
500
600
800
900
1100
1200
(b) Tracing the PCS threshold
(b) Tracing the PCS threshold Fig. 4.
300
Simulation Time (s)
Simulation Time (s)
Fig. 5.
PCS adaptation in random 30-pair mesh network
algorithm ignores the probability of collision, P r{C}. As shown in Section III, decreasing PCS threshold does not lower the PER due to collisions and may even increase it. Thus any PCS threshold will not satisfy the maximum PER constraint and will be forced to decrease via adaptation. Finally the network will unnecessarily use a very low PCS threshold and the achievable spatial reuse will be greatly reduced. By contrast, our proposed algorithm for the target PER range allows the PCS threshold to converge to a closeto-optimal value for throughput maximization. The optimal normalized PCS threshold θ is found to be close to −S0 [1][3] and therefore the optimal PCS threshold is predicted to be −74.3 dBm. Comparing with [2], the aggregate operational
This full text paper was peer reviewed at the direction of IEEE Communications Society subject matter experts for publication in the ICC 2007 proceedings.
Further, for low density network such as random 10-pair mesh, the throughput in the adaptation periods with CWmin=511 or CWmin=255 are much lower than that with CWmin=127. This is due to the fact that estimation overhead due to idle time slots is high in such cases and thus very large CWmin values like 511 are not appropriate for the relatively low density mesh networks.
(pmin,pmax) (0.05, 0.1)
(0.1,0.2)
(0.2,0.3)
(0.3,0.4)
45
40
Throughput (Mbps)
35
30
V. C ONCLUSION
25
20
15
Algorithm in [2] Proposed CWmin127 Proposed CWmin255 Proposed CWmin511
10
5
0
200
300
500
600
800
900
1100
1200
Simulation Time (s)
R EFERENCES
(a) Average throughput (p
,p
min
γ
(0.05, 0.1)
−66
)
max
(0.1,0.2)
(0.2,0.3)
(0.3,0.4)
max −68
−70
PCS Threshold (dBm)
−72
−74
−76
−78
Algorithm in [2] Proposed CWmin=127 Proposed CWmin=255 Proposed CWmin=511
−80
−82
−84
γmin −86
0
200
300
500
600
800
900
1100
1200
Simulation Time (s)
(b) Tracing the PCS threshold Fig. 6.
In this paper, a new method for estimating the probability of collision and interference statistically was proposed. It is further used in a novel PCS adaptation algorithm to improve the aggregate throughput in HD mesh network. The simulation results quantify achievable improvements to aggregate throughput via adaptive tuning PCS threshold with loss differentiation. For a variety of different network densities and target PER ranges, PCS threshold approaches its optimal value to maximize aggregate throughout.
PCS adaptation in random 10-pair mesh network
throughput was increased by more than 90 % (from 21 Mbps to 40 Mbps). The one exception where our algorithm did not converge is the case with a target PER range (0.05, 0.1) and CWmin=127. In this case, P r{C} of the worst link with CWmin=127 exceeds 10 %, which suggests that in order to assure convergence, the target PER range should be adjusted upwards. Fig. 5 and Fig. 6 show the same results as Fig. 4 for random 30-pair and random 10-pair mesh network respectively. When the network density is lower, PCS threshold with the algorithm in [2] may converge for some high target PER ranges but still does not converge for range (0.1, 0.2) and (0.05, 0.1); our proposed algorithm converges for any target PER range.
[1] J. Zhu, X. Guo, L. Lily Yang, W. Steven Conner, S. Roy, Mousumi M. Hazra, “Adapting physical carrier sensing to maximize spatial reuse in 802.11 mesh networks”, Wireless Communications and Mobile Computing Volume 4, Issue 8, p 933-946, December 2004. [2] J. Zhu, B. Metzler, X. Guo amd Y. Liu,“ Adaptive CSMA for Scalable Network Capacity in High-Density WLAN: a Hardware Prototyping Approach”, Proc. IEEE Infocom, Mar. 2006. [3] S. Roy, H. Ma, R. Vijaykumar and J. Zhu, “Optimizing 802.11 Wireless Mesh Networks Performance Using Physical Carrier Sensing”, (submitted), 2006. [Technical report version available at https://www.ee.washington.edu/techsite/papers/documents/UWEETR2006-0005.pdf] [4] J. Kim, S. Kim, S. Choi and D. Qiao, “CARA: collision-aware rate adaptation for IEEE 802.11 WLANs”, IEEE Conference on Computer Communications,Apr. 2006 [5] J.H. Yun, S.W. Seo, “Collision Detection based on Transmission Time Information in IEEE 802.11 Wireless LAN”, Pervasive Computing and Communications Workshops, 2006. PerCom Workshops 2006. Fourth Annual IEEE International Conference on Publication Date: 13-17 March 2006 [6] K. Whitehouse, A. Woo,F. Jian, J. Polastre, and D. Culler, “Exploiting The Capture Effect For Collision Detection and Recovery”. In Proc. of the IEEE Em-NetS-II Workshop, May 2005. [7] Q. Pang, S. C. Liew, V. C.M. Leung, “Design of an effective lossdistinguishable MAC protocol for 802.11 WLAN”, Communications Letters, IEEE, 2005 [8] K. Xu, M. Gerla, S. Bae, “How effective is the IEEE 802.11 RTS/CTS handshake in ad hoc networks?” GLOBECOM ’02, Nov. 2002 [9] http://www.opnet.com [10] H. Ma, E. Alotaibi and S. Roy, “Analysis and Simulation Model of Physical Carrier Sensing in IEEE 802.11 Mesh Networks”, OPNETWORK Conference 2006, Aug. 2006, Washington, DC [11] IEEE P802.11. Standard for Wireless LAN Medium Access Control (MAC) and Physical Layer (PHY) Specifications, 1997. [12] IEEE P802.11a. Supplement to Standard IEEE 802.11, High speed Physical Layer (PHY) extension in the 5GHz band, 1999.