NEURAL NETWORK TO SIMULATE EVAPORATION FROM CLASS A PAN
P2.5
Bachisio Arca*, Fabrizio Benincasa, Matteo De Vincenzi, Andrea Ventura National Research Council - Research Institute for the Monitoring of Agroecosystems
1. INTRODUCTION Evapotranspiration can be estimated using evaporimeter data, owing to a proportional relationship between free water evaporation and potential evapotranspiration. The Class A pan evaporimeter is one of the most widely used instruments for the measurement of evaporation but, like other evaporimeters, its performance is affected by instrumental limits and practical problems (Jensen et al., 1990; Doorenbos e Pruitt, 1977): observer’ errors, turbidity of water, watering of birds or other animals, as well as other maintenance problems which can reduce the accuracy of evaporation measurements. Several researchers have developed models for estimating free water evaporation (E0) and pan evaporation (Epan). Direct applications of the analitical models for estimating E0 require the measurement of many weather variables, some of which are not always available, e. g. net radiation, (Linacre, 1994; Penman, 1948). Empirical models require few weather variables but show a low transferability to other locations (Linacre, 1994; Cahoon et al., 1991; Van Zyl et al., 1989; Christiansen, 1968). There are a number of studies (Francl and Panigrahi, 1997; Arca et al., 1998; Schultz et al., 1995; Elizondo et al., 1994a; Elizondo et al., 1994b) in which some environmental phenomena are described by mathematical models based on artificial Neural Networks (NNs). These systems, composed of many simple processing elements (neurons), store experimental knowledge provided in the form of examples, which enable them to compute Corresponding author address: Bachisio Arca, CNR, Istituto di Ricerca per il Monitoraggio degli Agroecosistemi, Via Funtana di Lu Colbu 4/A, 07100 Sassari, Italy; e-mail:
[email protected]
complex and non-linear problems. NNs are able to estimate the values of a variable which quantifies a phenomena (output), beginning from values of quantities involved in that phenomena (input). NNs, however, do not provide analytical information about the relationship between input and output. The aim of this study is to develop and test a neural network for estimating Class A pan evaporation. 2. MATERIALS AND METHODS 2.1 Data collection Measurements were made at an agricultural meteorological station located in Sassari, Italy (40° 43’ 53’’ N, 8° 31’ 08’’ E, 188 m a.s.l.), from April to September 1997. The variables utilized for implementation of NNs were: dry and wet bulb temperature, wind speed at the height of two meters, global solar radiation, rain intensity, Class A pan evaporation (measured through a hydrostatic transducer based on a load cell) (Benincasa et al. 1998), surface temperature of pan water. A data-logger (Delta-T Devices, mod. DeltaT Logger) acquired the measurements for each parameter every minute and summarized them every ten minutes by averaging. Only for the hydrostatic transducer the reading interval was five seconds, while the data summarization interval was ten minutes. Data recorded during rainfall were discarded because of its high uncertainty. Vapour pressure deficit (∆eTs) was obtained from saturation vapour pressure (ess) and actual vapour pressure (ea): ess was calculated from surface temperature (Ts) of the water in the pan by an empirical function (Tetens, 1930), ea was calculated from dry and wet bulb temperature.
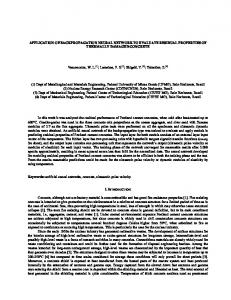
2.2 Artificial neural networks A three-layer feedforward neural network topology was chosen in this study; two NNs, with different architecture, were developed (tab. 1). The input layer of both NNs contains two neurons which receive the values of vapour pressure deficit and wind speed. The first NN operates with hourly data while the second one with daily data. The hidden layer contains nine neurons in the first NN and four neurons in the second. In both NNs, the unique neuron of the output layer gives the estimate of evaporation. Neurons of each layer are full-connected to the neurons of the next layer (fig. 1). The strength of each connection (weight) was updated by the learning process. During the learning process, the computed output of NN was compared to the desired output (target) and the error was determined; the value of error was used for updating the weights. This reiterative process was stopped after 1000 cycles since the error reached was sufficiently low. The learning optimization technique employed was Quickprop (Patterson, 1996). Learning rate (η), which affects speed and accuracy of the learning process, was 0.01 for each NN. The experimental data were divided into two parts: one for training and the other for testing the NNs. In the first NN a data set of 272 input records (patterns), collected from May to June, was used for training and a data set of 2200 patterns, collected from July to September, for testing. In the second NN a data set of 110 patterns, collected from May to August, was used for training and a data set of 29 patterns, collected in September, for testing. The sum of squared errors (εtrain) between calculated outputs and targets was used to evaluate errors during learning phase. In test phase, relative error, standard error of estimate (SEE) and correlation coefficient, were used to compare the values of estimated evaporation (Es) with those measured (Epan). The version 4.1 of SNNS program (Zell et al., 1996) was used to implement and test the NNs.
Figure 1. Architecture of the second multilayer feedforward neural network.
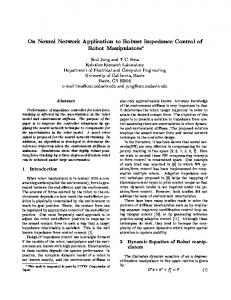
3. RESULTS AND DISCUSSION 3.1 Results with Ts measured The relative error between the values of daily Epan and the values of Es estimated by the first NN was 3 % and, only during days with very low evaporation (less than 3 mm d-1) was it able to reach 15 %. The correlation coefficient between observed and estimated values was highly significant (r = 0.98, P = 0.001) and the SEE was 0.27 mm d-1. Figure 2 shows that estimated values Es are situated close to the 45 degree line; this is an index of the good accuracy of this NN. Performance of the second NN was lower than the first due to the smaller data set utilized for training (tab. 1). In this case the relative error was around 7 %; the correlation coefficient between observed and estimated values was highly significant (r = 0.87, P = 0.001) and SEE was 0.40 mm d-1.
Table 1. Neural network parameters. input n° of neurons n° n° η parameters input hidden output pattern cycles 1st 2 9 1 272 0.01 1000 ∆eTs, u 2nd 2 4 1 110 0.01 1000 ∆eTs, u ∆eTs: vapour pressure deficit; u: wind speed; η: learning rate; εtrain: sum of squared errors. NN
εtrain 0.083 0.089
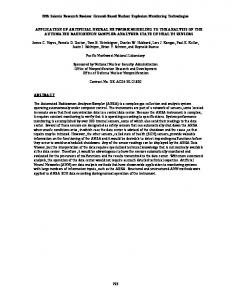
For this reason values of Es with Ts estimated were calculated only on a daily basis and the accuracy of estimates did not change significatively; in fact, the relative error was 9 % and SEE was 0.46 mm d-1. The correlation coefficient between measured and estimated values was highly significant (r = 0.82, P = 0.001); figure 3 shows the good accuracy of Epan estimates.
10 Ts measured
9 8 Es ( mm d-1 )
7 6 5 4 3 2
4. CONCLUSIONS
1 0 0
1
2
3 4 5 6 7 -1 Epan ( mm d )
8
9
10
Figure 2. Daily Class A pan evaporation (September 1997); values estimated by second NN (Es) versus values measured (Epan). Ts measured. 3.2 Results with Ts estimated Since measurement of Ts is not easy to obtain (Rosenberg et al., 1983; Thom et al., 1981; Hage, 1975) this variable was also estimated by two NNs, one learned on a daily basis and the other on an hourly basis. Weather element inputs used by NNs were: relative humidity, wind speed, air temperature and global solar radiation. On a daily basis the NN provided good accuracy in the estimate of Ts (mean relative error of 1.8 %); on the contrary, on an hourly basis, the error of the estimated Ts was very high due to the different time of variation of air and water temperature.
5. REFERENCES
10
Ts estimated
9 8 7 Es ( mm d-1 )
The present study demonstrates the capabilities of neural networks for evaporation modeling, however the choice of NN architecture and input parameters are crucial for obtaining good estimate accuracy. Although small data sets were used for learning, the NNs capability to generalize allowed good estimate accuracy. For this reason NNs technique, compared to traditional models, could reduce the time necessary to develop and calibrate locally the models. The good results obtained by the second NN with estimated Ts underline the NN robustness: the use of inputs affected by measurement errors, or constituted by estimated variables, does not significantly reduce the accuracy of the estimate. NNs developed in this study could be used to avoid measurement of evaporation by Class A pan and thus to eliminate its maintenance problems as well as to verify historical evaporation data or to reconstruct missing data.
6 5 4 3 2 1 0 0
1
2
3 4 5 6 7 Epan ( mm d-1 )
8
9
10
Figure 3. Daily Class A pan evaporation (September 1997); values estimated by second NN (Es) versus values measured (Epan). Ts estimated.
Arca, B., F. Benincasa, M. Bianchini, M. De Vincenzi, M. Gori, 1998: Le reti neurali nel calcolo dei flussi radiativi. Riv. di Ing. Agr., 1, 26-31. Benincasa, F., M. De Vincenzi, G. Fasano, A. Materassi, 1998: Misura di livello nelle vasche evaporimetriche di classe A: confronto fra trasduttori e proposta di un nuovo dispositivo. Riv. di Ing. Agr., 2, 84-90. Cahoon, J.E., T.A. Costello, J.A. Ferguson, 1991: Estimating pan evaporation using limited meteorological observations. Agricultural and Forest Meteorology, 55, 181190. Christiansen, J.E., 1968: Pan evaporation and evapotranspiration from climatic data. ASCE, J. Irrig. and Drain Div., 94, 243-265.
Doorenbos, J., W.O. Pruitt, 1977: Guidelines for predicting crop water requirements. FAO Irrig. Drain. Pap. 24, Roma, pp. 156. Elizondo, D.A., R.W. McClendon, G. Hoogenboom, 1994a: Neural Network Models for Predicting Flowering and Physiological Maturity of Soybean. Transactions of the ASAE, 37(3), 981-988. Elizondo, D.A., G. Hoogenboom, R.W. McClendon, 1994b: Development of a neural network model to predict daily solar radiation. Agricultural and Forest Meteorology, 71, 115132. Francl, L.J. and S. Panigrahi, 1997: Artificial neural network models of wheat leaf wetness. Agricultural and Forest Meteorology, 88, 57-65. Hage, K.D., 1975: Averaging Errors in Monthly Evaporation Estimates. Water Resources Research, 11(2), 359-361. Jensen, M.E., R.D. Burman, R.G. Allen, 1990: Evapotranspiration and irrigation water requirements. ASCE Manuals and Reports on Engineering Practice n° 70, New York, pp. 332. Linacre, E.T., 1994: Estimating U.S. Class A Pan Evaporation from Few Climate Data. Water International, 19, 5-14. Patterson, D.W., 1996: Artificial Neural Networks: theory and applications. Simon & Schuster, Singapore, pp. 477. Penman, H.L., 1948: Natural evapotranspiration from open water, bare soil and grass. Proc. R. Soc. London Ser. A., 193, 120-145. Rosenberg, N.J., B.L. Blad, S.B. Verma, 1983: Microclimate: The Biological Environment, Wiley & Sons, New York, pp. 495. Schultz, A., R. Wieland, A. Baumann, 1995: The use of Neural Networks in Agroecological Modelling. Artificial Intelligence in Agriculture. Proceedings of IFAC Workshop, 55-60. Tetens, O., 1930: Uber einige meteorologische Begriffe. Z. Geophys., 6, 297-309. Thom, A.S., J.L. Thony, M. Vauclin, 1981: On the proper employment of evaporation pans and atmometers in estimating potential transpiration. Quart. J. R. Met. Soc., 107, 711-736. Van Zyl, W.H., J.M. De Jager, C.J. Maree, 1989: The relationship between daylight evaporation from short vegetation and the USWB Class A pan. Agricultural and Forest Meteorology, 46, 107-118. Zell, A., G. Mamier, M. Vogt, N. Mache, R.
Hübner, S. Döring, K. Herrmann, T. Soyez, M. Schmalzl, T. Sommer, A. Hatzigeorgiou, D. Posselt, T. Schreiner, B. Kett, G. Clemente, J. Wieland, 1996: SNNS Stuttgart Neural Network Simulator. User Manual Version 4.1, Report No. 6/95, Institute for Parallel and Distributed High Performance Systems (IPVR), Stuttgart.