Parasitic Modeling for Accurate Inductive Switching Simulation of Converters using SiC Devices Ruiyun Fu, Alexander Grekov, Kang Peng, Enrico Santi Electrical Engineering, University of South Carolina Columbia, SC, USA
[email protected] parasitics and to demonstrate experimentally that the parasitic models so obtained, together with previously developed semiconductor device models, allow accurate prediction of converter switching waveforms.
Abstract- In this paper, the parasitic inductances for inductive switching of SiC devices in a switching converter were modeled and analyzed using a 3-D inductance extraction program. A double pulse testbench was built to characterize the resistive and inductive switching behavior of the SiC devices. In order to capture the parasitic ringing in the fast switching transient, the gate-to-source switching loop and drain-to-source switching loop parasitic inductances of the PCB layout are extracted by the 3D inductance extraction program. The system model in Pspice includes SiC device models and the extracted parasitic elements. Simulation results are compared with experimental results. The comparison shows good agreement between simulation and experimental results under both resistive and inductive switching conditions.1
I.
Parasitic elements like parasitic inductances and parasitic capacitances can be associated with practically every physical component in the switching converter, including the power semiconductor devices, ICs, sensors, capacitors, inductors, PCB traces and connectors, and so on [35]. The switching behavior is primarily affected by semiconductor device parasitic capacitances and by circuit layout parasitic inductances. A parasitic inductance in series with a semiconductor device stores energy when current flows through it. When the device turns off, the stored energy in the parasitic inductance needs to be discharged and a voltage spike rated at Ldi/dt is added to the offstate voltage of the device, which increases the voltage stress of the device. The effects of parasitic inductances will be worse at higher frequencies, given the higher di/dt, limiting the maximum operating switching frequency of power devices. To optimize the performance of switching converter, parasitic inductances should be reduced as much as possible.
INTRODUCTION
Silicon carbide (SiC) is one of the most promising semiconductor materials for highvoltage, high-speed and low-loss power switching converter applications because of its excellent electrical properties, such as wider bandgap, higher thermal conductivity and higher critical breakdown electric field [1-2]. Thanks to recent progress of SiC technology, SiC MOSFETs and Schottky diodes are now commercially available from various manufacturers, such as Cree, GeneSiC and Infineon. SiC devices hold the promise of faster switching speed compared to Si devices, which can lead to superior converter performance, because the converter can operate at higher switching frequencies with acceptable switching losses, so that passive filter size is reduced. However, the ultimate achievable switching speed is determined not only by internal semiconductor device physics, but also by circuit parasitic elements. Therefore, in order to accurately predict switching losses and actual switching waveforms, including overshoot and ringing, accurate models are needed not only for the semiconductor devices, but also for the circuit parasitics. Given the higher switching speed of SiC devices, the relative importance of circuit parasitics is increased. The objective of this work is to develop a procedure to accurately model circuit
Different approaches have been proposed in the literature for extracting parasitic element parameters [3-6]. They can be categorized as belonging to two different general methods, the measurement-based method and the simulationbased method. Examples of the measurement-based method are time domain reflectometry (TDR) based measurement [6] and the method based on impedance measurement [5]. These methods are complicated and time consuming or just suitable for simple test circuit where the parasitic parameters can be isolated and measured. In the second method, the simulation-based method, parasitic parameters are extracted using finite element analysis, as implemented in Maxwell Field Solver 3D software, or partial element equivalent circuit (PEEC) methods, as implemented in Maxwell Q3D Extractor software and in 3-D
1
This work was supported by the Office of Naval Research under grant N00014-08-1-0080.
978-1-4799-0336-8/13/$31.00 ©2013 IEEE
1259
inductance extraction program FastHenry, which is used in this paper.
ܸீௌ ൌ ܸீீ െ ܴீ ݅ீ െ ீܮ
This paper describes the development and validation of the electrical model including parasitic parameters of PCB layout and SiC device models for a double pulse hardware test-bench. The software used in this work is 3-D inductance extraction program FastHenry, which is user friendly and provides reasonably accurate estimation of parasitic parameters. The extracted gate-to-source switching loop and drain-to-source switching loop parasitic inductances of the PCB layout are used in Pspice simulation circuit together with previously developed SiC MOSFET model [7] and SiC Schottky diode model [8] to accurately simulate the resistive and inductive switching behavior of the power devices.
ܸௌ ൌ ܸூே െ ܸோ െ ܮ
ௗಸ ௗ௧
ௗವ ௗ௧
െ ܮௌ
െ ܮௌ
ௗሺಸ ାವ ሻ ௗ௧
ௗሺಸ ାವ ሻ ௗ௧
(1) (2)
According to Equation (1), during MOSFET turn-on the dynamic gate-to-source voltage VGS decreases with increasing parasitic inductances LG and LS, because the voltages across these two inductances are positive with increasing drain current. As a result, the turn-on switching time of the device is slowed down by the presence of these devices. Another way to say this is that there is a negative feedback effect from the drain-to-source switching loop into the gate-to-source switching loop, which opposes device commutation. During MOSFET turn-off, the free-wheeling diode is turning on. The gate-to- source voltage and drain-to-source voltage across the device are given by Equation (1) and Equation (2) respectively. However, since the drain current is getting smaller, the voltages across the inductances are negative, which means increasing voltages VGS and VDS across the devices. This can cause overshoot and oscillations in the drain-source voltage, which causes increased voltage stress in the MOSFET. The negative feedback effect is present during turnoff as well, causing a slowdown in the switching transient.
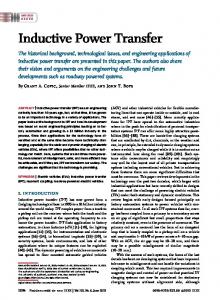
II. EFFECTS OF P ARASITIC INDUCTANCES ON SWITCHING B EHAVIOR In any switching circuit, parasitic impedances can be identified in association with all physical elements in the circuit, including the semiconductor devices, the interconnections, the sensors, and PCB layout. In particular, parasitic inductances are a big concern and limit performance of switching converters, especially in the case of fast-switching SiC devices. Fig.1 shows the typical inductive switching circuit with main parasitic inductances. LD represents the drain-to-source switching loop parasitic inductance. LS is the MOSFET source-leg parasitic inductance and provides a feedback path from MOSFET drain current to gate-source voltage during transitions. LG is the gate-to-source switching loop parasitic inductance. LDD is the parasitic inductance of free-wheeling diode path.
In this paper, the focus is on the extraction of parasitic inductances due to the PCB layout, which are typically the largest in magnitude and have the largest effect on device switching performance and losses. The other parasitic inductances, such as the parasitic inductances of device package, interconnection and sensor, are not discussed in this work. The semiconductor device parasitic capacitances are included in previously developed semiconductor device models used in the simulations. III. EXPERIMENTAL SETUP AND EXTRACTION OF P ARASITIC I NDUCTANCES A printed circuit board (PCB) double pulse testbench was built to perform the resistive and inductive switching experiments on the SiC devices including MOSFET and Schottky diode. There are two different high current paths in the PCB layout: one for resistive switching and one for inductive switching. Fig.2 shows the PCB layout of the double pulse test-bench and identifies the gate-tosource switching loop (yellow solid line), resistive drain-to-source switching loop (black dashed line) and inductive drain-to-source switching loop (red solid line).
Fig.1 Typical inductive switching circuit with main parasitic inductances
During MOSFET turn on, free-wheeling diode is turning off. In general the gate-to- source voltage and drain-to-source voltage across the device can be calculated using Equation (1) and Equation (2) respectively.
Fig.3 is the experimental setup of inductive switching for the double pulse testing. The testbench includes a test socket for the MOSFET, a test socket for Schottky diode, gate driver, capacitor bank, freewheeling diode, and a Pearson
1260
coil for current measurement. Nine polypropylene film capacitors are used to provide a low inductance voltage source for the test-bench. The MOSFET is SiC MOSFET CMF10120D from CREE Inc. rated at 1200V/24A. The free-wheeling diode is a SiC Schottky diode C4D20120A rated at 1200V/20A from CREE Inc. An IXD_609 chip from IXYS Corporation is used as the MOSFET gate driver with 9A maximum drive current. The gate resistor RG1 is 4.7Ω. The gate voltage switches from -5V to 18V. A Pearson coil is used to measure the drain current IDS.
inductance of the free-wheeling diode’s current path. LSS is the trace inductance from the SiC MOSFET socket to the input capacitor negative terminal. LG1 is the total parasitic inductance of the trace from the driver to the device gate and LG2 is the inductance for the return trace from the device to the driver. RD0 is the total drain-loop parasitic resistance and RG0 is the total gate-loop parasitic resistance.
Fig. 2 Part of the PCB layout of the double pulse test-bench
Fig. 4 X-Y image of PCB traces of the switching loops in FastHenry
Fig. 5 Extracted resistances in the switching loop
Fig.3 Experimental setup of double pulse test-bench
In order to obtain the gate-to-source and drainto-source switching parasitic inductances, the 3-D inductance extraction program FastHenry was used. FastHenry is a software program which computes the frequency-dependent resistances and inductances of complicated three-dimensional packages and interconnects, assuming operating frequencies up to the multi-gigahertz range [9]. Fig.4 shows the X-Y image of PCB traces of the switching loops in FastHenry. Fig. 5 shows the extracted resistances in gate-to-source and drain-tosource switching loop. Fig.5 and Fig.6 show the extracted self-inductances in gate-to-source switching loop and drain-to-source switching loop, respectively. LR1 is the inductance due to the interconnecting trace connected to the positive terminal of the input capacitor. LDM is the total trace inductance from the inductor or resistor load to the SiC MOSFET socket. LDD is the trace inductance from the SiC MOSFET socket to the SiC Schottky diode socket which is the parasitic
Fig. 6 Extracted inductances in gate-to-source switching loop
Fig.7 Extracted inductances in drain-to-source switching loop
Fig.5, Fig.6 and Fig.7 show that at low frequencies the parasitic resistances and inductances are almost constant. However, as
1261
test-bench shown in Fig.3, which includes the parasitic parameters extracted in section III. The comparisons between simulation and experiment were performed at 500V and 12A at room temperature. Comparisons between experimental and simulated results are shown in Fig.11 for resistive switching turn-on transient and in Fig.12 for turn-off transient. The figures show that the simulation results are in good agreement with the experimental results. The small difference in gateto-source voltage VGS waveform between simulated results and experimental results is attributed to the fact that the nonlinear capacitance model CGD does not capture too well the Miller effect of the device when the device is turning on.
frequency increases, current crowds on the outer edges of the traces and, as a result, the parasitic resistances increase and the parasitic inductances decrease. In FastHenry, both the self-inductances and coupling inductances are extracted based on the PCB layout structure. For simplicity, only the self-inductances are taken into account in the switching circuit simulation in this paper. The parasitic parameters used in the simulation circuit are the extracted values at low frequencies. The values are: parasitic gate resistance RG0=0.013Ω, parasitic drain resistance RD0=0.003Ω, gate-tosource loop parasitic inductances LG1=12nH and LG2=7nH and drain-to-source loop parasitic inductances LDM=47nH, LDD=16nH, LR1=12nH and LSS=13nH. IV. MODEL V ALIDATION In this section, the extracted gate-to-source switching loop and drain-to-source switching loop parasitic parameters of the PCB layout are used in Pspice simulation circuit together with the SiC MOSFET and SiC Schottky diode models to validate the resistive and inductive switching behavior of the power devices. The SiC MOSFET model used in this paper is the physics-based model in [7], which accounts for non-uniform current distribution in JFET region by using a nonlinear voltage source and a resistance network. Fig.8 shows the equivalent circuit model of SiC MOSFET. The SiC Schottky diode model used in the simulation is the simple model shown in Fig.9 [8].
Fig.10 Equivalent circuit used for resistive switching circuit
(a)
Fig.8 Equivalent circuit model of SiC MOSFET ID (VD,T)
RD(µD)
A
K + VD -
Cr
(b) Fig.11 SiC DMOSFET simulated (dashed) and experimental (solid) turn-on transient of resistive switching. (a) Comparison of VDS and IDS; (b) comparison of VGS and IGS
Fig.9 Equivalent SiC Schottky diode model
A. Resistive Switching Validation Fig.10 shows the resistive simulation circuit corresponding to the experimental double pulse
1262
(a)
Fig.13 Equivalent circuit used for inductive switching circuit
(b) Fig.12 SiC DMOSFET simulated (dashed) and experimental (solid) turn-off transient of resistive switching. (a) Comparison of VDS and IDS; (b) comparison of VGS and IGS
B. Inductive Switching Validation For the inductive switching experiment, the resistive load is replaced by a clamped inductive load using a 250μH inductor and the free-wheeling SiC Schottky diode. Fig.13 shows the inductive simulation circuit corresponding to the experimental double pulse test-bench shown in Fig.3, which includes the parasitic parameters extracted in section III. The comparisons between simulation and experiment were performed at room temperature. Comparisons between experimental and simulated results are shown in Fig.14 for turnon transient of inductive switching and in Fig.15 for turn-off transient. As seen from the figures, the simulation results are in good agreement with the experimental results and the simulation captures the high frequency oscillation fairly well.
(a)
(b) Fig.14 SiC DMOSFET simulated (dashed) and experimental (solid) turn-on transient of inductive switching. (a) Comparison of VDS and IDS; (b) comparison of VGS and IGS
(a)
1263
above. The non-linear capacitance model for SiC MOSFET and the parasitic inductance models for the switching loop could be further developed to improve matching. VI. CONCLUSIONS In this paper, a double pulse test-bench was built to test the switching behavior of SiC devices including a SiC MOSFET and SiC Schottky diode both rated at 1.2kV. In order to capture the parasitic ringing during the fast switching transient, the gateto-source switching loop and drain-to-source switching loop parasitic inductances and resistances of the PCB layout were extracted using a 3-D inductance extraction program. The extracted parameters were used with the SiC device models for resistive and inductive switching in Pspice simulation and compared with the experimental results. The comparison shows good agreement between simulated and experimental results in both resistive and inductive switching.
(b) Fig.15 SiC DMOSFET simulated (dashed) and experimental (solid) turn-off transient of inductive switching. (a) Comparison of VDS and IDS; (b) comparison of VGS and IGS
V. D ISCUSSION As mentioned before, the effects of parasitic impedances such as parasitic inductances and parasitic capacitances can be very significant in high-frequency high-efficiency switching converter. In order to accurately predict the performance of the switching converter, besides the accurate device model, it is also necessary to extract the specific parasitic impedances in the switching loop, including the parasitic parameters of the semiconductor devices, IC chips, sensors, interconnectors and PCB layout. In other words, the factors that affect the accuracy of the prediction include:
Based on the studies of the effects of parasitic impedances in the switching circuit presented in this paper, the following guidelines can be given for optimized switching converter layout circuit design for high- frequency high- performance converter applications. (1) Choose the power devices with smaller inner parasitic capacitances to reduce the parasitic ringing during switching time. Especially for power MOSFETs, the Miller capacitance CGD should be as small as possible to guarantee faster switching transients.
(1) The accuracy of the semiconductor device model. A good estimation of the switching circuit needs good models for the semiconductor devices that accurately represent both static characteristics and dynamic behavior. The non-linear capacitance model of SiC MOSFET model shown in Fig.8 has some discrepancies at low voltage and over-estimates the capacitance for high voltage [7], which may cause some errors in switching validation for double pulse test-bench.
(2) When designing the PCB layout, always keep the high frequency switching loop of the circuit as short as possible. Since the source parasitic impedance Lss plays a critical role in the switching transient, it is necessary to minimize this path to reduce the ringing of the switching circuit and decrease the voltage overshoot of the devices.
(2) The accuracy of extracted parasitic impedances. In this work, just the parasitic inductances and resistances of PCB layout are estimated by the 3-D inductance extraction program FastHenry. The other parasitic parameters are not specifically discussed and modeled. Also mutual coupling between traces is not included. This may also cause some errors during the modeling of double pulse test-bench circuit.
(3) Use the best possible measurement method to avoid introducing parasitic impedances into the circuit. For voltage measurement, minimize the ground path test point. Use a suitable current sensor in the switching circuit to avoid introducing parasitic inductance in the switching loop which worsens the parasitic ringing of the waveforms.
(3) The accuracy of measurements of current and voltage. The choice of test instruments and methods may produce some errors too. For good prediction, good models of sensors are also needed in the simulation circuit.
REFERENCES [1]
There are some discrepancies in inductive switching validation shown in Fig.14 for turn-on transient and Fig.15 for turn-off transient. The reasons for these are some of the factors described
[2]
1264
G. Brezeanu, M. Badila, B. Tudor, J. Millan, P. Godignon, F. Udrea, G. a. J. Amaratunga and A. Mihaila, “Accurate Modeling and Parameter Extraction for 6H-SiC Schottky Barrier Diodes (SBDs) with Nearly Ideal Breakdown Voltage”, IEEE Trans. On Electron Devices, Vol. 48, No. 9, pp. 2148-2153, 2001. T. R. McNutt, A. R. Hefner, H. A. Mantooth, J. L. Duliere, D. W. Berning and R. Singh, “Parameter extraction sequence for silicon carbide schottky, merged PiN
[3]
[4]
[5]
[6]
[7]
[8]
[9]
Schottky, and PiN power diode models”, IEEE Power Electronics Specialists Conference, 2002, pp. 1269 - 1276, November 2002. Zheng Chen, “Characterization and Modeling of HighSwitching-Speed Behavior of SiC Active Devices”, MS Thesis, Virginia Polytechnic Institute and State University, Blacksburg, Virginia, 2009. Jonah Zhou Chen, Liyu Yang, Dushan Boroyevich and Willem G. Odendaal, “Modeling and measurement of parasitic parameters for integrated power electronics modules”, Applied Power Electronics Conference Exposition, APEC 2004, pp. 522-525, 2004. Malay Trivedi and Krishna Shenai, “Parasitic Extraction Methodology for insulated gate bipolar transistors”, IEEE Transactions on Power Electronics, Vol. 15, No. 4, pp. 799-804, 2000. Huibin Zhu, Allen R. Hefner and Jih-Sheng Lai, “Characterization of power electronics system interconnect parasitics using time domain reflectometry”, IEEE Transactions on Power Electronics, Vol. 14, No. 4, pp. 622-628, 1999. R. Fu, A. Grekov, J. Hudgins, A. Mantooth and E. Santi, “Power SiC DMOSFET model accounting for nonuniform current distribution in JFET region”, IEEE Transactions on Industry Applications , VOL. 48, NO. 1, pp. 181-190, 2012. Ruiyun Fu, A. Grekov, K. Peng, E. Santi, "Parameter Extraction Procedure for a Physics-Based Power SiC Schottky Diode Model", the 28th Annual IEEE Applied Power Electronics Conference & Exposition (APEC) 2013, pp. 545-552, March 2013. Yehia Massoud and Jacob White, “Simulation and modeling of the effect of substrate conductivity on coupling inductance and circuit crosstalk”, IEEE Transactions on Very Large Scale Integration (VLSI) System, Vol. 10, No. 3, pp. 286-291, 2002.
1265