BIOMICROFLUIDICS 4, 034103 共2010兲
Patterning nanowire and micro-/nanoparticle array on micropillar-structured surface: Experiment and modeling Chung Hsun Lin,1 Jingjiao Guan,2,3 Shiu Wu Chau,4,a兲 Shia Chung Chen,1,5 and L. James Lee6,7,a兲 1
Department of Mechanical Engineering, Chung Yuan University, Jhongli 32023, Taiwan, Republic of China 2 Department of Chemical and Biomedical Engineering, FAMU-FSU College of Engineering, Florida State University, Tallahassee 32310, Florida, USA 3 Integrative NanoScience Institute, Florida State University, Tallahassee 32310, Florida, USA 4 Department of Mechanical Engineering, National Taiwan University of Science and Technology, Taipei 10607, Taiwan, Republic of China 5 R&D Center for Membrane Technology, Jhongli 32023, Taiwan, Republic of China 6 Nanoscale Science and Engineering Center for Affordable Nanoengineering of Polymeric Biomedical Devices, The Ohio State University, Columbus 43210, Ohio, USA 7 Department of Chemical and Biomolecular Engineering, The Ohio State University, Columbus 43210, Ohio, USA 共Received 20 March 2010; accepted 12 July 2010; published online 4 August 2010兲
DNA molecules in a solution can be immobilized and stretched into a highly ordered array on a solid surface containing micropillars by molecular combing technique. However, the mechanism of this process is not well understood. In this study, we demonstrated the generation of DNA nanostrand array with linear, zigzag, and fork-zigzag patterns and the microfluidic processes are modeled based on a deforming body-fitted grid approach. The simulation results provide insights for explaining the stretching, immobilizing, and patterning of DNA molecules observed in the experiments. © 2010 American Institute of Physics. 关doi:10.1063/1.3474639兴
I. INTRODUCTION
Stretched DNA molecules could be used for genetic analysis and construction of nanodevices.1–5 Molecular combing is a widely used technique for stretching, patterning, and immobilizing DNA molecules onto a flat solid surface by a dewetting process.5 However, the application of this technique is limited by the poor control of locations and lengths of the stretched DNA.6 We have recently developed a strategy capable of generating highly ordered arrays of stretched DNA on a topologically micropatterned surface through dewetting process.7,8 In a previous study,9 we have successfully created patterned DNA array with curved DNA nanostrands and also explained the corresponding microfluidic mechanism of stretching, immobilizing, and patterning of DNA molecules on microwell-patterned surfaces via experiments and numerical simulations. In this paper, we further generated zigzag patterns of DNA nanowires, accompanied by micro-/nanoparticle array, on a micropillar-featured surface and modeled the dewetting process of fluid on patterned surface via numerical approach at micrometer scale to elucidate the mechanism for DNA stretching, immobilizing, and patterning on micropillar-patterned surfaces, where the formation of micro-/nanoparticles on the column of micropillars was clarified as well.
a兲
Authors to whom correspondence should be addressed. Electronic addresses:
[email protected] and
[email protected].
1932-1058/2010/4共3兲/034103/15/$30.00
4, 034103-1
© 2010 American Institute of Physics
034103-2
Lin et al.
Biomicrofluidics 4, 034103 共2010兲
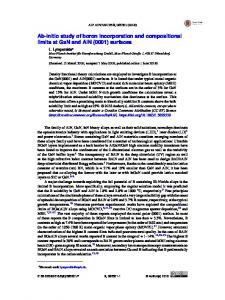
FIG. 1. 共a兲 Schematic of generating a DNA nanowire array by the peeling method. 共b兲 Nonstaggered micropillar array. 共c兲 Staggered micropillar array.
II. DNA STRETCHING EXPERIMENTS
DNA from salmon testes 共Sigma-Aldrich兲 was dissolved in TE buffer solution 共10 mM trisHCl and 1 mM EDTA, pH = 8兲 to 0.1 wt %. NaCl was also added in the solution at a concentration of 10 wt %. DNA was labeled with YOYO-1 fluorescent dye at a dye-base pair ratio of 1:5. Polydimethylsiloxane 共PDMS兲 stamps bearing micropillars were produced by soft lithography technique.10 To generate DNA nanostrand arrays, a small droplet of 10 l DNA solution was dropped on a glass coverslip. The generation of DNA nanowires and micro/nanoparticles was easily achieved by gently placing a PDMS stamp featured by micropillar structures on the droplet and then peeling it up, as schematically shown in Fig. 1. The peeling was performed manually at a roughly controlled dewetting angle with respect to the lattice of the micropillar pattern, where the glass coverslip was kept stationary during the dewetting process. Further experimental details of DNA stretching process are similar to those given in Refs. 8 and 11. Two types of micropillarpatterned substrates were tested, i.e., the nonstaggered, Fig. 1共b兲, and staggered arrangement, Fig. 1共c兲, where in the latter case the horizontal and vertical peeling directions were both adopted. III. MODELING METHOD
The dewetting process of DNA solution on micropillars is described by the receding water meniscus located between two originally parallel solid surfaces due to the rotation of the upper surface. Figure 2共a兲 schematically illustrates this process, where H denotes the liquid thickness between the upper substrate and the top surface of micropillar, and hw represents the water
034103-3
Biomicrofluidics 4, 034103 共2010兲
Patterning on micropillar surface
FIG. 2. 共a兲 Schematic illustration of inducing the dewetting on micropillars by DNA solution. 共b兲 Numerical grid employed to simulate the dewetting process on staggered micropillar array.
submergence depth among micropillars. The dewetting process mediated by micropillars is a complicated flow phenomenon, because it involves not only the moving outer boundaries, i.e., the upper surface, but also the deforming meniscus between two fluids, i.e., the air-water interface, across nonsmooth lower surface. To treat the moving solid boundary properly, a deforming bodyfitted grid, regenerated at each time step in order to precisely describe the computational domain defined by the moving outer boundary, was employed in this paper. The fluid-gas meniscus was then tracked by an interface-capturing approach, where the numerical grid extended over both fluids and the front location was implicitly defined by the volume fraction varying in space. Because the mass and size of DNA are relatively small compared with the manipulated fluid and micropillar, its influence on the flow pattern was neglected in the numerical simulation. As a result, only air and water were considered in the simulation of interested dewetting process. The first two governing equations to describe the moving-front flow phenomenon, i.e., the continuity equation and the Navier–Stokes equation, were expressed in the integral form over a control volume V, d dt
d dt
冕
V
vdV +
冕
dV +
V
冕
冕
共v − vS兲 · ndS = 0,
共1兲
S
v共v − vS兲 · ndS =
S
冕
共f · n兲dS +
S
冕
bdV,
共2兲
V
where the control volume V was bounded by a closed surface S with outward normal vector n, and v denoted the flow velocity, vS the surface velocity of S, the fluid density, t the time, f the external force acting on S, and b the gravitational acceleration. The force component f i, i.e., the component of surface force f in the direction of Cartesian coordinate i, was computed as follows:
fi =
冉
冊
vi v j + e j + pei + f i , x j xi
共3兲
where ei was the unit vector in the direction of Cartesian coordinate i, vi the velocity component in the direction of ei, the fluid viscosity, p the pressure, and f i the surface tension component in the direction of ei. The rate of volume change for a control volume was determined by the third governing equation to avoid errors appearing in the form of artificial mass sources,
034103-4
Biomicrofluidics 4, 034103 共2010兲
Lin et al. TABLE I. Fluid properties of de-ionized water and air. Water density 共kg/ m3兲 Air density 共kg/ m3兲 Surface tension 共N/m兲 Contact angle 共deg兲
Glass PDMS
Water viscosity 共N s / m2兲 Air viscosity 共N s / m2兲
d dt
冕 冕 dV +
V
998.3 1.188 0.074 34.3 112 1.002⫻ 10−3 1.824⫻ 10−5
vS · ndS = 0.
共4兲
S
The last governing equation, employed as follows, was to describe the location of meniscus: d dt
冕
V
cdV +
冕
c共v − vS兲 · ndS = 0,
共5兲
S
where the volume fraction of fluid was defined as c, i.e., c = 1 for cells are filled by liquid, c = 0 for cells by air, and the case of 0 ⬍ c ⬍ 1 for cells by both fluids, where the meniscus exits. The employed numerical scheme to solve the coupled governing equations was based on a finite volume discretization. All vector quantities, e.g., position vector, velocity, and moment of momentum, were expressed in Cartesian coordinates. The detailed mathematical model and numerical scheme can be referenced in Ref. 9, where the employed numerical scheme was also successfully validated by the onset problem of meniscus climbing up on a vertical plane. In the numerical simulation of dewetting process on surfaces with protruding microfeatures, the geometrical characteristics of micropillar were chosen as those given in the experiments. However, the submergence depth of water around micropillar was not available from the experiments. Different water depths were used for numerical simulations, and its influence on dewetting process was discussed in Sec. IV. The fluid properties of de-ionized water employed in the experiment and air are summarized in Table I. A hexahedral grid, with about 0.7⫻ 106 cells to discretize the computational domain comprising of a 1 ⫻ 5 micropillar array, was a typical grid density adopted in our numerical simulation. Figure 2共b兲 shows a typical grid arrangement for the numerical simulation of staggered micropillar array, where a coarse grid representation is adopted. No-slip condition was applied to the solid boundaries, such as the glass cover and PDMS substrate, where the contact angle was well enforced at those boundaries. The two side boundaries, parallel to the peeling direction, were treated as symmetrical planes, while the atmospheric pressure was applied to the front and back boundaries, where fluid flux across boundaries was allowed. The typical time step adopted in the numerical simulation was in tens of nanoseconds to ensure the required numerical stability. Because the thickness of water between micropillar and glass cover was not available from experiments, H was characteristically taken as 2h to avoid unrealistic influence of glass cover on the dewetting process near micropillars in the numerical simulation. IV. RESULT AND DISCUSSION
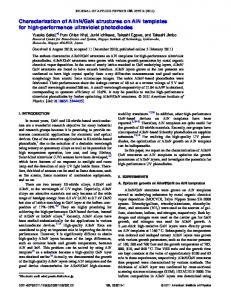
The nonstaggered micropillar array, characterized by circular pillars of 7 m in diameter 共D兲, 8.3 m in center-to-center distance 共L兲, and 3.5 m in height 共h兲, was first tested for patterning nanowires and nanoparticles at the zero peeling angle, where the peeling direction was parallel to the lattice line connecting two successive micropillars. After dewetting DNA nanowires were well aligned in the peeling direction and located on each column of the micropillars, forming an array covering an area of up to 1 ⫻ 1 cm2, Fig. 3共a兲. As indicated by the fluorescence intensity, a nanowire was uniform in lateral size except for the regularly distributed dots that appeared wider than the rest segments of the nanowire, Fig. 3共b兲. The dots were identified as micro/nanoparticles
034103-5
Patterning on micropillar surface
Biomicrofluidics 4, 034103 共2010兲
FIG. 3. 共a兲 Fluorescence image of DNA nanowires and nanoparticles on micropillar stamps. 共b兲 Scanning electron microscopy 共SEM兲 image of DNA nanowires and nanoparticles on micropillar stamps.
formed by precipitation of the solute including DNA and NaCl in the solution. The existence of a single particle on each micropillar suggests that a droplet of the solution was temporarily formed on the micropillar during the dewetting process. Figure 4 illustrates the calculated time evolutions of the dewetting process at small water submergence. Initially, the micropillars were partially submerged in the water 共at one fourth of micropillar depth兲, where micropillars are represented in gray and water in cyan. This color convention is also employed in other figures of this paper, when micropillars and water front both exist in the figure. In Fig. 4 water moved from right to left and only a part of computational domain is shown. As water front moved across micropillars, the hysteresis effect12 on liquid front due to solid surface occurred. This led to the dewetting of water from the edge of its top surface and consequently resulted in an island-like fluid region behind the major front. After the main water front detached from micropillars, the influence of solid-surface hysteresis vanished and the delayed front tried to keep up with the main front, which created a bridge-shape meniscus between two successive micropillars. In order to obtain minimal surface energy at fluid-gas interface, the island-like region finally detached from the main front through surface tension and an isolated microdroplet resulted on top of each micropillar. The detachment or breakup of liquid bridge should be mainly determined by the force resulting from surface tension and the inertia force of fluid due to the dewetting process, which can be described by the dimensionless Weber number 共We兲. The fluid remaining on the column of micropillar during the dewetting process slowed down its velocity because of the viscous damping of contact surface. As the Weber number of this fluid became smaller than a critical value, the meniscus did not have enough inertia to keep moving along its prior direction and started to move in the reverse direction due to the dominance of surface tension, where a recoiling process of water occurred. In contrast, when the inertia effect was too significant, the capillary and viscous force was not able to stop the fluid remaining on the micropillar, where no microdroplet could be found after peeling. Additionally, the small amount of water initially filled among micropillars was quickly swept away by the moving front, which obviously possessed sufficient inertia to overcome the capillary force along the wetted contact line, as well as the viscous damping that occurred on the solid surfaces, Fig. 4. Shortly after the detachment between main water meniscus and the island-like region, a spherical microdroplet was found eccentric downstream on the top surface of micropillars. This clearly gives the explanation to the formation of isolated particles and their eccentric locations observed on the top surface of the micropillars, Fig. 3共a兲. The finial location, i.e., the degree of eccentricity, of microdroplet reflects the balanced location of microdroplet among inertia force contributed by the peeling rate, capillary effect characterized by the surface tension, and frictional viscous damping due to surface roughness. For the same geometrical configuration of PDMS stamp and working fluid, the degree of eccentricity of microdroplets should mainly depend on the peeling speed, i.e., the fluid inertia, in our study. Figures 5共a兲 and 5共b兲 show the calculated time series of velocity vectors of water at a vertical and horizontal plane, respectively. Our calculations suggest that the water originally filled between two successive micropillars was rapidly merged into the moving fluid above them shortly after the
034103-6
Lin et al.
Biomicrofluidics 4, 034103 共2010兲
FIG. 4. Time evolutions of water front among successive micropillars 共top and side views兲.
peeling started. The upward velocity of fluid induced by the upward peeling motion facilitated the entrapment of water initially rested between micropillars by the main fluid stream, Fig. 5共a兲. The numerical simulations reveal that water above two successive micropillars 共i.e., pillars A and B兲 both flowed in the peeling direction only before the detachment of meniscus. Then the water on the top surface of pillar A began to flow in the opposite direction in the recoiling process due to surface tension effect after the detachment of meniscus, which justifies the qualitative model considering the presence of DNA molecules proposed in a previous study.8 It indicates that DNA should play a minor role in forming dewetting pattern which can facilitate DNA stretching and patterning in this case, which also supports a hypothesis underlying this study that perturbation of DNA can be ignored in the simulation. The alignment of DNA nanostrands in our experiments is then explained by the liquid-bridge meniscus given in the simulation, which should contribute to the clustering and stretching of DNA nanowires, and the microdroplet with backward flow field left on the top surface of micropillar is believed to facilitate the uncoiling and immobilization of DNA nanostrands between two successive micropillars. This unique feature of dewetting behavior clearly gives a favorable explanation to the self-alignment of DNA nanostrands along the peeling direction between two successive micropillars.
034103-7
Patterning on micropillar surface
Biomicrofluidics 4, 034103 共2010兲
FIG. 5. 共a兲 Time series of velocity vectors of water at a vertical plane 共side view兲. 共b兲 Time series of velocity vectors of water at a horizontal plane 共top view兲.
We also found that there were no nanowires/nanoparticles left on the micropillars when the stamp was pressed on the solution before being peeled up. Moreover, we observed the temporary presence of a thin film of liquid on the stamp surface immediately after the stamp was separated from the solution. This is contrary to the apparently dry surface obtained when no pressure was applied on the stamp. We believe this was caused by the loading of the solution in the space among the micropillars as a result of pressing. This hypothesis is consistent with our simulation. Figure 6 depicts the predicted time evolutions of water front receding between successive micropillars with the initial water submergence of full micropillar height. As indicted by the calculation, liquid was trapped in the space among the micropillars after the meniscus moved away. We believe this was the liquid film that we observed in experiments. Moreover, neither microdroplets were left on the top surface of micropillar, nor effective bridge-shape meniscus formed between micropillars after dewetting in our simulation. Figures 7共a兲 and 7共b兲 further give the calculated time series of velocity vectors of water at a vertical and horizontal plane, respectively. The small microdroplet found during the dewetting process moved consistently with the peeling direction and finally merged into the fluid trapped among micropillars. Submergence of the micropillars resulted in the contact between the liquid and the floor of the micropillars. In this case, the capillary force includes contributions from not only the contact line on the side surface of the micropillars but also the contact line on the floor. The overall capillary force prevailed over the inertia force due to the larger area of wetted surface than that when only the micropillars are partially wetted. The increase of water submergence also enhanced the viscous drag on the moving fluid across micropillars because of the growth in wetted area, which additionally eased the reduction of fluid inertia. Thus, the fluid did not have enough inertia to overcome the capillary effect. This led to the entrapment of water among micropillars during the dewetting process. The main front 共representing the inertia effect兲 therefore had little influence on the flow behavior near the top surface of micropillars, where the capillary effect was dominant. After the dewetting, all the fluid near the top surface was captured by the surrounding water to fill the space among micropillars and then no microdroplet was found. Thus, the stretching, immobilizing, and patterning DNA nanostrands were impossible in this case. We further conducted the sensitivity study of microdroplet size on various submergence depth of water at the same peeling rate = 10 rad/ s. Figure 8 reveals the volume of microdroplet for the
034103-8
Lin et al.
Biomicrofluidics 4, 034103 共2010兲
FIG. 6. Time evolutions of water front among successive micropillars as filling the space between micropillars with water 共top and side views兲.
submergence depth hw ranging from 0.0 to 3.5 m, which is corresponding to zero and full water submergence. These calculations suggest that the volume of microdroplet varies little for hw = 0 – 2.8 m, which is close to the fluid volume estimated from the size of nanoparticle left on the micropillar, about 10 m3. However, there would be no microdroplet left as the submergence depth over 2.8 m 共about 80% of micropillar depth兲. This phenomenon is consistent with our aforementioned experiment at full water submergence. The growth of water submergence increases the viscous damping of micropillars and also the inherent capillary effect, which seems to prevail over the inertia force 共represented by the peeling speed兲 occurring in the dewetting process at a specific critical water submergence depth 共here is about 0.8h兲. Because the location of dewetting mainly determines the fluid region after the main front 共Fig. 4兲, the size of microdroplet should be mainly determined by the size of micropillars and their arrangement, but less influenced by the ratio of capillary force to inertia force. This simply implies the independence of microdroplet size on water submergence depth provided the water submergence is smaller than a critical depth.
034103-9
Patterning on micropillar surface
Biomicrofluidics 4, 034103 共2010兲
FIG. 7. 共a兲 Time series of velocity vectors of water at a vertical plane 共side view兲. 共b兲 Time series of velocity vectors of water at a horizontal plane 共top view兲. Micropillars: gray. Water: cyan.
As indicated by the recent studies,13,14 water slip is clearly observed at hydrophobic surfaces, such as the outer surface of PDMS material. But a reliable value for the slip length  of water on PDMS surface is still not available at the present time due to insufficient experimental measurements. Here, numerical simulation was conducted to show the qualitative influence of slip length on the peeling rate for microdroplet generation on the column of micropillar. Table II summarizes the calculated cases for different combinations of peeling speed and slip length, where circles denote the cases with the formation of microdroplets and triangles denote the cases without any microdroplet left after the dewetting process. It is indicated by the numerical prediction that the upper limit of peeling rate for generating microdroplets on the column of micropillars decreases with the increase of fluid slip. Because high fluid slip implies small viscous drag on the contact
FIG. 8. The volume of microdroplet at a peeling rate of = 10 rad/ s.
034103-10
Biomicrofluidics 4, 034103 共2010兲
Lin et al.
TABLE II. Dependence of peeling rate on slip length for generating microdroplet on the column of micropillar 共쎲/䉱: with/without microdroplet left on the column of micropillar兲.
 共m兲
共rad/s兲
2 ⫻ 10−3
1 ⫻ 10−2
5 ⫻ 10−2
30 27 25 23 22 20 15
䉱 쎲 쎲 쎲 쎲 쎲 쎲
䉱 䉱 䉱 쎲 쎲 쎲 쎲
䉱 䉱 䉱 䉱 䉱 쎲 쎲
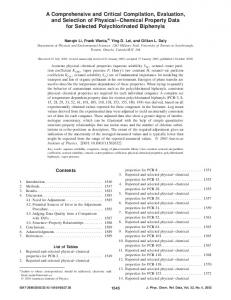
surface, initial fluid inertia governed by the peeling rate should be reduced in a slip case in order to obtain microdroplets on micropillars. Although the fluid slip can influence the upper limit of peeling speed for generating microdroplets, the basic mechanism to generate microdroplets via the breakup of liquid bridge is still valid for the slip case, which justifies our numerical approach and simplifies the complexity of calculation by assuming no-slip condition on the contact surface. Figure 9 depicts the patterning of nanowires and micro-/nanoparticles on the studied staggered micropillar array, characterized by circular pillars of 4.6 m in diameter 共D兲, 9.5 m in centerto-center distance 共L兲, and 3 m in height 共h兲. Figure 9共a兲 shows the generation of linear DNA nanowire array in a dewetting direction approximately parallel to the vertical lattice line. The nanowires well aligned in the peeling direction and were located across the gap between two neighboring micropillars, where micro-/nanoparticles were also uniform in size present on top of micropillars. In addition to the linear DNA nanowire array, the staggered micropillar array could generate other types of nanowire pattern as well. Figure 9共b兲 depicts the zigzag nanowire array created by peeling the micropillar-featured surface roughly along the horizontal lattice line, where
FIG. 9. SEM images of 共a兲 linear nanowire array, 共b兲 zigzag nanowire array, and 共c兲 fork-zigzag nanowire array on staggered PDMS micropillar stamps.
034103-11
Patterning on micropillar surface
Biomicrofluidics 4, 034103 共2010兲
the angle between two neighboring nanowire segments connected by a single micro-/nanoparticle was less than 180°. The zigzag angle mainly determined by the offset distance of micropillar given in the staggered arrangement was about 120° in the studied case. Similar to the nonstaggered case, the micro-/nanoparticles with homogeneous size located on top of micropillars were also eccentric, where the eccentric direction here took place not parallel to 共as indicated in the nonstaggered or linear case兲 but normal to the peeling direction. Other than the simple zigzag nanowire array, the fork-zigzag nanowire array shown in Fig. 9共c兲 was observed in our experiments when the PDMS stamp was peeled along the horizontal lattice line. The micro-/nanoparticles characterized by two nanowire segments, i.e., the main and child forks, connecting to upstream neighbors were located on the main thread of the zigzag nanowire. In contrast, the micro-/nanoparticles located off the main thread, which did not give any upstream nanowire segment, were smaller in particle size. The nanowire segment between two micro-/nanoparticles lying on the main thread of the zigzag nanowire was identified as the main fork. The angle between the main and child forks was about 60° in our experiment. Figure 10 illustrates the calculated time evolutions of water front receding between successive micropillars for the case of peeling along the vertical lattice line. The formation of bridge-shape meniscus which resulted by the capillary effect in the dewetting process is believed to mainly contribute to the clustering and stretching of DNA nanostrands, where the yellow dotted lines tracing the path of bridge-shape meniscus represent the predicted trajectories of DNA nanowires. The numerical prediction clearly reproduced the formation of linear nanowire array observed in Fig. 9共a兲, including the formation of microdroplets, which imply the creation of micro-/ nanoparticles. Through several numerical calculations, the simple zigzag case was found possible only when a small peeling angle was employed. Figure 11共a兲 depicts the calculated time evolutions of water front receding between successive micropillars for the case of peeling along the horizontal lattice line with a peeling angle of = 3°, which qualitatively agrees well with the experimental result given in Fig. 9共b兲. In order to illustrate the formation of zigzag nanowire array, Fig. 11共b兲 describes the time series of velocity vectors of water at a vertical plane located close to but below the top surface of micropillar. The numerical simulations reveal that the liquid bridge starting from pillar P1,0 was diverted to pillar P2,1, instead of pillar P1,2, for the case of = 0°, due to the initial peeling angle 共can be regarded as a small initial disturbance兲, which resulted in a stronger hysteresis effect of pillar P2,1 than that of pillar P0,1. This apparently resulted in an earlier meniscus detachment from pillar P0,1 than from pillar P2,1, which facilitated the formation of nanowire connecting pillars P1,0 and P2,1 through clustering and stretching DNA nanostrands in the liquid bridge and uncoiling and immobilizing DNA nanostrands via the microdroplet. This flow characteristic also enhanced the water entrapment at the lower part of pillar P2,1, which prevented the water meniscus from an early detachment from pillar P1,2, and eased the further development of liquid bridge connecting pillars P2,1 and P1,2. In this way, the liquid bridge could produce contiguous zigzag nanowire array by a zigzag DNA nanostrand element connecting PI,J, PI+1,J+1, and PI,J+2, where the indices I and J were even or odd numbers. However, the microdroplets predicted in our simulation only gave the location eccentricity parallel to the peeling direction, where the experiment indicates that the eccentricity should include a normal component. This inconsistence should be due to the negligence of forces of DNA nanostrands acting on microdroplets. Each microdroplet was connected by two DNA nanostrands with different directions, which created a net force roughly acting along the direction normal to the peeling direction on the microdroplet, which explained the location offset of micro-/nanoparticles in the direction of the vertical lattice line observed in our experiment, Fig. 9共b兲. Despite of disregarding the influence of DNA forces on the dewetting process, the numerical model still successfully delivered the main features of zigzag nanowire pattern. This further justified our assumption that the presence of DNA played a minor role in forming nanowire patterns via the dewetting process. In the case of linear nanowire array, the influence of DNA forces can be neglected, because the forces due to DNA nanostrands acted along the opposite directions with about the same magnitude and canceled out each other. Therefore, the assumption of neglecting the presence of DNA is a simplified but reasonable approach. For the case of fork-zigzag nanowire array, we found that the child nanowire
034103-12
Lin et al.
Biomicrofluidics 4, 034103 共2010兲
FIG. 10. Time evolutions of water front among successive micropillars for generating linear nanowire array 共top view兲.
branch was only possible when a different configuration of the first column in the micropillar array 共where the dewetting process started兲 was employed. Figure 12共a兲 compares the micropillar array configuration for the zigzag and fork-zigzag nanowire arrays in the numerical simulation. Because each fork-zigzag nanowire element covered four rows of micropillar array, the initial seed 共micropillars located at the first row兲 should be able to reflect this geometrical feature as an underlying presumption. Slight distortion of the array configuration on PDMS stamp could be a possible reason for triggering such nanowire pattern during the dewetting process. Figure 12共b兲 shows the calculated time evolutions of water front receding between successive micropillars along the horizontal lattice line at a peeling angle of = 3°, which has favorable agreement with the experimental result given in Fig. 9共c兲, where the yellow dotted lines denoted the predicted trajectory of main fork and the yellow solid lines represented the child one. The microdroplet array left after the dewetting process accounted for the micro-/nanoparticles found in the corresponding experiment.
034103-13
Patterning on micropillar surface
Biomicrofluidics 4, 034103 共2010兲
FIG. 11. 共a兲 Time evolutions of water front among successive micropillars 共top view兲. 共b兲 Time series of velocity vectors of water at a vertical plane 共top view兲. Micropillars: gray. Water: cyan.
This unique bridge-shaped meniscus due to the capillary effect led to the establishment of forkzigzag nanowire array on micropillar-patterned surface. Although our present simulation, despite of neglecting the presence of DNA, could deliver favorable agreement with experimental patterns and explain principal mechanism of patterning DNA nanowire array, some quantitative characteristics, such as the eccentricity, would be more accurately reproduced only when considering the presence of DNA nanostrands, i.e., the influence of DNA force acting on the meniscus and microdroplet. Another example is that micro-/nanoparticles were substantially different in size for the main and child forks in the fork-zigzag nanowire experiment, while the numerical prediction gave a similar size among microdroplets. This size difference could be explained by the hydrophilic DNA nanowires, where the microdroplets lying on the main fork connected by more DNA nanostrands resulted in a larger volume than that of the child one. With the help of our present numerical model, the major mechanism of how different morphologies of nanowire patterns were generated is disclosed through the analysis of dewetting process, but the advanced numerical modeling including the effect of DNA seems to be necessary for a more comprehensive study on patterning DNA nanowires on microstructured substrate, which is the main task of our future work. V. CONCLUSIONS
We experimentally generated stretched DNA nanowire arrays with various orientations and morphologies on micropillar-featured PDMS stamp and numerically investigated the dewetting process using simulations based on a deforming body-fitted grid approach. The simulation results revealed the detailed flow field and variation of meniscus at the micrometer scale that were consistent with the stretching and trapping the DNA nanowire observed in our experiments. For the nonstaggered micropillar array, the stretched DNA nanowires were straight and oriented in the direction of dewetting. The alignment of DNA nanostrands in experiments is explained by the
034103-14
Lin et al.
Biomicrofluidics 4, 034103 共2010兲
FIG. 12. 共a兲 Comparison of two micropillar array configurations in the simulation. 共b兲 Time evolutions of water front among successive micropillars 共dotted line: main fork, solid line: child fork兲.
liquid-bridge meniscus during dewetting, which should contribute to the clustering and stretching of DNA nanowires, and the microdroplets left on the top surface of micropillar after dewetting are believed to facilitate the uncoiling and immobilization of DNA nanostrands between two successive micropillars. The detachment or breakup of liquid bridge should be mainly determined by the force resulting from surface tension and the inertia force of fluid due to the dewetting process, which can be described by the dimensionless Weber number. The water submergence depth of micropillars played an important role in forming nanowire and nanoparticle array, where too deep water submergence would result in the failure of DNA patterning due to insufficient inertia to overcome capillary and viscous effects. The micro-/nanoparticle size should be governed by the geometrical dimension of micropillar array, provided that water depth did not exceed the critical value characterizing the ratio of inertia force to capillary effect. The fluid slip at the hydrophobic
034103-15
Patterning on micropillar surface
Biomicrofluidics 4, 034103 共2010兲
surface would result in small peeling speed to successfully pattern DNA nanowires and generate micro-/nanoparticles, because the viscous friction at the sliding surface is apparently smaller than that at the no-slip wall. For the staggered micropillar array, the zigzag nanowire array was obtained at small peeling angle, where the evolution of meniscus near micropillar accounted for the formation of nanowire pattern dissimilar to the peeling direction. The force of DNA nanostrands acting on microdroplets should account for the eccentricity of micro-/nanoparticles off the peeling direction. Additionally, the case of fork-zigzag nanowire array, featured by two upstream nanowire segments for the micro-/nanoparticles lying on the main fork, was possibly created by a slightly distorted micropillar array configuration from that of perfect zigzag arrangement. Successful modeling of the dewetting processes not only offers insights to the mechanism of this method but also reveals its great potential as a design tool for creating new nanowire patterns for device development.
ACKNOWLEDGMENTS
The authors wish to acknowledge the financial support from the National Science Council of ROC 共Grant No. 95-2745-E-033-003-URD兲, the Center-of-Excellence Program on Membrane Technology from the Ministry of Education of ROC, and the project of the specific research fields in the CYCU, Taiwan 共Grant No. CYCU-98-CR-ME兲. E. Braun, Y. Eichen, U. Sivan, and G. Ben-Yoseph, Nature 共London兲 391, 775 共1998兲. H. Kudo and M. Fujihira, IEEE Trans. Nanotechnol. 5, 90 共2006兲. 3 O. Harnack, W. E. Ford, A. Yasuda, and J. M. Wessels, Nano Lett. 2, 919 共2002兲. 4 C. A. P. Petit and J. D. Carbeck, Nano Lett. 3, 1141 共2003兲. 5 X. Michalet, R. Ekong, F. Fougerousse, S. Rousseaux, C. Schurra, N. Hornigold, M. v. Slegtenhorst, J. Wolfe, S. Povey, J. S. Beckmann, and A. Bensimon, Science 277, 1518 共1997兲. 6 A. Bensimon, A. Simon, A. Chiffaudel, V. Croquette, F. Heslot, and D. Bensimon, Science 265, 2096 共1994兲. 7 J. Guan and L. J. Lee, Proc. Natl. Acad. Sci. U.S.A. 102, 18321 共2005兲. 8 J. Guan, B. Yu, and L. J. Lee, Adv. Mater. 共Weinheim, Ger.兲 19, 1212 共2007兲. 9 C. H. Lin, J. Guan, S. W. Chau, and L. J. Lee, J. Phys. D 42, 025303 共2009兲. 10 Y. Xia and G. M. Whitesides, Angew. Chem., Int. Ed. 37, 550 共1998兲. 11 J. Guan, N. Ferrell, B. Yu, D. J. Hansford, and L. J. Lee, Soft Matter 3, 1369 共2007兲. 12 P. G. de Gennes, F. Brochard-Wyart, and D. Quéré, Capillarity and Wetting Phenomena 共Springer, New York, 2002兲. 13 D. C. Tretheway and C. D. Meinhart, Phys. Fluids 14, L9 共2002兲. 14 M. S. Chun and S. W. Lee, Colloids Surf., A 267, 86 共2005兲. 1 2