[HE91] M. Heath and J. Ethridge. âVisualizing ... 1991, pp. 29-39. [MC*95] Barton P. Miller, Mark D. Callaghan, Jonathan M. Cargille, Jeffrey K. Hollingsworth.
Performance Data Gathering and Representation from Fixed-Size Statistical Data Jerry C. Yan, Haoqiang H. Jin, and Melisa A. Schmidt {yan,hjin,schmidt}@nas.nasa.gov NASA Ames Research Center, Moffett Field, CA 94035
Abstract The two commonly-used performance data types in the super-computing community, statistics and event traces, are discussed and compared. Statistical data are much more compact but lack the probative power event traces offer. Event traces, on the other hand, are unbounded and can easily fill up the entire file system during program execution. In this paper, we propose an innovative methodology for performance data gathering and representation that offers a middle ground. Two basic ideas are employed: the use of averages to replace recording data for each instance and ÒformulaeÓ to represent sequences associated with communication and control flow. The user can trade off tracing overhead, trace data size with data quality incrementally. In other words, the user will be able to limit the amount of trace data collected and, at the same time, carry out some of the analysis event traces offer using space-time views. With the help of a few simple examples, we illustrate the use of these techniques in performance tuning and compare the quality of the traces we collected with event traces. We found that the trace files thus obtained are, indeed, small, bounded and predictable before program execution, and that the quality of the space-time views generated from these statistical data are excellent. Furthermore, experimental results showed that the formulae proposed were able to capture all the sequences associated with 11 of the 15 applications tested. The performance of the formulae can be incrementally improved by allocating more memory at runtime to learn longer sequences.
1. Introduction Computing today increasingly depends on the effective utilization of multiprocessors. Systems currently available range from those with tightly-coupled processors to those with a network of workstations. Innovation in hardware technologies continuously reduce the communication time between processing nodes as well as access latencies across the memory hierarchy to support computing in this new environment. Unfortunately, the software infrastructure (e.g. programming languages, compilers, operating systems, and performance monitoring and prediction tools) Page 1 of 25
available today still has not kept pace with the state-of-the-art multiprocessing hardware [Pan91, SMS95]. In particular, the lack of useful, accurate facilities for measuring and analyzing program performance is particularly distressing, since performance is the raison dÕ•tre for parallelism. 1.1 Performance Analysis Systems Traditional performance-analysis systems (e.g. gprof) that generate textual information have proven quite effective for sequential programs. Metrics based on the distribution of elapsed time across the program can systematically direct the user towards time consuming regions of code where performance should be improved. Unfortunately, such simple measures are insufficient for parallel programs and may even be misleading [HIM91]. This problem arises primarily because aggregate values do not necessarily capture the dynamic interactions between various processes (and processing nodes) involved in the computation. In order to fully understand the performance of a particular program on a particular machine, a performance tool must capture and analyze dynamic execution characteristics. Visualization has been used extensively to represent simulation results for many complex physical systems. In the past five years, the application of visualization technologies to manage the vast amount of performance data collected in multiprocessors has also been proposed. Many tools supporting performance visualization are available today, either in the public domain (e.g. AIMS [YSM95], Pablo [RO*91], Paradyn [MC*95], and ParaGraph [HE91]) or as part of a multiprocessorÕs system software (e.g. CXTRACE on ConvexÕs SPP-1, ParAid on IntelÕs Paragon, MPP Apprentice on CRIÕs T3D, PRISM on TMCÕs CM5, and PV on IBMÕs SP2). Typically, performance data are displayed post-mortem. These displays provide valuable feed-back about usersÕ choice of parallel algorithm, strategies for load balancing and data distribution, as well as how the application will scale with increasing numbers of processing nodes and problem sizes. A good survey of some state-of-the-art research efforts can be found in [PMY95, SK90]. 1.2 Statistics vs. Event Traces: A Comparison Broadly speaking, there are two kinds of performance data: statistics and event traces. Statistics are concerned with counts and duration: e.g. how many times a procedure has been called and, on average, how long it took to complete. Event traces, on the other hand, record the exact sequence (and in most cases, the actual time) of actions that took place during program execution. Furthermore, when the clocks across processing nodes are synchronized, event traces can help provide a global picture of what took place (e.g. how long a message took to reach node b from node a). As of today, all the trace tools that animate parallel program execution (e.g. using space-time diagrams) require synchronized event traces from multiple nodes.
Page 2 of 25
Space-time view
nodea nodeb nodec
Procedure A idle time Procedure B nodea b) The fact that communication nodeb overlaps computation is only visible on nodec the space-time view
Elapsed Time Space-time view
Elapsed Time
Histogram
nodea nodeb nodec Histogram
Cumulated Time
a) The fact that nodec is “behind” nodea and nodeb is only visible on the space-time view
Cumulated Time
One might suggest that event traces should always be gathered since they contain much more information. Unfortunately, event traces in general are large and the size of the trace file is not predictable before program execution. Furthermore, the collection process itself is expensive and requires a lot of resources. The most intrusive activity to support event traces involves the need to allocate memory buffers dynamically in order to save the performance data and flushing to disk when these buffers are full. In fact, two commercial vendors (CRIÕs MPP-Apprentice and TMCÕs PRISM) have opted not to support event traces, possibly to avoid excessive perturbation on observed program behavior. In both cases, the user locates bottlenecks by studying the amount of time a procedure or source line consumes and the activity that took place during this time. The reasons so many other vendors (e.g. CXTRACE on ConvexÕs SPP-1, ParAid on IntelÕs Paragon, and PV on IBMÕs SP2) are still supporting event tracing can probably be explained by the differences of the two representations as discussed below.
nodea nodeb nodec
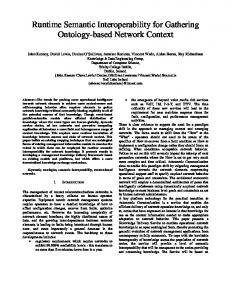
Figure 1. Comparing space-time views vs. histograms in their abilities to capture program behavior in 2 cases: a) computation/communication overlap, and b) load-imbalance. Figure 1 compares the abilities of two visual representations supporting parallel program behavior analysis, histograms vs. space-time views. Two interesting parallel program behavior patterns involve synchronized behavior across nodes and communication-computation overlap. In the space-time views shown on the left of Figure 1, each horizontal bar indicates activity that took place at a node during a given time interval. ÒWhite spacesÓ indicate idleness, possibly waiting for the arrival of a message. Messages are indicated as lines drawn from the sender node to the receiver node. Each column of the histograms on the right plots accumulated time for various ac-
Page 3 of 25
tivities for the corresponding node. Basically, nodea, nodeb, and nodec were all executing Procedure A at the beginning of the time interval being monitored. In Figure 1a, nodes exchanged messages in a cyclic pattern. The fact that nodec was ÒbehindÓ nodea and nodeb is only visible on the space-time view. In Figure 1b however, after Procedure A terminated, nodeb sent messages to nodea and nodec before they all entered Procedure B. Although the user may suspect the existence of load imbalance based on the histogram, the fact that communication overlaps computation is only visible on the space-time view. Table 1 gives a more detailed comparison between statistics and event traces in three areas: collection requirements, trace file size and analyses these traces support. Two observations need to be highlighted: 1. Event traces are relatively larger and unbounded. This can be a severe problem in practice. 2. Event traces support a much richer variety of analyses critical towards understanding the behavior of parallel programs. It is, therefore, not surprising that a lot of tools available today are still based on event traces. 1.3 Trace File Reduction Attempts As mentioned above, event traces contain much richer information, but unfortunately the size of a trace file is unbounded. Attempts have been made to reduce trace file size. In the Automated Instrumentation and Monitoring System (AIMS) [YSM95] that was developed at NASA Ames Research Center, two techniques for trace file reduction had been considered: 1. Merging trace records that always occur in pairs: a) Message (e.g. send, receive, broadcast) blocking and unblocking. b) Code-block (e.g. procedure, loop) entry and exit. 2. Using binary encoding for trace records. In the first technique, a new trace record type was defined and used in place of two individual records to eliminate some duplicate fields (e.g. the message type, size, and, tag). Our studies indicated that trace record merging resulted in a reduction of 27% of the number of trace records, which translated to an average reduction of 38% in actual trace file length in ASCII. Binary trace encoding is the second technique to reduce trace file size. Researchers working on Pablo [RO*91] reported 40% savings with the use of binary (vs. ASCII) representation. Our own calculations also indicated similar savings (from 40% to 50%). In summary, the trace file would only shrink by a factor of 4 even if both techniques were applied simultaneously. This was insufficient because applications of interests will scale up an order of magnitude in problem size as well as number of nodes. Furthermore, no matter how compact the representation may become, the generation of event traces leaves the trace file length Page 4 of 25
unbound. A fundamental re-thinking of the process of performance instrumentation, monitoring and trace representation is required in order to limit trace file length while preserving the rich content available in event traces. Trace collection overhead
reading system clock synchronizing clocks across nodes allocate memory buffer flushing to disk during execution processing requirements
Trace file size Trace classification of % time spent on various activities Analysis code block (such as procedures, loops, and user-defined blocks) duration Supported alignment of code blocks, parallelism profiles, critical paths load imbalance due to the fact that identical code blocks take different times to execute across nodes load imbalance due to the fact that receiver is blocked before sender is ready, messages received out of order, identify communication/computation overlap, message transmission time
Statistics à à simple integer arithmetic predictable Ã
Event Traces à à à à memory management required unbounded Ã
average values
distinguishes each instance of invocation Ã
may suggest possibility
obvious and conclusive identification
Ã
Table 1. Statistics vs. event traces Ñ comparison of trace file contents 1.4 Outline of Paper This paper proposes an innovative approach for instrumentation, monitoring and trace representation to support a rich variety of performance analyses and, at the same time, putting stringent constraint on trace file size. Sections 2 and 3 describe how a space-time view can be constructed based on a fixed sized trace file. Sections 4 and 5 report preliminary experimental results, inviting the reader to consider whether these constructed space-time views do indeed reflect performance problems correctly and support the kind of analyses mentioned in Table 1.
Page 5 of 25
2. Constructing Space-Time Views based on Statistics 2.1 Understanding the Components of a Space-Time View Figure 2 shows a space-time view obtained from a detailed trace of a parallel matrix multiplication program (or, matmul). The program was written in FORTRAN, using the MPI message passing library, and executed on four nodes of an IBM/SP2. Figure 2(a) shows the complete execution history. There are three basic features: color bars, Òwhite spacesÓ and lines: 1. Each color bar indicates the start and end times for a particular code segment. 2. Each segment of Òwhite spaceÓ indicates the start and end times of idling/blocking. 3. Each line segment indicates the origin, destination, and, send/receive times of a message.
(b) Point “1”
(c) Point “2” If-ELSE
Send:mpi_bcast
Send:mpi_send
(a) Complete Trace Recv:mpi_recv 1 iteration
“Main”
Loop “a”
If-THEN
Figure 2. Analysis of the space-time diagram (a) complete execution trace of matmul; (b) zoomed-in view at point 1; (c) zoomed-in view at point 2 When Figure 2 is further analyzed with reference to the source code, a few more observations can be made: • Matmul is an spmd (single program multiple data) parallel application, all nodes share the same initialization sequence (labeled “Main” in Figure 2).
• Node 0 behaves differently from the rest of the nodes because the code contains conditionals of the form “if (node_id == 0) then ... ; else ...”. Two features that distinguished the behavior of Node 0 from the rest of the nodes are clearly distinguishable: a) After initialization, node 0 executed Loop ÒaÓ a few times while the rest waited. b) The ÒthenÓ part of one conditional was executed at node 0 (Figure 2(a)) whereas the ÒelseÓ portions of some other conditionals were executed at the rest of the nodes (Figure 2(c)).
Page 6 of 25
• The duration of each iteration in
1. Drawing color bars:
a) identify the boundaries of all sequential code blocks of the program (these include, procedures and • Different nodes idle for different loops, if-then-elseÕs, and targets for gotoÕs etc.), times awaiting the arrival of b) record the duration of each code block, and messages (e.g. as shown in c) reconstruct the sequence in which these code blocks Figure 2(a)). Idling could be occur. caused by message sending (e.g. 2. Drawing white spaces: a) identify all blocking constructs (e.g. sends, rea broadcast as shown in Figure ceives, broadcasts, barriers, waits etc.), 2(b) or a point-to-point send as b) record the duration of each idling instance, and shown in Figure 2(c)). c) record the sequence in which these white spaces occur with respect to the color bars. 2.2 Refining Our Requirements 3. Drawing message lines: Based on these observations, the rea) record the receiver for each send construct and the sender for each receive construct, quirements for constructing space-time b) record the ID or type for each message so that views can be stated in terms of resendÕs and receiveÕs can be matched correctly1 , and quirements to construct its three major c) reconstruct the sequence in which these sendÕs and receiveÕs occur. components: the color bars, white
a loop (e.g., Loop “a”) differs.
spaces and message lines as summa- Table 2. Requirements for performance data conrized in Table 2. For example, retent to construct a space-time view quirement-1 in Table 2 implies that the control flow (for example, the branch sequence of a conditional) has to be monitored and reproduced in the right order. The requirements for making trace file length fixed and predictable before program execution can be formalized as shown in Table 3. It is not difficult to see how these two sets of requirements cannot be met simultaneously. A simple example involves a program in which process 0 sends messages to ran- 1. The length of the trace file should be independent of domly picked processes for a random the input data (e.g. no. of iterations, problem size). 2. Trace file size may scale with the number of nodes number of times. The list of message on which the execution takes place. We feel that the receivers is unboundedly long and arbinumber of storage devices could easily scale nicely trary. The data required for constructwith the number of nodes. ing a space-time view can only be 3. Trace file size may vary with different programs but should be independent of input data. captured by an unbounded event list. 4. Performance data needs to be gathered for the entire Fortunately, most real programs do not program, not limited to a portion of the execution at behave in a completely random fashion. the beginning. This leaves room for the possibility of Table 3. Defining ÒfixedÓ trace file length 1
For example, if node 1 sends two messages to node 2 in rapid succession; having the message ID or type will help determine whether the messages are received out of order.
Page 7 of 25
using patterns to capture program behavior. 2.3 Collecting Data for a Space-Time View Two basic ideas are employed to help limit the length of the trace file before program execution: the use of ÒaveragesÓ to replace recording data for each instance, and ÒformulaeÓ to represent infinitely long sequences of values. The first idea is relatively straightforward: statistical information about total time spent in each code block and the number of times each code block2 executes is gathered. The space-time view constructed based on this data will only reflect Òaverage durationÓ for each code block (e.g. the total time for executing a loop can be correctly represented while it will not be possible to pinpoint exactly how long a particular iteration actually took).
a) messages
sent from node 0 in a space time diagram
node-0 node-1 node-2 node-3
receivers of messages
1 2 1 1 2 2 1 2 3 1 3 1 1 3 2 1 3 ...
b) from node 0
c) attributing message receivers according to the order loop-begin ... send-#1 ... send-#2 ... send-#3 ... loop-end
in which send constructs occur in the source code 1 1 1 1 1 1... 2
2
2
3
3
3...
1
2
3
1
2
3...
Figure 3. Analyzing message patterns generated by a parallel program The second idea is best illustrated by considering message lines on the space-time view (e.g., as shown in Figure 3a): in order for a line to be drawn, a unique sender and a unique receiver must be associated with each message. For all the sendÕs along each time line to be correctly connected to other time lines, the sequence of message receivers must be correctly reproduced (e.g., as shown in Figure 3b). Now this seemingly complex sequence of receiver nodes originates from a sequence of send constructs (e.g., as shown in Figure 3c (left)) that was executed. When the sequence of receivers are broken down according to the actual source code constructs (as shown in Figure 3c
2
A code block would include loops, procedures, sends/receives, as well as any Òbasic blockÓ defined in the classical sequential sense.
Page 8 of 25
(right)), simpler patterns usually emerge3. This concept of associating sequences with individual source code construct can actually be applied to six categories of constructs: i. the sequence of receivers for each sending construct, ii. the sequence of senders for each receiving construct, iii. the sequence of message tags for each send construct, iv. the sequence of message tags for each receive construct, v. the way in which branches are taken at conditional statements, and vi. the number of times a loop executes when the loop is encountered. A methodology for learning the behavior of each construct as well as a suitable representation for these patterns has to be chosen. Although there is no guarantee that any of these sequences can be captured by a finite ÒformulaeÓ (c.f. behavior that are designed to be random), it remains the subject of further experimentation as to what percentage of program constructs are, in fact, amenable to this kind of analysis. Four basic categories of formulae are proposed for learning and reproducing sequences associated with program constructs (see Table 4): 1. IDENTITY Ñ repetition of one value. 2. GENERAL Ñ non-repeating values. 3. ITERATION Ñ iterative series with constant difference between individual terms. 4. CYCLE Ñ after some sort of prologue, the rest of the series can be represented as a repetition of a fixed number of values. Formula Type
Formula
Example
id
identity
an
ge
general
ar bs ct du e v
it
iteration
cy
cycle
(a (a+i) (a+2i) ... (a+ki))n ap cq (ar bs ct du ev)n
aaaaaaaaaaa aaaabccdddde 1357913579 dadbbbccddddb
Table 4. Four simple formulae used in this experiment At run-time, the performance monitor determines whether a sequence can be captured with a formula, and if so, which one. The user allocates a fixed amount of memory for this purpose be-
3
Program segments resemble components of a complex machinery built for a specific purpose. Although the behavior of the entire machine may appear complex, its components tend to exhibit relatively simple and predictable behavior patterns.
Page 9 of 25
fore program execution. Of course, longer repeating sequences could be learned if more memory were available. Nevertheless, it should also be noted that are many possible formula types and some series cannot be captured by a fixed-length formula.
3. The AIMS Implementation 3.1 Basics of AIMS The Automated Instrumentation and Monitoring System, or AIMS [YSM95], has been developed at NASA Ames Research Center, under the High Performance Computing and Communications Program. AIMS consists of a suite of software tools for measurement and analysis of parallel program performance. An instrumentor first parses the applicationÕs source code to insert instrumentation at selected points. Upon execution of the instrumented program (linked with a machine-specific monitor library), a stream of events is collected into a trace file. Runtime monitoring perturbs program execution and can significantly alter the recorded communication characteristics and computation times. Such intrusion is removed by an intrusion-compensation module, using appropriate communication-cost models for the underlying architecture [YL93]. The compensated trace file thus yielded can then be input to various post-processing tools that analyze the performance characteristics of a program. AIMS provides two post-processing tools for performance visualization: the View Kernel (VK) to display the dynamics of program execution using a space-time view, and the Performance Index and Statistics Kernel (Xisk) to view statistical performance data and highlight the most time consuming procedures and data structure interactions that may need to be tuned. In the next few sections we proceed to discuss how AIMS is actually modified to collect statistical data, learn and record formulae for sequences, and reconstruct a space-time view for performance analysis. 3.2 Instrumentation Instrumentation is essentially a process of source-to-source program transformation. AIMSÕs instrumentor, xinstrument, first constructs a parse tree of the source code. Parse-tree nodes that correspond to instrumentable program constructs are identified and appropriately, modified or transformed. The instrumented source-code is then obtained by ÒunparsingÓ the transformed parse tree. In order to gather sufficient data to reconstruct the complete dynamic behavior of the program, xinstrument has to identify every sequential block in the program. These usually consist of Òstraight-line codeÓ between two instrumentable constructs. The example shown in Figure 4 uses a simple conditional to illustrate how the instrumentor and the monitor cooperate to capture control flow. Page 10 of 25
Source program Clock A Clock B
“If” succeeds Block #1 Block #2
Clock B’ Clock C
Block #3
“If” fails Clock A ... call foo() Block #4 ... if (n .eq. 99) then a = n*5+1;... endif ... call goo() Clock C ...
Figure 4. Defining sequential blocks and arranging clocks around a conditional Xinstrument will insert two extra4 clock-read statements inside the ÒthenÓ portion of the conditional. Xinstrument also takes note of the target to which gotoÕs take place in its assignment of sequential blocks. New instrumentation has to be added to the applicationÕs source code in order to capture or learn four elements of the application previously ignored: 1. Counts and duration: For each sequential block, information about how many times it was encountered and the total elapsed time for the code block is recorded. 2. Message patterns: At each send (and receive) construct, xinstrument inserts a learning module that attempts to capture the sequence of message tags (or IDÕs) as well as the corresponding receivers (and senders). 3. Branch sequences: A learning module is inserted around each conditional to capture the branch sequence. Now suppose that the conditional (shown in Figure 4) was executed 10 times and only 2 of which succeeded. The monitor will observe 2 instances of clock sequence: A-B-BÕ-C and 8 instances of A-C (thus generating enough data to deduce which two out of those ten branches were successful). 4. Loop patterns: A learning module is inserted around each loop to capture the pattern of iteration sequence. The number of iterations a loop executes each time it is encountered can be different. The data thus collected captures the control-flow of the entire program, thus enabling reconstruction of run-time behavior.
4
Clocks A and C can be obtained for free because procedure calls are already instrumented and the times of fooÕs termination and gooÕs commencement can be deduced.
Page 11 of 25
3.3 Monitoring AIMSÕs performance monitoring library, the monitor, defines a set of routines that xinstrument inserts into the application. They are responsible for initializing instrumentation and, gathering and storing performance data (see [YSM95]). Because only statistical data and fixedlength formulae are to be stored with this approach, the memory required for storing performance data for the entire execution at each node is fixed and predictable. All performance data is written to disk after program execution terminates. The largest augmentation to the monitor involves the building of learning modules capable of deducing formulae to capture repeating sequences. A learning module must also perform efficiently to minimize run-time overhead and, at the same time, be able to recognize and encode a wide variety of sequences. As shown in Figure 5, a learning module basically operates as a finite state machine in which each ÒstateÓ corresponds to a formula type that potentially describes the sequence.
State Transition Diagram initial value These tests are “cheaper” and occur much more frequently
id
same no.?
Nope! try this... ge
Nope! try this... it
Nope! try this... cy
cannot be learned ?
this the next no. expected
this the next no. expected
this the next no. expected
always
Figure 5. A learning module is structured as a finite state machine At first, the module assumes the simplest and most frequent case5. As the next value in the sequence appears, the learning module attempts to confirm the correctness of the current proposed formula. When a discrepancy arises, the next possible formula is tested (in other words, a Òstate transitionÓ occurs). When all (four) formulae fail to account for the newly observed value, the learning module concludes that the pattern cannot be learnt. The learning module is designed such that the process involved in comparing the next value against that predicted by the current formula is much cheaper than state transitions (i.e. testing a completely new formula) as they occur much less frequently. Therefore, the user may improve the predictive power of the module by appending more complex formulae (or in other words, adding more ÒstatesÓ) to this engine. At the end of execution, all the formulae and statistics are written out to disk and ready for postprocessing.
5
Recall from section 2.3, four simple formulae have been identified (c.f. Table 4). Based on preliminary analysis of a few parallel applications (to be described in section The Experiments), the most common case is Ò ID Ó (which may represent a conditional in which the branch is always taken or a send construct sending to one recipient every time it is encountered).
Page 12 of 25
3.4 Post-processing (Event Trace Reconstruction) In order to construct a space-time view from the performance data (in the form of statistics and formulae) gathered using this approach, time-ordered events need to be generated. A simple algorithm has been implemented to accomplish this process:
d Then Pattern at node 0
a
Main
Proc. A
If
Invoked 11 times
c
b
Branch always taken at node 0)
Else
Seq. Code.
Loop Always executed 8 times
Send send to nodes 1 to 8 in sequence,...)
Receive always received from
f
g
node 0 with msg. tag 20
Seq. Code.
duration: average... max... min... first: ...
e
Figure 6. Annotated source tree ready for event-trace reconstruction 1. BUILD PARSE TREE based on lexical information about the source code collected by xinstrument. 2. ANNOTATE PARSE TREE using performance data. As shown in Figure 6, the annotation process involves the association of performance statistics and formulae to instrumented constructs and sequential code blocks. These associations allow the reconstruction of elapsed times, branch sequences, iteration counts, and message receiver/sender/tag sequences in the next two steps. 3. RECONSTRUCT CONTROL FLOW via annotated parse tree traversal. Program execution is simulated as the parse tree is traversed node-by-node in lexical order. At specific points where control flow information was determined dynamically, e.g. the way a branch took or the number of times a loop executed, the stored formulae associated at that node is used (c.f. at points c and d of Figure 6). 4. GENERATE INTERVAL DURATION at each node. The amount of time spent at each node can be approximated by the statistical performance data associated at each parse-tree node. 5. CHECK CONSISTENCY OF EVENT TIMES ACROSS NODES when communication occurs. This process of ensuring messages are sent before they are received also facilitates periodical cross-checking and adjustment of elapsed times at each processing node, thus resulting in a more consistent picture of the entire execution (cf. with Figure 6, at point f for processing node 0 and point g for other nodes). 6. GENERATE TIMED EVENTS. The events are then collected as a time-ordered trace file for VK to build a space-time view.
Page 13 of 25
4. The Experiments 4.1 Quality of Statistical Space-time Diagram The methodology described here was applied to a few test programs and the NAS parallel benchmarks (NPB) [BB*91]. To illustrate the quality of the space-time diagram generated from statistical data, three examples, matmul (Figure 7) and the NAS parallel benchmarks SP (Figure 8) and BT (Figure 9), were compared with actual event traces. It can be seen that the overall characteristics of event traces is correctly represented by the space-time view derived from statistics: 1) the control flow of program executions was correctly recorded, 2) critical points (such as message passing, global blocking) were illustrated, 3) the total execution time was very close. The exception of the durations of individual iterations of a loop in matmul (c.f. Figure 2) is due to that averaged durations were used in the construction of the space-time views from statistics.
Figure 7. Space-time view for matmul: from a) event traces, and b) statistics gathered The total execution times of the six tested applications are summarized in Table 5. For a comparison, the corresponding values for uninstrumented and instrumented (i.e. event traces) are also included in the table. These values were taken from averages of three repeated runs for each application on 4 nodes of an IBM SP2. The overhead due to the instrumentation is reflected by 5 to 10% increase of execution time for the instrumented codes. The execution times for the two types of instrumentations (to produce event traces and statistical data) are very close. The slightly longer time (< 5%) to produce statistical traces is due to the extra cost of instrumenting control constructs, such as IF and LOOP statements, and the current implementation of the learning module.
Page 14 of 25
Figure 8. Space-time view for SP: a) from actual event traces, b) out of statistics gathered
Figure 9. Space-time view for BT: a) from actual event traces, b) out of statistics gathered Application Problem Size
Uninstrumented
Instrumented
Stat.-Trace
exec. time
overhead
exec. time
overhead
matmult
200 × 1000
0.24 sec.
0.26 sec.
8.3%
0.26 sec.
8.3%
BT
40 iters 12× 12 × 12
0.89 sec.
0.94 sec.
5.6%
0.97 sec.
8.9%
SP
40 iters 12× 12 × 12
0.43 sec.
0.47 sec.
9.3%
0.50 sec.
16.3%
LU
40 iters 12× 12 × 12
0.53 sec.
0.64 sec.
20.3%
0.70 sec.
32.1%
MG
40 iters 32× 32 × 32
1.12 sec.
1.52 sec.
35.7%
1.64 sec.
46.4%
CG
15 iters 1400
1.09 sec.
1.12 sec.
2.8%
1.13 sec.
3.7%
Table 5. Execution times (on IBM SP2) of uninstrumented vs. instrumented codes.
Page 15 of 25
4.2 Detailed Comparison of Trace Files In order to describe the quality of the space-time views generated from statistical data quantitatively, a block-by-block comparison of trace records in the generated statistical trace (simplified as Stat) and the actual event trace (simplified as Event) has been performed. Two quantities are compared (as illustrated in Figure 10): the relative position of an event time, p = tÕi - ti, and the time change of an execution block, d = bÕi - bi, where bi = ti+1 - ti and bÕi = tÕi+1 - tÕi. The first quantity, p, quantitatively compares how accurate two space-time views are in absolute terms, while the second quantity, d, indicates how close (or similar) two space-time views look in relative terms. Furthermore, discrepancies introduced in earlier parts of the execution impacts the quantity p but not d in later parts of the trace. These quantities are plotted as histograms for all the trace records for a given application and distributions, as illustrated in the right of Figure 10, are generated for a given bin-size. The spread of a distribution can be characterized by the standard deviation:
σ =
∑ ( p − p) ρ , 2
i
i
w = 2 ln 2σ
where p is the mean of the distribution, ρi is the probability, and w is the width at the half maximum (h) for a Gaussian distribution. The spread is a direct indication of the closeness of two trace files. The comparison of block time (d) is more realistic since it removes the uncertainty due to the program startup time and the progressive change due to different execution times. b1
b2
b3
t2
t1
t4
t3
b'1
b'2
b'3
w h
t'1
t'2
t'3
t'4
Figure 10 a) Block-by-block comparison of trace records, b) Statistical (Gaussian) distribution with height h and width w. Three types of comparisons (Event vs. Event, Stat vs. Stat, and Stat vs. Event) have been done for six tested applications. The results for both position spread (p) and block spread (d) are summarized in Table 6. The spread of Event-vs.-Event indicates the natural spread of repeated program executions. This value is used as a reference for the other two types. A quality factor is defined as the ratio of a given spread and the reference spread and is also included in the table. A factor of one indicates that the fluctuation of time differences is within the natural spread, as illustrated by
Page 16 of 25
the comparison of Stat vs. Stat. It is not surprising that the position spread of Stat trace vs. Event trace is much larger (quality factor is much smaller) than the corresponding block spread, as discussed in the previous paragraph. These differences can be seen from the distributions of p and d for MATMULT and BT shown in Figure 11. Probability
1 0.8 0.6
matmult Position Spread Stat vs. Event Event vs. Event Stat vs. Stat
0.4 0.2 0 -0.05
-0.04
-0.03
-0.02
-0.01
0
0.01
0.02
0.03
0.04
0.05
0.06
0.07
0.08
0.6 0.4
Probability
0.8
matmult Block Spread Stat vs. Event Event vs. Event Stat vs. Stat
0.2 0 -0.20
-0.16
-0.12
-0.08
-0.04
0.00
0.04
0.08
0.12
0.16
0.20
0.4
Probability
0.6
BT Position Spread Stat vs. Event Event vs. Event Stat vs. Stat
0.2
0 -0.05
-0.04
-0.03
-0.02
-0.01
0
0.01
0.02
0.03
0.04
0.05
0.06
0.07
0.08
0.4
Probability
0.6
BT Block Spread Stat vs. Event Event vs. Event Stat vs. Stat
0.2
0 -0.20
-0.16
-0.12
-0.08
-0.04
0.00
0.04
0.08
0.12
0.16
0.20
Figure 11. Position and block spreads of trace record times for matmult (a and b) and BT (c and d). The spread (or width) of Stat vs. Stat is slightly less than that of Event vs. Event: due to averaged information presented in statistical traces. The quality factor for Stat vs. Event is about 10% Page 17 of 25
worse (from the block spread) than that for Event vs. Event. This is a reflection of the use of averaged execution times for program constructs in the process of reconstructing the space-time view. This averaged representation would be distinguished in a real event trace, for example, execution time of a function call would be different with different input parameters, which could not be represented in the statistical trace. Position Spread (w) Application
Event vs. Stat vs. Stat Event
Block Spread (w)
Stat vs. Event
Event vs. Event
Stat vs. Stat
Stat vs. Event
matmult
3.36
3.38 (0.99)
3.50 (0.96)
0.037
0.033 (1.11) 0.039 (0.95)
BT
3.48
3.36 (1.04)
15.1 (0.23)
0.039
0.038 (1.04) 0.047 (0.83)
SP
3.31
3.32 (1.00)
11.3 (0.29)
0.039
0.037 (1.06) 0.048 (0.81)
LU
3.29
3.29 (1.00)
5.00 (0.66)
0.035
0.034 (1.01) 0.037 (0.93)
MG
3.29
3.29 (1.00)
12.3 (0.27)
0.035
0.034 (1.03) 0.040 (0.87)
CG
3.56
3.86 (0.92)
5.50 (0.65)
0.042
0.033 (1.27) 0.044 (0.95)
Table 6. Spreads of relative position and block time from different program executions (on IBM SP2, in milliseconds). The quality factors (see text) are enclosed in parenthesis. 4.3 Trace File Size Experiments have also been performed on trace file sizes. Figure 12 compares the variation of trace file size when SP and BT are executed with a problem size of 12×12×12. It is not surprising that the size of event trace files increases linearly as the problem size goes larger, while the size of statistical files remains constant. Based on this data, we can easily project that for full-scale executions (with problem size 162×162×162 for 200-400 iterations) it will be very difficult to use event tracing to obtain performance data. More experiments on various parallel programs (such as other NAS Parallel Benchmarks) are performed and similar results are obtained since the proposed methodology is designed to produce a small fixed length trace file. As can be seen from the next section, the use of fixed length formulae in the statistical tracing enables us to capture more than 90% of the execution sequences, and with the increase of formula size this percentage also increases, yielding always predictable trace file size. For those truly random execution sequences, multiple or variable-length formulae may be used although the size of the resulted trace file may increase. However, since random execution sequences usually are very small percentage (less than a few percent) of the whole program execution, the change of the trace file size is expected to be nominal (less than a few percent of the increase in a real event trace file).
Page 18 of 25
30000
“SP” on 4 Node
1200
Tracefile Size (kb)
Tracefile Size (kb)
1400
1000 Event Trace Extended Statistics
800 600 400 200
No. of Iteration
“BT” on 4 Node
25000 20000 15000
Event Trace Extended Statistics
10000 5000
No. of Iteration
0
0 0
25
50
75
100
0
5
10
15
20
Figure 12. Trace file size comparison
No. of Send/Recv Constructs
In summary, the space-time view derived from the statistical data (stat-trace) gives a reasonable representation of the overall trace picture with critical points accurately demonstrated (important for performance analysis). The use of stat-tracing eliminates the need of trace flushing in the middle of program execution and, thus, produces trace file with less 900 860arc2d32 distortion and predictable size. When problem size gets very Application 800 Communication large, event trace becomes very Characteristics large and statistical trace wins. 700
4.4 Ability to Capture Application Characteristics Perhaps many readers are wondering how effective these four formulae were in capturing sequences associated with parallel applications. Figure 13 puts the applications tested along two axes. The y-axis, labeled ÒNo. of Individual Send/Recv ConstructsÓ, measures the (static) complexity of the source code. The x-axis, labeled ÒNo. of messages SentÓ, measures the
600 500
mpicg16
mpibt16 mpisp16 860arc2d16
400
pvmmg32 m2-64
300
mpilu16
pvmmg16
200
pvmcg17
m2-32 mpimg16
100
m2-16 pvmtrans16 pvmmert5
0 0
20000
No. of Messages Sent 40000
60000
80000
100000
Figure 13. Characteristics of applications tested Page 19 of 25
(dynamic) execution complexity. It suffices to say that most programs consist of hundreds of individual send/receive constructs sending tens of thousands of messages during execution. These represent fifteen PVM and MPI programs executed on 8 to 64 nodes on the Intel Paragon, IBM SP2, as well as a network of workstations (on various data sizes). Again due to length considerations, only results related to message sending and receiving are reported. The nature of branch sequences and loop iteration counts are much simpler and will be reported in a future paper. Percentage of Messages with Sender/Receiver Captured Using Various Formulae
Percentage of Messages with Sender/Receiver Captured Using Various Formulae General 28.2%
100%
Iterative 6.7%
90% 80% 70% 60%
Cycles 5.1%
50% 40%
100%
pvmtrans16
pvmmg32
pvmmg16
pvmmert5
mpisp16
pvmcg17
mpilu16
mpimg16
mpibt16
Guessed 0.3% Missed 5.4%
Identity 54.2%
mpicg16
m2-64
860arc2d16
0%
m2-32
10%
Cycles (too long) General (too long) Cycles Iterative General Identity m2-16
20%
860arc2d32
30%
Percentage of Messages with Tag Captured Using Various Formulae
Percentage of Messages with Message Tag Captured Using Various Formulae General
90%
14.4% 80%
Iterative 9.1%
70% 60% 50% 40% 30%
Cycles 13.1%
20%
Guessed Missed 4.8% 4.8%
pvmtrans16
Identity 53.8% pvmmg32
pvmmg16
pvmmert5
pvmcg17
mpisp16
mpimg16
mpicg16
mpibt16
m2-64
m2-32
m2-16
860arc2d32
860arc2d16
0%
Cycles (too long) General (too long) Cycles Iterative General Identity mpilu16
10%
Figure 14. Ability of formulae to capture message tags used in 15 applications The ability of various formulae to capture message tags and sender/receiver used are shown in Figure 14 and Figure 15 respectively. There are four charts in each figure; the top two represent static counts Ñ showing percentages of constructs in the source code learnt whereas the bottom Page 20 of 25
two represent dynamic counts Ñ showing percentages of messages actually sent during execution. The pie charts on the right represent summaries of the detailed data displayed on the left. Percentage of Constructs with Sender/Receiver Captured Using Various Formulae
Percentage of Constructs with Sender/Receiver Captured Using Various Formulae General 23.6%
100% 90%
Iterative 2.7%
80% 70% 60% 50%
Cycles 1.2% Missed 1.3%
40% 30% 20% 10%
Identity 71.3% pvmmg32
pvmtrans16
pvmmg16
pvmcg17
pvmmert5
mpisp16
mpimg16
mpilu16
mpicg16
mpibt16
m2-64
m2-32
Cycles Iterative General Identity m2-16
860arc2d32
860arc2d16
0%
Percentage of Constructs with Message Tag Captured Using Various Formulae
Percentage of Constructs with Message Tag Captured Using Various Formulae
100%
General 16.7%
90% 80%
Iterative 7.1%
70% 60% 50%
Cycles 4.8%
40% 30%
Missed 5.8%
20% 10% pvmmg32
Identity 65.7%
pvmtrans16
Cycles Iterative General Identity pvmmg16
pvmmert5
pvmcg17
mpisp16
mpimg16
mpilu16
mpicg16
mpibt16
m2-64
m2-32
m2-16
860arc2d32
860arc2d16
0%
Figure 15. Ability of formulae to capture senders/receivers used in 15 applications A number of observations can be made. First, the formulae capture all message tags in 11 test cases and all sender/receivers in 13 of the 15 test cases6. Second, the ÒIDÓ formula accounts for most cases: in other words, most programmers use a constant in their code for message tag and
6
The reader should note that the percentage of sequences learnt depends on the length of formulae. The data presented here represent formulae of a maximum sequence length of 18. Longer sequences can be learnt by allocating more memory for monitoring at run-time.
Page 21 of 25
sender/receiver. Finally the reconstruction algorithm can actually obtain some of the numbers in the sequences up to the point where the formula failed.
94%
Some preliminary experiments were car90% ried out to study the effect of formula length. Figure 16 shows the perform86% ance of the formulae averaged over all % of sender/ receiver learnt the applications. It can be seen that as 82% % of messages expected, allocating more memory inlearnt deed, captures longer sequences and Formula Length thus allows more sequences to be learnt. 78% The designed simple formulae can learn 5 10 15 20 25 more than 90% of the patterns with a Figure 16. Effect of formula length on percentages given formula length. In principle the of message tags and senders/receivers learnt failed percentage of patterns (e.g. from random sequences) can be eliminated by starting a new learning cycle, i.e. use of multiple formulae for a given pattern, or by dynamically increasing the formula length. The increase of trace file size is expected to be nominal and should be a few percentage of the increase of a real event trace file.
5. Conclusions and Future Work In summary, an innovative approach has been proposed for performance instrumentation, monitoring, trace data representation, and execution reconstruction. This approach is based on the assumptions that program behavior is, in general, not random and that critical control flow information (such as branch sequences, loop bounds, and message tags/senders/ receivers named in communication calls) can be represented using repeating sequences. Furthermore, the length of these sequences is short (on the order of the number of nodes participating in the computation) and can be captured and regenerated using simple formulae. This approach requires a completely new set of instrumentation to be inserted into the application before compilation and a new set of tools for reconstructing execution history. This methodology has been tested with fifteen applications, most of which consist of the NAS Parallel Benchmarks. There are four major results: 1. The data files thus obtained are, indeed, small, bounded and predictable before program execution. Page 22 of 25
2. The quality of the space-time views generated from these statistical data is excellent. 3. Experimental results show that the formulae proposed were able to capture 95% of the sequences involving message sending and receiving (the most complicated among the six categories mentioned in section 4.4). This corresponds to 100% of all the sequences associated with 11 of the 15 applications. 4. The performance of the formulae can be incrementally improved by allocating more memory at run-time to learn longer sequences. By the use of variable-length formulae or multiple formulae, execution sequences can be learnt 100%. However, the impact on the trace file size needs further investigation. More experiments are needed to study the intrusion of the learning module and extra instrumentation on control flows, which may pinpoint to future improvements of our implementation. In particular, work still needs to be performed in two major areas to fully evaluate the applicability of this approach for actual systems: Dealing with unknowns Ñ Sequences that are either very long or truly non-repeating (e.g. as a result of non-determinism) cannot be learned. Even though experimental results suggest that these comprise less than 5% of the sequences associated with the programs we tested, they pose potential problems for event trace reconstruction. Message lines cannot be drawn on the space-time diagram when sequences associated message transmission cannot be reconstructed. Failure to reconstruct sequences associated with control-flow is much more problematic; the ÒremedyÓ depends on the type, past behavior and the context in the particular control-flow construct occur. In some cases, these potentially problematic constructs can be identified at instrumentation time and the user can be alerted to provide alternatives. Otherwise, the monitor can decide to fall-back on event-tracing for this small percentage of construct, still resulting in a much smaller trace file than a Òpure event traceÓ. Characterizing and reducing run-time overhead Ñ Although the most intrusive element for event tracing (namely the need to flush trace records to disk) has been eliminated, more constructs are instrumented and the cost of executing complex learning modules could become expensive. Nevertheless, with the current formulations and test cases, this mode of monitoring exerts less overhead than event tracing.
6. References [Pan91] C. M. Pancake, ÒSoftware Support for Parallel Computing: Where Are We Headed?Ó Communications of the ACM, Vol. 34, No. 11, 1991, pp. 52-64.
Page 23 of 25
[SMS95] T. Sterling, P. Messina and P. H. Smith, Enabling Technologies for Petaflops Computing, MIT Press, 1995 (see URL http://www-mitpress.mit.edu/mitp/recentbooks/ comp/enabling-petaflops.html). [Hea93] M. T. Heath, ÒRecent Developments and Case Studies in Performance Visualization using ParaGraph,Ó in Performance Measurement and Visualization of Parallel Systems, ed. G. Haring and G. Kotsis, Elsevier Science, 1993, pp. 175-200. [Mil93] Bart Miller. ÒWhat to Draw? When to Draw? An Essay on Parallel Program VisualizationÓ, Journal of Parallel and Distributed Computing, Vol. 18, No. 2 (June 1993). [YSM95] J. C. Yan, S. R. Sarukkai, and P. Mehra. ÒPerformance Measurement, Visualization and Modeling of Parallel and Distributed Programs using the AIMS ToolkitÓ. Software Practice & Experience. April 1995. Vol. 25, No. 4, pages 429-461 [RO*91] D. A. Reed, R. D. Olson, R. A. Aydt, T. M. Madhyastha, T. Birkett, D. W. Jensen, B. A. A. Nazief, and B. K. Totty. ÒScalable Performance Environments for Parallel Systems.Ó In Proceedings of the 6th Distributed Memory Computing Conference. April 1991. [HIM91] J. Hollingsworth, R. Irvin, and B. Miller, ÒThe Integration of Application and System Based Metrics in a Parallel Program Performance Tool,Ó Proc. Third ACM SIGPLAN Symp. on Principles and Practice of Parallel Programming (PPOPP), pp. 189-200, 1991. [HE91] M. Heath and J. Ethridge. ÒVisualizing the Performance of Parallel Programs.Ó IEEE Software, Vol. 8, No. 5, Sept. 1991, pp. 29-39. [MC*95] Barton P. Miller, Mark D. Callaghan, Jonathan M. Cargille, Jeffrey K. Hollingsworth R. Bruce Irvin, Karen L. Karavanic, Krishna Kunchithapadam, and Tia Newhall. IEEE Computer 28, 11 (November 1995). Special Issue on Performance Evaluation Tools for Parallel and Distributed Computer Systems. [SYG94] S. R. Sarukkai J. Yan and J. K. Gotwals, ÒNormalized Performance Indices For Message Passing Parallel Programs,Ó Proc. of International Conference on Supercomputing, Manchester, England, July 1994. [SK90] Performance Instrumentation and Visualization. M. Simmons, R. Koskela Ed., ACM Press. 1990. [YL93] J. C. Yan and S. Listgarten. ÒIntrusion Compensation for Performance Evaluation of Parallel Programs on a MulticomputerÓ. Proceedings of the ISCA 6th International Conference on Parallel and Distributed Computing Systems, Louisville, KY, October 14-16, 1993, pages 427-431.
Page 24 of 25
[GL*92]D. Gannon, J. K. Lee, B. Shei, S. R. Sarukkai, et al., ÒSigmaII: A toolkit for Building Parallelizing Compilers and Performance Analysis Systems,Ó Proc. Programming Environments for Parallel Computing Conf. Edinburgh, April 1992. [PMY95] Special Issue on Performance Evaluation Tools for Parallel and Distributed Systems, Ed., Cherri M. Pancake, Margaret L. Simmons, and Jerry C. Yan. IEEE Computer, November 1995, Vol. 28, No. 11. [BB*91]D. Bailey, J. Barton, T. Lasinski, and H. Simon (eds.), ÒThe NAS Parallel Benchmarks,Ó Report RNR-91-002, NASA Ames Research Center, January 1991.
Page 25 of 25