JRRD
Volume 49, Number 7, 2012 Pages 1005–1024
Performance on tests of central auditory processing by individuals exposed to high-intensity blasts Frederick J. Gallun, PhD;1–2* Anna C. Diedesch, AuD;1 Lina R. Kubli, MS;3 Therese C. Walden, AuD;3 Robert L. Folmer, PhD;1–2 M. Samantha Lewis, PhD;1–2 Daniel J. McDermott, MS;1 Stephen A. Fausti, PhD;1–2 Marjorie R. Leek, PhD1–2 1National Center for Rehabilitative Auditory Research (NCRAR), Portland Department of Veterans Affairs Medical Center, Portland, OR; 2Oregon Health & Science University, Portland, OR; 3Audiology and Speech Center, Scientific and Clinical Studies Section, Walter Reed National Military Medical Center, Bethesda, MD
Abstract—Thirty-six blast-exposed patients and twenty-nine non-blast-exposed control subjects were tested on a battery of behavioral and electrophysiological tests that have been shown to be sensitive to central auditory processing deficits. Abnormal performance among the blast-exposed patients was assessed with reference to normative values established as the mean performance on each test by the control subjects plus or minus two standard deviations. Blast-exposed patients performed abnormally at rates significantly above that which would occur by chance on three of the behavioral tests of central auditory processing: the Gaps-In-Noise, Masking Level Difference, and Staggered Spondaic Words tests. The proportion of blast-exposed patients performing abnormally on a speech-in-noise test (Quick Speech-In-Noise) was also significantly above that expected by chance. These results suggest that, for some patients, blast exposure may lead to difficulties with hearing in complex auditory environments, even when peripheral hearing sensitivity is near normal limits.
tion New Dawn [OIF/OEF/OND]) have resulted in unprecedented rates of exposure to high-intensity blasts, often resulting in traumatic brain injury (TBI) among members of the U.S. military. The Department of Veterans
Abbreviations: ABR = Auditory Brainstem Response, DD = Dichotic Digits, DPOAE = distortion product otoacoustic emission, EP = evoked potential, FP = Frequency Patterns, GIN = Gaps-In-Noise, GSI = Grason-Stadler, HL = hearing level, LLR = long latency response, MLD = Masking Level Difference, mTBI = mild traumatic brain injury, N0S0 = signal in phase with noise, N0S = signal out of phase with noise, NCRAR = National Center for Rehabilitative Auditory Research, OIF/OEF/OND = Operation Iraqi Freedom/Operation Enduring Freedom/Operation New Dawn, PTAHF = puretone average (high frequency), PTALF = pure-tone average (low frequency), PTSD = posttraumatic stress disorder, QuickSIN = Quick Speech-In-Noise, SD = standard deviation, SNR = signal-to-noise ratio, SPL = sound pressure level, SSW = Staggered Spondaic Words, TBI = traumatic brain injury, VA = Department of Veterans Affairs, WRAMC = Walter Reed Army Medical Center, WRS = word recognition score. * Address all correspondence to Frederick J. Gallun, PhD; VA RR&D National Center for Rehabilitative Auditory Research, 3710 SW US Veterans Hospital Rd, Portland, OR 97239; 503-220-8262, ext 57472; fax: 503-721-1402. Email:
[email protected] http://dx.doi.org/10.1682/JRRD.2012.03.0038
Key words: audiometric evaluation, auditory dysfunction, auditory processing disorder, blast, central auditory processing, evoked potential, hearing loss, rehabilitation, traumatic brain injury, Veterans.
INTRODUCTION The recent conflicts in Afghanistan and Iraq (Operation Iraqi Freedom/Operation Enduring Freedom/Opera-
1005
1006 JRRD, Volume 49, Number 7, 2012
Affairs (VA) 2011 TBI Comprehensive Evaluation Summary [1] estimated the prevalence of TBI in the OIF/OEF/ OND Veteran population at 7.8 percent. While the typical focus of auditory evaluation is on damage to the peripheral auditory system, the prevalence of brain injury among those exposed to high-intensity blasts suggests that damage to the central auditory system is an equally important concern for blast-exposed persons. Discussions with clinical audiologists and OIF/OEF/OND Veterans Service Office personnel suggest that a common complaint voiced by blast-exposed Veterans is an inability to understand speech in noisy environments, even when peripheral hearing is within normal or near-normal limits. Such complaints are consistent with damage to neural networks responsible for higher-order auditory processing [2]. The auditory structures most vulnerable to axonal injury are the lower- and mid-brain stem nuclei, the thalamus, and the corpus callosum. Damage may include swelling, stretching, and shearing of neural connections, as well as inflammatory changes in response to tissue injury [3]. There also may be a loss of synaptic structures connecting nuclei in the central auditory system, resulting in distorted or missing information transmitted to cortical centers [4–5]. The interhemispheric pathways connecting auditory areas of the two cerebral hemispheres run through the posterior half of the corpus callosum [6]. The corpus callosum is a structure that may be particularly vulnerable, as it has been shown to be damaged even in non-blast-related head injury [7–8]. Axonal damage to this part of the corpus callosum would be expected to interfere with auditory and speech processing, as well as other bilaterally represented auditory cortical functions. Furthermore, recent modeling work has revealed that the blast wave itself can exert stress and strain forces on the brain that are likely to cause widespread axonal and blood vessel damage [9]. Such impacts would not necessarily create changes visible on a medical image, but could still impair function by reducing neural transduction time, efficiency, or precision of connectivity. This wide diversity of potential damage and sites of injury also suggests that the profile of central auditory damage is likely to vary considerably among patients. For this reason, the first step in the diagnosis and treatment of blast-related dysfunction is the identification of which brain functions have been impaired.
TESTS OF CENTRAL AUDITORY FUNCTION Behavioral tests are mainstays of central auditory test batteries, and many have been shown to be both sensitive and specific to particular brain injuries. It may also be important, however, to include evoked potential (EP) measures (electrophysiological tests) of neural function [10] to complement the behavioral tests. The Auditory Brainstem Response (ABR) is a commonly used test that evaluates the integrity of the auditory nerve and brainstem structures, whereas measures from the auditory evoked late response reflect cortical processing [11]. Long latency responses (LLRs), which are sensitive to impaired neuronal firing and desynchronization of auditory information, are useful tools for the assessment of cognitive capability. Prolonged latencies in LLRs would suggest interruptions in neural transmission within or between cortical networks. This could be due to reduced cortical neuron availability or diminished neural firing intensity. In addition, longer neural refractory periods can result in reduced amplitudes of event-related potentials. The purpose of the current study was to determine whether performance on a battery of behavioral and electrophysiological tests of central auditory function differs between individuals who have recently experienced a high-explosive blast and those who have not. The study involved five behavioral and two electrophysiological tests designed to encompass aspects of central processing from the brainstem to the cortex. The selection of tests was based on the need to assess several important and potentially vulnerable aspects of auditory processing of complex sounds. These functions include the precise coding and preservation of temporal firing patterns that support speech understanding, pitch perception, and localization of sounds in the environment.
MATERIALS AND METHODS Participants The blast-exposed group was drawn from a group of patients who, upon returning to the (former) Walter Reed Army Medical Center (WRAMC) for medical treatment after deployment in Iraq or Afghanistan, were identified by medical staff as being exposed to at least one highexplosive blast within 1 year preceding study enrollment. All participants in this group had a notation in their medical record of exposure to a blast. A subject interview
1007 GALLUN et al. Central auditory processing and blast exposure
was conducted in order to obtain standard demographic information, a medical history, and an audiological history (including exposures to potentially damaging noise). No participants with greater than a mild TBI (mTBI) diagnosis were approached for enrollment, and no participants with hearing losses greater than 50 dB hearing level (HL) (pure-tone average of 0.5, 1.0, and 2.0 kHz) were included. All testing of blast-exposed patients was carried out in the Army Audiology and Speech Center at WRAMC. A control group of subjects who had not been exposed to a blast were recruited and tested at the National Center for Rehabilitative Auditory Research (NCRAR), Portland VA Medical Center (Oregon). The goal of testing this group was to establish normative data and statistical cutoffs for abnormal performance on these specific tests in a group of appropriately age- and hearing-matched control subjects. Recruitment of the control group followed testing of the patient group, which allowed statistical matching of the groups with respect to age, sex, and audiometric configuration. Subject Interview and Audiometric Evaluation In addition to the subject interview, medical records of participants were reviewed by the research team at WRAMC. Each military servicemember admitted to WRAMC from deployment who has been exposed to a blast is evaluated by the TBI team to assess the presence and severity of TBI. This evaluation consists of screening tests and subsequent detailed neuropsychological testing, if indicated. The diagnosis of TBI, and severity, are based on these tests as well as information concerning loss of consciousness, duration of any posttraumatic amnesia, alteration of consciousness, and imaging studies, when appropriate. The diagnoses of mTBI or no TBI were extracted from the medical records for each experimental subject in this study. No patients were included in this study with a diagnosis of moderate or severe TBI. Each subject underwent a comprehensive audiometric evaluation to establish configuration, severity, and probable site of lesion of any hearing loss. Pure-tone airand bone-conduction audiometry as well as clinical speech assessments (Quick Speech-In-Noise [QuickSIN] sentence recognition and NU-6 word recognition tests) were measured using a Grason-Stadler (GSI) GSI-61 audiometer (Eden Prairie, Minnesota) and Sennheiser HDA 200 headphones (Old Lyme, Connecticut). Immittance audiometry was conducted with the GSI Tympstar,
and distortion product otoacoustic emissions (DPOAEs) were collected at WRAMC using the GSI Audera and at NCRAR using the Mimosa Acoustics HearID systems (Champaign, Illinois). DPOAEs were collected at frequencies between 0.5 and 12.0 kHz. All test equipment at the two data collection sites was exactly the same (with the exception of the otoacoustic emission testing as part of the audiometric evaluation). All testing was carried out with the subject seated or reclining comfortably in a quiet room or a sound-treated audiometric booth. Behavioral Tests of Central Auditory Function The behavioral tests used in the study were recorded versions played over a Sony CD player (Tokyo, Japan) connected to the GSI-61 clinical audiometer [12–13]. Before presentation to subjects, the test levels were calibrated using the recorded calibration tones on each test. Tests were presented at 50 dB sensation level (i.e., 50 dB above the level at which speech is detectable) unless the subject indicated discomfort at the prescribed levels, in which case small adjustments in level were permitted. Responses were made verbally or by button press, depending on the requirements of the test. Subjects were given frequent rest breaks as needed. The behavioral testing took approximately 2 hours and was carried out over two experimental sessions. Temporal Pattern Perception Delay or disruption in the transmission of auditory information throughout the auditory pathways would likely result in temporal processing deficits [14–15]. Musiek et al. investigated patients’ temporal patterning abilities using the Frequency Patterns (FP) test [14], which is thought to be sensitive to lesions in the right cortex, the corpus callosum, and the brainstem [16–17]. It is resistant to mild hearing loss [18]. Musiek and Pinheiro developed this test of the ability to report sequences of three tone bursts that are presented to each ear independently [16]. Their procedures for this test were followed in this study. In each of the sequences, two tone bursts are the same frequency, while the third tone is a different frequency. Subjects were instructed to verbally repeat back the words “high” and “low” for the test items and were not allowed to hum or sing the responses. Three practice items were presented prior to the test. The right ear was tested first, followed by the left ear. If a subject incorrectly labeled any of the three tone bursts, that item was considered incorrect. Also, if the
1008 JRRD, Volume 49, Number 7, 2012
subject reversed the order of an item, that item was considered incorrect. Each ear was tested with 15 items. If all except one of the first 15 items were correct or incorrect, the testing stopped. Otherwise, the full 30-item test was administered. Auditory Temporal Resolution Temporal resolution was tested using the Gaps-InNoise (GIN) gap-detection task [13], which produces an estimate of the briefest temporal gap a listener can detect in a continuous noise stimulus. This test is also sensitive to lesions of the cortex and corpus collosum. Previous studies have found that up to 40 percent of patients with brain damage had abnormal gap-detection thresholds [15,19]. This test has been shown to have moderate sensitivity for identifying subjects with central auditory lesions and has high test-retest reliability [13]. The GIN test consists of a series of 6-second broadband noise segments. Each noise segment contains zero to three silent intervals (gaps). These gap durations are 2, 3, 4, 5, 6, 8, 10, 12, 15, and 20 ms and are pseudorandomized in occurrence and location within the noise segment. Following the protocol of Musiek et al. [13], subjects were instructed to listen for tiny “pops” or “clicks” that may or may not occur during the noise segments and to push a button to indicate that they heard the gaps. Subjects were instructed to respond immediately each time they heard a gap. Late responses were scored as misses. If there was any question about how many times a subject pressed the response button during a noise segment, the test was paused so the tester could verify the number of responses with the subject. A short practice list was presented only to one ear, with gaps that ranged from 8 to 20 ms. Each ear was tested separately, and the right ear was tested first. The test score was the percent correct responses at each gap duration, and a threshold was estimated based on the smallest gap for which the subject scored greater than 50 percent (gap detected on at least four of the six presentations), with all longer durations receiving a score greater than 50 percent. Binaural Processing and Sound Localization Temporal precision of neural firing is also involved in binaural processing and localization of sound in space. The Masking Level Difference (MLD) test evaluates the integrity of the earliest sites of binaural comparison and sensitivity to interaural phase in the brainstem, as well as cortical areas sensitive to spatial representations. The
MLD is a well-established psychophysical measure that has also been developed as a clinical test [20–21]. This measure of brainstem integrity is obtained by comparing the ability to detect a signal in the presence of noise that is either in phase or out of phase at the two ears. Without an intact binaural comparison system (which is located at the level of the brainstem), the two conditions are functionally equivalent, but with an intact system, threshold differences >12 dB are typically observed for lowfrequency pure tones. Binaural thresholds for a 500 Hz pure tone presented either in phase or out of phase between the two ears were determined in the presence of a binaural masking noise presented in phase. Several different signal-to-noise ratios (SNRs) were tested for the signal in phase with noise (N0S0), the signal out of phase with noise (N0S), and the noise with no tone present (catch trial). The subjects were instructed to listen for the beeps in the presence of the noise and say “yes” if they heard the beeps and “no” if they did not hear the beeps. This test does not contain practice items, but the test was paused if the subject needed additional time to respond. The MLD is the difference in decibel SNR for signal thresholds for the inphase and out-of-phase conditions. Dichotic Listening: Dichotic Digits Because of potentially compromised axonal and synaptic structures and diminished neural conduction, higher-level tasks such as dichotic listening may be affected in individuals exposed to high-explosive blasts. The Dichotic Digits (DD) test assesses dichotic listening ability using number identification with dichotic presentation of the stimuli [22]. The test is sensitive to lesions in the primary (left) cortex and in the corpus callosum. Musiek et al. found lateral effects when using this test, mostly in the left ears of subjects with brain pathology [14]. This test has good sensitivity to central auditory nervous system pathology, is relatively resistant to mildto-moderate high frequency cochlear hearing loss, and has high test-retest reliability [14]. Following the procedures outlined by Musiek, two digits were presented to one ear and two digits were presented to the other ear [22]. The test began with a practice that contained three test items. The subject was instructed to repeat back all digits, and order was not scored. The test contained 20 test items of four digits in each, and the individual digits were marked as a miss if the subject gave an incorrect response or failed to
1009 GALLUN et al. Central auditory processing and blast exposure
respond. Subjects were encouraged to guess rather than not respond at all. Dichotic Listening: Staggered Spondaic Words The Staggered Spondaic Words (SSW) test examines the ability to segregate and interpret competing speech presented to the two ears [23]. It is thought to be sensitive to lesions of the corpus callosum and cortex [24]. Deficits on the SSW test, including diminished left-ear responses, would suggest interhemispheric transfer deficits at the level of the corpus callosum. This test is useful in this patient population as it is resistant to the effects of peripheral hearing impairment [25] and has evidence of strong reliability and validity [26]. The SSW test consists of 40 pairs of “spondaic words,” and each spondaic word (“spondee”) contains two syllables spoken with equal emphasis on both syllables. Furthermore, each syllable of the spondee contains a complete word, an example of which is the spondee “hotdog.” On each of the 40 trials, one spondee is presented to the left ear and one is presented to the right ear in such a way that the second syllable of the first spondee presented to one ear overlaps in time with the first syllable of the second spondee presented to the other ear [23]. Scoring is based on the identification of the parts of the words presented in isolation and in competition, as well as the total number of errors. Each SSW item is made up of two spondaic words that are presented in a way that creates four test conditions: (1) right noncompeting syllables, (2) right competing syllables, (3) left competing syllables, and (4) left noncompeting syllables. Four practice items are presented prior to beginning the test. The test began with the first spondee presented to the right ear and the second spondee presented to the left ear. Subsequent items rotated between right ear spondee first and left ear spondee first throughout the 40 test items. Subjects were instructed to repeat back the words in the exact order they heard them presented. To score this test, we marked any incorrect words in the four test conditions as a miss and added up by test condition. In addition, if a subject repeated all of the words but in an incorrect order, the test item was marked as a reversal but the individual words were considered correct in the final count per test condition. The subject was allowed to take as much time as needed to respond to each item. Scores consisted of total errors as well as number of errors for each competing and noncompeting condition.
Evoked Potential Tests of Central Auditory Function Both testing sites used the same equipment and the same protocols that, once established, were loaded at both sites so that the protocol settings would be exactly matched to minimize errors. Verification of the equipment was accomplished by site visits of NCRAR audiologists to the WRAMC group. This enabled two individuals to be tested at both sites, further confirming the equivalence of measurement in the two locations. The EP testing took approximately 2 hours, including setup time. Auditory Brainstem Response The ABR has been used to help estimate the integrity of cochlear structures and central auditory pathways from the auditory nerve to the superior olivary complex. The ABR is characterized by five or six peaks in the response waveform that occur at particular times after sound presentation. Both latency and amplitude of the peaks and relationships among the peaks are important measures of brainstem function. The ABR was elicited using 100 µs clicks with rarefaction phase presented through ER-3A (300) insert earphones at 80 dB normal HL at a rate of 17 clicks per second for each ear independently (Etymotic Research, Inc; Elk Grove Village, Illinois). Using a Cadwell Sierra Wave EP system (Kennewick, Washington), ABRs were recorded from scalp electrode Cz (top of head) referenced to contralateral and ipsilateral mastoid electrodes, with the ground electrode placed at Fpz (forehead). Electrode placements were measured according to the International 10–20 system [27]; impedances were maintained at 0.05). Using a cutoff of 71 percent for the left-ear test and 65 percent for the right-ear test, 19 percent (7/36) of the blastexposed patients and 7 percent (2/29) of the control subjects exhibited abnormal performance when tested at
either the right or left ear. This difference was not statistically significant (2 = 2.12, df = 1, p = 0.15). Performance on Gaps-In-Noise Table 2 shows approximate gap thresholds estimated from performance on the GIN test, for the left and right ears. For the right-ear test, mean threshold for the control group was 3.79 ± 1.29 ms and mean threshold for the
1014 JRRD, Volume 49, Number 7, 2012
Figure 2. (a) Percentage of blast-exposed and control subjects who demonstrated abnormal performance on at least one subtest or component of each of the behavioral tests. (b) Percentage of subjects in two groups (blast-exposed and control) who performed abnormally on from 0 to 5 behavioral tests. DD = Dichotic Digits, FP = Frequency Patterns, GIN = Gaps-In-Noise, MLD = Masking Level Difference, SSW = Staggered Spondaic Words.
blast-exposed group was 6.03 ± 3.20 ms, which was a statistically significant difference (F(1,64) = 12.39, p = 0.001). A cutoff of 6 ms indicated that 31 percent (11/36) of the blast-exposed participants had approximate gap thresholds in the abnormal range, and none of the control subjects performed abnormally (2 = 10.66, df = 1, p = 0.001). For the left ear, mean threshold for the control group was 4.28 ± 2.10 ms and mean threshold for the blast-exposed group was 6.44 ± 3.12 ms, which was a statistically significant difference (F(1,64) = 10.33, p < 0.01). A cutoff of 8 ms indicated that 22 percent (8/36) of the blast-exposed participants had approximate gap thresholds in the abnormal range, and one of the control subjects performed abnormally (2 = 4.75, df = 1, p < 0.05). Figure 3(a) shows that 39 percent (14/36) of the blastexposed group had abnormal performance on the GIN test for either ear, as compared with 3 percent for the control group (1/29). The difference was statistically significant (2 = 11.37, df = 1, p < 0.01).
Performance on Masking Level Differences Average data for the MLD test are shown in Table 2. The average MLD for the control group was 13.59 ± 2.80 dB, and the average MLD for the blast-exposed group was 13.28 ± 3.74 dB. This difference was not statistically significant (F(1,64) = 0.136, p = 0.71). The N0S condition, which is the SNR needed to detect a signal presented with a 180° phase reversal between the two ears, had an average threshold for the control subjects of 24.83 ± 2.70 dB and an average threshold for the blastexposed group of 23.00 ± 3.66 dB. This difference was statistically significant (F(1,64) = 5.03, p < 0.05). The N0S0 condition, which is the SNR needed to detect a signal presented diotically (no binaural differences), had an average threshold for the control subjects of 11.24 ± 2.36 dB and an average threshold for the blast-exposed subjects of 9.72 ± 3.54 dB. This difference was also statistically significant (F(1,64) = 3.97, p = 0.05). Based on the SDs, cutoff values were set at 8 dB for the MLD, 7 dB for N0S0, and 19 dB for N0S. None of
1015 GALLUN et al. Central auditory processing and blast exposure
Figure 3. Grand average waveforms for Auditory Brainstem Response recordings. (a) Control subjects and (b) blast-exposed subjects. Both ears and both contralateral (Contra) and ipsilateral (Ipsi) presentations are shown. LE = left ear, RE = right ear.
the control subjects had thresholds outside the normal range on either of the component measures, while 17 percent (6/36) of the blast-exposed were abnormal on N0S0 (2 = 5.33, df = 1, p < 0.05) and 11 percent (4/36) were abnormal on N0S (2 = 3.43, df = 1, p = 0.06). For the MLD, 20 percent (7/36) of the blast-exposed subjects had MLD values of 8 dB, while only 3 percent (1/29) of the control subjects had MLDs in the abnormal range (2 = 3.81, df = 1, p = 0.05). Considering both the component subtests and the MLD score, 33 percent (12/36) of the blast-exposed were abnormal on one or more of the measures, while only 3 percent (1/29) of the control subjects
had one or more scores in the abnormal range (2 = 8.97, df = 1, p = 0.003). Performance on Dichotic Digits Performance on the DD test was well within the normal range for nearly all of the subjects and at or near perfect performance for many. As shown in Table 2, for the right ear, the mean accuracy for the control subjects was 97.67 ± 3.47 percent and mean accuracy for the blastexposed group was 96.60 ± 3.97 percent. For the left ear, the mean accuracy for the control subjects was 94.31 ± 5.97 percent and mean accuracy for the blast-exposed
1016 JRRD, Volume 49, Number 7, 2012
group was 94.24 ± 5.17 percent. These differences were not statistically significant (p > 0.25). Using a cutoff of 91 percent for the right ear and 82 percent for the left ear, 11 percent (4/36) of the experimental subjects performed abnormally for either the right or left ear, as opposed to 14 percent (4/29) of control subjects. This difference was not statistically significant (2 = 0.11, df = 1, p = 0.74). Performance on Staggered Spondaic Words Table 2 shows that the mean number of total errors for the control group on the SSW was 4.14 ± 3.03, while the mean for the blast-exposed group was 10.44 ± 6.52. This difference was statistically significant (F(1,64) = 23.05, p < 0.001). The cutoff value for normal performance was 10 errors, based on mean and SD of the control group. Only 3 percent (1/29) of the control subjects had 10 errors, while 36 percent (13/36) of the blastexposed subjects had between 10 and 29 total errors. In the left competing condition, 31 percent (11/36) of the blast-exposed subjects performed abnormally (8 errors) compared with 3 percent (1/29) of the control subjects. In the right competing condition, 39 percent (14/36) of the blast-exposed subjects performed abnormally compared with 0 percent (0/29) of the control subjects. Overall, 3 percent (1/29) of the control subjects and 44 percent (16/36) of the blast-exposed subjects performed abnormally on one or more of the subtests of the SSW. This difference was statistically significant different (2 = 13.98, df = 1, p < 0.001). Total Number of Tests in Abnormal Range Figure 2(b) shows the proportion of subjects in each group who produced abnormal performance on any of the five behavioral tests. Of the blast-exposed subjects, 75 percent (27/36) had abnormal performance on at least one test, as opposed to only 24 percent (7/29) of the control subjects. Of the 36 blast-exposed subjects, 17 (44%) showed abnormal performance on two or more of the behavioral tests, while 3 of 29 (10%) control subjects were abnormal on two or more tests and only one was abnormal on three tests. No subject had abnormal performance on all five behavioral tests. There was a statistically significant difference between groups in terms of the number of abnormal test results ( 2 = 17.50, df = 4, p = 0.002).
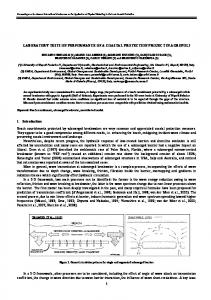
Evoked Potentials EP measurements were carried out on 19 blastexposed subjects and 29 control subjects. Two repeatable ABR and LLR recordings were collected and averaged for each subject. Traces were analyzed independently by three audiologists, using the software provided with the Cadwell Sierra Wave equipment. Disagreements concerning the peak locations within a trace were reconciled either by agreement of two of the three audiologists or by consultation with a highly experienced EP researcher (R. L. Folmer). In the final analysis, two blast-exposed subjects were excluded from the ABR and LLR results and one control subject was excluded from the ABR results because of unacceptable levels of artifact during the EP recording, which made the waveforms indistinguishable. All traces were baseline corrected. As the equipment was not designed for audiological testing, ABR latencies also needed to be corrected to account for the length of the insert earphone tubes used in order to correspond to standard clinical latencies (a shift of ~0.9 ms). Average peak latencies and amplitudes for the ABR are shown in Table 3 for the blast-exposed and control groups. Peak-to-peak amplitudes were calculated as the amplitude difference between the highest peak and the following valley. If either peak or valley for waves I, III, and V were indistinguishable, values from that wave were excluded from the calculations in Table 3, as indicated by the variable numbers of subjects included in each average (n). Consistent with previous reports in the EP literature, amplitude data were more variable than latencies. Grand averaged waveforms for the ABR measurements are shown in Figure 3 for both right and left ears as either ipsilateral or contralateral to the stimulus ear. Figure 3(a) includes the average of the control subjects (n = 29), while Figure 3(b) displays waveforms from the blastexposed subjects (n = 19). These waveforms and the values in Table 3 were quite similar between blast-exposed and control groups, and the average peak latencies and amplitudes did not differ significantly between groups. In contrast to the ABR waveforms, the later auditory components demonstrated different results for the two groups. The grand averaged waveforms shown in Figure 4 indicate responses to the right and to the left ear, for both the rare and the common stimuli. The mean data and SDs shown in Table 4 reflect the peak latencies and amplitudes in the grand average waveforms. Recall that baseline correction was applied to the amplitude to show the
1017 GALLUN et al. Central auditory processing and blast exposure
Table 3. Mean latencies and amplitudes of peaks I, III, and V in Auditory Brainstem Response (ABR) for ipsilateral (Ipsi) and contralateral (Contra) stimulation for blast-exposed and control subjects. Right- and left-ear (RE and LE, respectively) responses are shown separately. Data presented as mean ± standard deviation, and number of subjects contributing to each mean is shown as n. Note that not all subjects contributed values to all measures.
I
Parameter
RE
ABR Latencies Ipsi Control
0.11 n = 27 1.36 ±
Contra
n = 17 1.40 ±
Control
0.12
0.16 n = 17 1.35 ±
Blast-Exposed
0.19 n = 17 1.37 ± 0.20
0.20
0.11 n = 14
0.21
0.22 n = 12
0.22
0.17
0.24
0.30
0.24
n = 27 5.44 ±
n = 16 5.57 ±
n = 19 3.46 ±
n = 14
5.52 ± 0.28
n = 28 5.42 ±
n = 16 3.50 ±
n = 23 3.48 ±
LE
5.49 ± 0.27
n = 26 3.54 ±
n = 16 3.49 ±
n = 17 1.35 ±
RE
3.57 ± 0.15
n = 28 3.54 ±
n = 25 1.32 ±
V LE
3.56 ± 0.17
0.18
0.14
RE
1.33 ±
1.35 ± 0.10
Blast-Exposed
III LE
n = 17 5.60 ± 0.29
n = 27 5.57 ± 0.19
n = 14
n = 26 5.57 ± 0.20
n = 17
n = 17
ABR Amplitude Ipsi
Control
0.10 n = 27 0.13 ±
Blast-Exposed
n = 25 0.15 ±
n = 16 0.02 ±
Control
n = 19 0.05 ±
Blast-Exposed
0.14
n = 16
0.09
0.08
0.08
similarities between ears and the common and rare test conditions. Amplitude values are displayed in microvolts from baseline. A significant difference was seen between groups for the P300 latency in the right ear (t(42) = 2.65, p = 0.01). There was also a significant group difference for the P300 amplitude in the right ear (t(42) = 2.26, p = 0.03) and the N100 amplitude in the left ear (t(38) = 2.21, p < 0.05) for the rare stimulus condition. Viewed as a whole, results from the EP testing indicate similar performance between the blast-exposed and control groups (as well as within groups) for the earlier components (ABR and N100), with significant differences emerging for later components (P300, particularly the right ear), reflecting higher processing stages in the auditory system and cognitive centers of the brain. These findings are consistent with Segalowitz et al. [28] and
0.11
0.10
0.15
0.11
n = 17 0.22 ± 0.11
n = 27 0.20 ± 0.11
n = 15
n = 27 0.28 ±
n = 15 0.22 ±
n = 21 0.06 ± 0.08
n = 15
0.25 ± 0.14
n = 28 0.25 ±
n = 16 0.06 ±
n = 25 0.07 ±
n = 13
0.25 ± 0.15
n = 27 0.23 ±
n = 16 0.06 ±
n = 21 0.02 ± 0.06
0.06
0.22 ± 0.15
n = 28 0.22 ±
n = 17 0.05 ± 0.06
0.06
0.25 ± 0.16
0.10
0.06 Contra
0.21 ±
0.15 ± 0.10
n = 27 0.20 ± 0.14
n = 17
n = 17
Alberti et al. [29], who also reported lower amplitudes and longer latencies for auditory P300 components in subjects with mTBI. Lew et al. also observed smaller amplitude and longer latency auditory P300s from patients with histories of severe brain injury compared with nondisabled control subjects [30]. When the individual values for the blast-exposed patients were compared with the range of expected values based on the control data, however, significantly abnormal latencies and/or amplitudes were not observed, based on the criterion of plus or minus two SDs from the mean.
1018 JRRD, Volume 49, Number 7, 2012
such a diagnosis can be assumed to indicate injury severity among the blast-exposed experimental subjects tested here, that diagnosis was not reflected in significant correlations with abnormal performance on these central auditory tests. The diagnosis of TBI also was not significantly correlated with age, pure-tone average (low frequency) (PTALF) thresholds at 0.5, 1.0, and 2.0 kHz, or with puretone average (high frequency) (PTAHF) thresholds at 1.0, 2.0, and 4.0 kHz. Nor was there a significant correlation between a diagnosis of mTBI and the number of tests on which performance was abnormal. Those who completed the questionnaire and reported PTSD (13/31) were no more likely to perform abnormally on the GIN, MLD, DD, or FP tests (p > 0.50), nor was the total number of abnormal test results significantly associated with a report of PTSD. Performance on the SSW, on the other hand, was significantly associated with a report of PTSD, with 85 percent (11/13) of those
DISCUSSION Effects of Individual Factors: Number of Blast Exposures, mTBI, PTSD Recall that some of the experimental subjects reported they had experienced multiple blast events, while others only reported one such event. Of the 31 subjects who were willing to respond to questions about their blast-exposure experience(s), 13 reported more than one blast exposure and 18 reported only one exposure. An analysis of the rate of abnormal performances comparing these two subgroups across all of the subtests examined, as well as the total number of abnormal test results, did not result in any significant differences. Similarly, a medically driven diagnosis of mTBI (by the WRAMC TBI team) was also examined as a potential additional factor beyond blast exposure and did not reveal any significant differences between the 19 subjects who were diagnosed with mTBI and the 17 who were not. If
Table 4. Mean latencies and amplitudes of each peak in long latency responses (LLRs) for rare and common stimulus presentation conditions for blastexposed and control subjects. Right- and left-ear (RE and LE, respectively) responses shown separately. Data presented as mean ± standard deviation, and number of subjects contributing to each mean is shown as n. N100 P160/200 N200 P300 Parameter RE LE RE LE RE LE RE LE LLR Latencies Rare Control
97.3 ± 7.5
BlastExposed Common
n = 27 95.7 ± 5.2 n = 17 97.1 ±
Control 11.7 BlastExposed
n = 27 94.1 ± 4.9 n = 17
97.9 ± 7.0 150.9 ± n = 27 13.6 n = 26 94.7 ± 4.8 152.6 ± n = 17 12.6 n = 16 97.2 ± 212.0 ± 15.9 31.1 n = 29 n = 28 94.0 ± 5.7 198.0 ± n = 17 17.0 n = 16
153.1 ± 13.2 n = 23 160.4 ± 19.0 n = 16 196.3 ± 25.7 n = 29 188.9 ± 20.2 n = 16
195.9 ± 20.2 n = 24 196.3 ± 17.9 n = 16 —
201.6 ± 25.7 n = 23 203.1 ± 11.5 n = 12 —
—
307.1 ± 32.7 n = 27 334.9 ± 35.6 n = 17 —
—
313.6 ± 31.5 n = 24 335.8 ± 30.4 n = 16 —
—
—
LLR Amplitudes Rare
5.03 ±
Control 3.4 BlastExposed
4.87 ± 2.3
n = 27 5.07 ± 2.3
n = 27 3.81 ± 2.3
n = 17
3.66 ± 3.9 n = 26 2.71 ± 2.7
n = 17
3.6 n = 23 3.54 ±
2.6 n = 16
1.17 ±
3.13 ± 3.3
n = 24 2.89 ± 5.2
n = 16
1.88 ± 2.9 n = 23 2.36 ± 4.5
n = 16
11.80 ± 6.1 n = 27 8.15 ± 3.3
n = 12
9.17 ± 4.9 n = 24 8.13 ± 4.8
n = 17
n = 16
1019 GALLUN et al. Central auditory processing and blast exposure
Figure 4. Grand average waveforms for late latency responses. (a) Control subjects and (b) blast-exposed subjects. Rare and common traces for both ears are shown. LE = left ear, RE = right ear.
1020 JRRD, Volume 49, Number 7, 2012
Table 4. Mean latencies and amplitudes of each peak in long latency responses (LLRs) for rare and common stimulus presentation conditions for blastexposed and control subjects. Right- and left-ear (RE and LE, respectively) responses shown separately. Data presented as mean ± standard deviation, and number of subjects contributing to each mean is shown as n. Common Control 4.35 ± 4.48 ± 3.46 ± 3.38 ± — — — — 2.3 2.4 2.8 2.4 n = 27 n = 29 n = 28 n = 29 Blast4.35 ± 3.44 ± 2.75 ± 3.18 ± — — — — Exposed 2.1 2.4 1.5 1.9 n = 17 n = 17 n = 16 n = 16
reporting PTSD performing abnormally on at least one of the subtests compared with 22 percent (5/23) of those not reporting PTSD (2 = 13.30, df = 1, p < 0.001). While the MLD and the N0S subtest of the MLD were not significantly related to a report of PTSD, the same was not true of the N0S0 subtest, on which 38 percent of those reporting PTSD (5/13) performed abnormally, but only 4 percent (1/23) of those not reporting PTSD performed outside the normal range (2 = 6.96, df = 1, p < 0.01). Confirmation of the relationship between a report of PTSD and difficulties detecting signals in noise was revealed by the results of the QuickSIN test, on which 62 percent (8/13) of those reporting PTSD had SNR loss values in the abnormal range, as opposed to only 5 percent (1/19) of those who did not. Note that four participants did not complete the QuickSIN, none of whom reported PTSD. Effects of Individual Factors Beyond Blast Exposure: Age and Hearing Loss Although the incidence of hearing loss among people exposed to a high-explosive blast varies considerably (see Helfer et al. [31] for review), the most recent published estimate based on military medical records is about 52 percent with permanent sensorineural loss [32– 33]. In order to be eligible to participate, however, subjects in this study all had to have average PTALF thresholds at 0.5, 1.0, or 2.0, kHz of