Journal of Information Assurance and Security. ISSN 1554-1010 Volume 9 (2014) pp. 222-234 © MIR Labs, www.mirlabs.net/jias/index.html
Phishing Website Classification: A Machine Learning Approach
Oluwatobi Akanbi
Ahmad Abunadi
Department of Computer Science Texas Tech University 2500 Broadway, Lubbock, TX 79409
[email protected]
Faculty of Computing Universiti Teknologi Malaysia 81310 Skudai Johor, Malaysia
[email protected]
Anazida Zainal Faculty of Computing Universiti Teknologi Malaysia 81310 Skudai Johor, Malayisa
[email protected]
Abstract— In order to circumvent the adverse effect of fraudulent acts committed on the internet by adversaries, different researchers have proposed various solution to this problem. One of this online fraudulent act is website phishing. Website phishing is the act of luring unsuspecting online users into divulging private and confidential information which can be used by the phisher in fraud, blackmail or other ways to negatively affect the users involved. Based on our previous paper, we proposed noble features to better improve the accuracy of machine learning algorithms in classifying phish. In order to ascertain the improvement in website phish classification of machine learning algorithms based on the features extracted in our previous paper, our present approach is based on testing. This approach is divided into three phases. In phase 1, we propose a new method of classifying phish website by using pruning decision tree. In phase 2, we train and test four selected individual reference classifiers and based on their performance, an ensemble of classifier is designed. Lastly, the output of each phase is then compared to show the efficiency of our approach. The experimental result of the research shows that pruning decision tree is comparatively potent in website phish detection. Keywords-component; Phishing; Website; Machine-Learning; Online Users; Fraud; Classification.
I.
INTRODUCTION
Social engineering attacks targeting users not computers or systems are designed to obtain sensitive or confidential information from users. Most social engineering attacks are classified as phishing attacks. And there are different techniques for phishing such as phishing by email, instant messages, SMS and website. These techniques help the phisher to lure unsuspecting online users into divulging personal information such as bank account information, website login information, and other sensitive information that can be used by a third party for illegal profit, blackmailing etc.
Phishing is a form of internet scam in which an attacker makes use of an email or website to illegally obtain private information [1]. As explained in [2], the complexity of understanding and analyzing phishing website is as a result of its involvement with technical and social problems. Simply, the aim is to lure users to phishing websites that mimics a legitimate websites to ruse users in order to get their sensitive information such as passwords, credits card, e-bank account, etc. As a result, the attacker can abuse the user’s information in various ways from using it to gain illegal profit, blackmail, or even impersonate the user [3]. Although, phishing is a relatively new type of cyber security threat - the increasing sophistication of phishers in recent years have led to great harm in e-commerce services and information security [4]. According to the Anti-Phishing Working Group (2013), 49,480 unique phishing websites were detected in the first quarter of 2013 and stayed at the higher rate through the third quarter. Hence, the need to efficiently resolve the outbreak of phishing in our online environment cannot be over exaggerated considering the danger of phishing websites to unsuspecting online victims. Due to the ever increasing phishing websites springing up by the day, it has become increasingly difficult to track and block them as attackers are coming up with innovative methods every day to entice unsuspecting users into divulging their personal information [5]. Many attempts have been made using machine learning in classification of emails into spam and non-spam. Most of the work or research carried out on spam has been used as a basis for several phishing classification techniques. The success of any machine learning algorithm depends on its ability to properly classify websites which is dependent on the features used to train and test the algorithm [6]. Although, some features have been proposed and tested with machine learning algorithms over the years to enhance better classification of phishing website, however, the struggle to attain better
Phishing Website Classification: A Machine Learning Approach efficiency with respect to the ever evolving phishing techniques has make phishing a continuous research interest. This paper emphasizes the dependency of accuracy in classification techniques on potent features based on literature reviews of credible papers with good results to surveys of papers with new features. Some of these features will be selected based on their potency and then compared with the new features by weighting [7]. Furthermore, machine learning algorithms will be employed to further show the potency of the new features as compared to selected existing features. The rest of the paper is structured as follows: Section II provides the literature review of related studies and some of the classification techniques proposed by other researchers. Section III describes the dataset processing technique and the feature selection criteria. Section IV details on the proposed classification technique and selected techniques for phishing website detection; Section V provides experimental details, comparison of the results obtained from each of the techniques considered and concludes the work and directions for future work. II.
LITERATURE REVIEW
Internet as one of the most important communication medium, it is also a major medium for the widespread of different fraudulent acts committed by perpetrators towards unsuspecting online users. A lot of people make use of the internet to manage their online business or as a complementary support to their offline business. People can use the internet for various purposes such as sending emails, e-banking activities, selling or buying products weather it is a digital or concrete products. In addition, people can use the internet to engage in political issues or social activities. In spite of all of these advantages of the internet, however there are some disadvantages. One of such is internet fraud which is a kind of crime conducted online. There are many ways in which online users are been exposed to Internet fraud; this may involve the users in divulging sensitive information. This is why internet is a very good way to trick the users who use it to purchase products or services [8]. One of the most common internet frauds is website phishing where unsuspecting users are being deceived into divulging confidential information via e-form which can later be used by the phisher for financial gain. Various researches have been conducted towards reducing the impact or eradicating phishing and protecting online users from being swindled. Although, only a few of these researches have been directed towards website phishing as most were focused on email spam detection. Albeit, there are several promising approaches to investigating this problem and by extensive literature review in related fields, it was realized that most of the previous researches carried out focused on studies that can be categorized into three: understanding why people fall victims to phishing; methods of phishing awareness training; how to develop comprehensive interface for assisting users in making better decision on trusting either emails or websites [9]. In this section, we briefly discuss existing anti-phishing techniques and related studies. Practically, established anti-phishing techniques use either heuristic approach or feature-based approach [9]. While the former is perceptive, the latter is
223
complicated. The most important aspect of feature based approach is in investigating discerning features such that each feature contribute reasonably to the classification of websites into phishing or non-phishing. Although, feature-based approach have experienced a major set-back based on high false positive rate. [9] proposed CANTINA+ using 8 new features which spans through the HTML Document Object Model (DOM), search engines and third party services with machine learning techniques to correctly classify phish. CANTINA+ achieved over 92% TP on unique testing phish and 99% TP on near-duplicate testing phish. In [10], 95.50% accuracy was obtained using a phish webpage detection approach called TSVM which is based on a semi-supervised learning method. This method complements the drawback of SVM in weak training and poor representative label samples by taking into account the distribution information implicitly embodied in the large quantity of the unlabeled samples. However, [2] claimed the incorporation of domain features into a model for domain-specific phishing website detection can have a significant influence on the performance. In their work, they proposed a detection model for Chinese e-business websites by selecting the best performed algorithm from a total of four machine learning algorithm to analyze the significant of each feature and also pruning the less significant ones. The results obtained from their study demonstrated the significance of domain-specific feature on detection model performance. Furthermore, [3] identified phishing webpages through clustering process to find the relationship between webpages using selected features. Based on this study, an experimental result of 91.44% accuracy was achieved. Although some solutions used visual similarity based phishing detection approach by comparing legitimate website screen capture with that of a suspected site to attain as low as 0.1% false positive rate and about 95-99% accuracy like in [11], a solution called Contrast Context Histogram (CCH) was proposed. This solution combines the concept of visual similarity based phishing detection with the use of k-mean algorithm to do clustering to the nearest related key points. Furthermore, [12] proposed a solution based on converting website screen capture to text which is then checked using Google PageRank to detect phishing. This visual similarity based solutions are very slow to detect phishing websites especially when used as an online tool [13]. The importance of feature selection in phishing detection was further extended to ensemble classification algorithm in [14] for categorizing Online Payment and Lottery Tickets by extracting 10 selected features from HTML source code. Experimental result shows that the proposed method achieved over 98% accuracy. We used both selected known features and new features proposed in [7] for classifying phishing websites. In this study, we employ the use of selected machine learning algorithms to test this novel features as proposed in our previous paper as a future work. In order to show our contribution in this area of website phish detection, pruning decision tree is introduced as an efficient and fast phish detection algorithm.
224
Akanbi and Abunadi
III.
DATASET PROCESSING AND FEATURE EXTRACTION
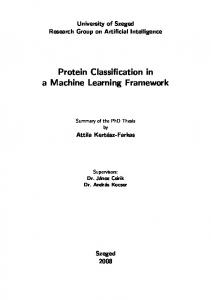
The processing of dataset was carried out in our previous paper as we are using the same dataset used in [7]. Many stages are involved in dataset processing, some of which are: feature extraction, normalization, dataset division and attribute weighting. These are very necessary in ensuring that the classifier can understand the dataset and properly classify them into the reference classes. The focus is on effective minimal features that can be utilized in detecting phishing websites. Figure 1 shows the breakdown of this sub-section. Dataset preprocessing Technique
testing process respectively. The output of this phase is directly passed on to the machine learning algorithms for training and testing. Table I shows the ratio of phishing to non-phishing as grouped for the purpose of training and testing. Table II briefly describes each feature extracted. TABLE I. RATIO OF PHISHING TO NON-PHISHING
ID
Group
Phishing
1 2 3
50:50 70:30 30:70
875 1225 525
NonPhishing 875 525 1225
Training (Rows) 1050 1050 1050
Testing (Rows) 700 700 700
TABLE II. DATASET FEATURES Column Name ID URL TITLE HTML_Source_Code
Feature Extraction
Alexa_Rank
Normalization
Dataset Division
IP_Address SSL_Connection
Figure 1. Data Processing Breakdown
Long_URL
For data preprocessing technique, the dataset for phishing website is downloaded from phishtant (OpenDNS), tested to segregate and discard the offline websites and then the features are extracted from each website using php code. For non-phishing websites, we used a webcrawler to extract the websites from google and also, extracted the features. The feature extraction process is achieved using php code in phpmyadmin webserver, haven stored the websites in a database connected to the webserver [7]. The selection of the extracted features was based on previous research works; using their individual weight as a selection factor. A combination of some of the features used in [15] and [16] is used as a baseline in feature selection. These features have proven very efficient in phish detection [17]. Furthermore, the features are then labeled from 1-10 in terms of f1, f2, f3,…,f17. The 17th feature which value is binary ranging from phishing to non-phishing is used as the classification label. This is shown in the equation (our paper): 1 𝑖𝑓 𝑡ℎ𝑒 𝑈𝑅𝐿 𝑖𝑠 𝑝ℎ𝑖𝑠ℎ𝑖𝑛𝑔
𝑓17 = { 0 𝑖𝑓 𝑡ℎ𝑒 𝑈𝑅𝐿 𝑖𝑠 𝑛𝑜𝑛−𝑝ℎ𝑖𝑠ℎ𝑖𝑛𝑔
After data-processing, both phishing and non-phishing datasets are combined into one dataset. The dataset is then divided into three groups for training and testing across varying sizes of dataset. The varying sizes used are in the ratio of 50:50, 70:30 and 30:70. After the splitting has been completed, each of this groups is then combined i.e. the phishing and non-phishing combined together. This is done to evaluate the effectiveness of using different sizes of dataset across each classifier. In addition, a cross-validation of (10, 20, 30,…, 90) is then used to split the dataset into training and
Dots At_Symbol Hexadecimal Frame Redirect Submit Googe_Page_Rank Google_Position
Label
IV.
Column Description Unique number of each row
Web address of page Title of each webpage HTML source code of webpage Value of Alexa Rank ranging from 0-millions Represented as 1 if present and -1 otherwise Represented as 1 if present and -1 otherwise Length of URL Number of dots present in URL reflecting how many sub-domains used Represented as 1 if @ symbol is embedded or -1 if absent Represented as 1 if hexadecimal codes are present and -1 if not Represented as 1 if present and -1 if not Represented as 1 if the webpage has a code to redirect user to another destination and -1 if not Represented 1if the webpage has a form to send data and -1 if not Value of Google Page Rank ranging from 0 to 10 Position of the in google search. It ranges from 0 which means non -existence to 300 hundreds Classification of each webpages into phishing (1) and nonphishing (0)
SELECTED MACHINE LEARNING ALGORITHMS
The importance of using selected machine learning algorithms is to show the strength of new features and the variation of accuracy of classification across different algorithms. The more distinct the feature from phishing is to non-phishing, the more accurate the result. Furthermore, the closeness in accuracy of the algorithms used, the more certain we are that the new features maintains a certain level of accuracy given that all other factors such as size of dataset used and trendy performance capacity of the algorithms in terms of how each algorithm perform with either an increment
225
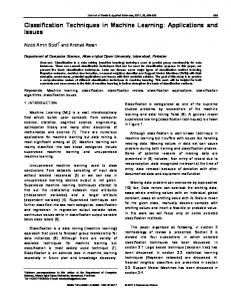
Phishing Website Classification: A Machine Learning Approach or decrement in the amount of dataset introduced during training and testing. In this paper we made use of pruning decision tree and ensemble of classifiers such as Linear Regression (LR), KNearest Neighbor (K-NN), C4.5 and Support Vector Machine (SVM). A. EVALUATION OF PRUNNING DECISION TREE Decision tree is a sort classifier which consists of a number of nodes starting from the root node. Root node does not have any upper nodes or parent nodes as often referred to in texts. Figure 2 shows a sample of decision tree that checks whether the clients will respond to a particular mail or not. The circles represent the nodes and the triangles represent the leaves.
Figure 2. Decision Tree Sample
Decision tree can include both nominal and numeric attributes like that shown in figure 2. The sample decision tree can help the analyst to predict the response of clients and also portray a clear picture about customer’s behavior [18]. One of the problems with the Decision tree algorithm is that when the need arises for using unrestricted rules, the size of the tree can grow to large extents thereby increasing the complexity and also increasing the runtime for the algorithm to complete. In addition, according to [19], the decision tree complexity has a significant effect on the accuracy of the classifier. Using unrestricted rules in Decision trees generates very large trees that are over-fitted to the training dataset. Due to this set-back in the use of decision trees, Olshen and Stone proposed in [19] a method that provides loosely stopping criteria to be used with decision tree. After the implementation of this method, the large decision tree obtained is broken down to into a smaller tree by removing branches which does not contribute to the generating the expected result. There are two important criteria to decide if pruning technique is needed or not. These criteria are size and accuracy. Size affects the computation time and accuracy affects the predictive ability of the classifier. [20] pointed out that Error–based pruning is a good choice to implement. The procedure of Error–based pruning is performed bottom-up. Also, Pessimistic Pruning is another
way of implementing pruning technique but it performs topdown technique. Both of these pruning techniques focus on accuracy which has more priority for this study. According to [21], Error-based pruning is similar to pessimistic pruning because the Error-based concludes error approximation from the data which has been used through training process by assuming that the errors are binomially distributed. In contrast, Pessimistic error pruning uses one standard rule to estimate the error while Error-based pruning uses more than one rule in order to calculate the confidence interval on a number of errors. This interval is based on the fact that the binomial distribution is very close to the normal distribution in the large sample case. But later when the training process is finished, the upper limit of the confidence interval is then used to estimate leaf error rate. Experimental results on these two pruning techniques will show the technique with the better result in terms of accuracy and complexity of the classifier using performance metrics such as precision, recall, f1-score and accuracy. B. EVALUATION OF INDIVIDUAL CLASSIFIER Evaluation of classifiers is required in this research to measure the performance achieved by a learning algorithm. To do this, a test set consisting of dataset with known labels is used. Each of the classifier is trained with a training set, and then applied to the test set, and finally, performance is measured by comparing the predicted labels with the true labels (which were not available to the training algorithm) [22]. Therefore, it is important to evaluate the classifiers by training and testing with the dataset obtained from the processing and feature extraction phase using the following performance metrics; precision, recall, f1-score and accuracy. Table III, shows the formula used to calculate the performance metrics. TABLE III. PERFORMANCE CALCULATION FORMULAR
PERFORMANCE MEASURE
Percentage % Classification
Accuracy
𝑇𝑁 + 𝑇𝑃 𝑇𝑁 + 𝑇𝑃 + 𝐹𝑁 + 𝐹𝑃
Precision
𝑇𝑃 𝑇𝑃 + 𝐹𝑃
Recall/True Positive Rate (TPR)/Detection Rate (DR) F1 Score
Error Percentage (%)
DESCRIPTION
𝑇𝑃 𝑇𝑃 + 𝐹𝑁 2.
𝑝𝑟𝑒𝑐𝑖𝑠𝑖𝑜𝑛 . 𝑟𝑒𝑐𝑎𝑙𝑙 𝑝𝑟𝑒𝑐𝑖𝑠𝑖𝑜𝑛 + 𝑟𝑒𝑐𝑎𝑙𝑙
False Positive Rate (FPR)/False Alarm Rate (FAR) False Negative Rate (FNR)
1) CLASSIFICATION BACKGROUND
𝐹𝑃 𝑇𝑁 + 𝐹𝑃 𝐹𝑁 𝐹𝑃 + 𝐹𝑁
226
Akanbi and Abunadi
In order to better understand the classification notations used in Table III, a brief explanation of the notations will be discussed in this sub-section with the aid of Table IV which shows the relationship between the actual class and the expected class.
KNN employs the use of Euclidean Distance. It is based on the premise that every instance in the dataset can be represented as a point in N-dimensional space. Also, KNN uses a value K to represent the number of instances to be used after which the majority class will be chosen to classify the new instance. The K-NN equation is:
TABLE IV. CLASSIFICATION CONTEXT
Actual Class (Observation)
Expected Class (Expectation)
TP (True Positive) Correct Result FN (False Negative) Missing Result
FP (False Positive) Unexpected Result TN (True Negative) Correct Absence of Result
Based on notations in table III, i. Let TP represent the number of legitimate website correctly classified as legitimate ii. Let TN represent the number of websites classified correctly as phishing website iii. Let FP represent the number of legitimate websites classified as phishing website iv. Let FN represent the number of websites classified as legitimate websites when they were actually phishing websites.
𝑛
𝑑(𝑥𝑖 , 𝑥𝑗 ) = √∑(𝑎𝑟 (𝑥𝑖 ) − 𝑎𝑟 (𝑥𝑗 ))2 𝑟−1
c) Support Vector Machine (SVM) SVN is basically suitable for binary classification. It is based on a principle similar to KNN in that it represents the training set as points in an N-dimensional space and then attempts to construct a hyper plane that will divide the space into particular class labels with a precise margin of error. d) Linear Regression Linear Regression attempts to use a formula to generate a real-valued attribute. This method uses discrete value for prediction by setting a threshold Ton the predicted real value. The equation used is: 𝐴
𝑐 = 𝑤0 + ∑ 𝑤𝑖 × 𝑎𝑖
𝑖=1
2) CLASSIFIER PERFORMANCE A brief introduction to each of the chosen classifiers will be described in this sub-section. a) Decision Tree C4.5 C4.5 is a decision tree algorithm used to measure the disorder in the collection of attribute and effectiveness of an attribute using entropy and information gain respectively. The operation of C4.5 on the dataset can be categorized into two equations: i. Calculating the entropy value of the data using the equation below: 𝑐
𝐸(𝑆) = ∑ −𝑝1 𝑙𝑜𝑔2 𝑝1 𝑖=1
Where E(S) – entropy of a collection of dataset, c – represents the number of classes in the system and pi – represents the number of instances proportion that belongs to class i. ii. Calculating the information gain for an attribute C, in a collection S, where E(S) is the entropy of the whole collection and SW is the set of instances with the value ‘w’ for attribute C. 𝐺(𝑆, 𝐶) = 𝐸(𝑆) −
∑ 𝑤∈𝑣𝑎𝑙𝑢𝑒𝑠 (𝐶)
b) K-Nearest Neighbour
𝑆𝑤 𝐸(𝑆𝑤 ) 𝑆
C. EVALUATION OF CLASSIFIER ENSEMBLE Classifier ensemble was proposed to improve the classification performance of a single classifier [23]. In our research, Simple majority voting is used to ensemble the classifiers in determining detection accuracy. This is an iterative phase in which a threshold (acceptable detection accuracy set) is set and checked with the evaluation results until an optimum result is achieved. The formula for calculating detection accuracy is: 𝐷𝑒𝑡𝑒𝑐𝑡𝑖𝑜𝑛 𝐴𝑐𝑐𝑢𝑟𝑎𝑐𝑦 𝑅𝑒𝑠𝑢𝑙𝑡 = (𝑎 × 𝑑1 ) + (𝑏 × 𝑑2 ) + (𝑐 × 𝑑3 ) Where a+b+c = 1 and a, b and c are variables in the range of [0,1]. The classifiers trained and tested during single classifier evaluation are used to determine the ensemble design. This process is divided into two parts, namely ensemble design and decision. In the design part, four algorithms are being considered for ensemble and a committee of three algorithms is used to form an ensemble since majority voting requires an odd number of participants. Based on the performance output from the individual classifiers, all the individual classifiers will be evaluated with the same metrics and then voted on. Therefore, the decision part rely on the output of the design part to decide which of the ensemble is the best performed.
227
Phishing Website Classification: A Machine Learning Approach
V.
EXPERIMENT AND RESULT
This section is divided into three phases: In phase 1, we describe the process of generating Decision Tree model; how the parametric values are chosen carefully through repetitive processes and then we present the pruning technique, showing the effect on performance. Phase 2, addresses the problem of selecting the best classifier amongst the selected few used in this research. This is done by training and testing the individual reference classifiers (C4.5, LR, K-NN and SVM) with the same dataset used in phase 1. Lastly, phase 3 discusses the design ensemble of the reference classifiers showing performance metric of the ensemble and the final part of this phase illustrates the comparative result of the three techniques. Therefore, phase 3 is dependent on the output of phase 2. One of the major contributing factors to overall low accuracy is the selection of weak weighted features for classification. The situation worsens when a lazy algorithm is trained and tested with a large dataset. Therefore, the performance of the ensemble design used in this study may not perform so well if the wrong classifier is trained and tested with dataset size more than the classifier’s capacity. A. PHASE 1 (PRUNING PROCESS) Figure 3 shows an overview of the implementation of decision tree and the process of pruning. Figure 4. C4.5 Pseudocode (Moreno, 2012)
Some parameters are to be selected before building and training the model. There are six parameters used to generate a Decision Tree Model and each parameter has a range of values. The values of these parameters are shown in Table V. TABLE V.
Figure 3. Implementation Process of Decision Tree (Pruning)
There are different types of Decision Tree algorithm but in this study, C4.5 is used. This Decision Tree is an improved ID3 presented by Quinlan in [24]. The difference is that C4.5 uses Gain Ration while a splitting weather ID3 uses information gain method as a criterion. Figure 4, shows the pseudocode for Decision Tree C4.5 as described in [25].
Criterion parameter refers to a splitting criterion for Decision Tree. This can be done by using various methods. A popular one of this criterion is Information Gain but it is unsuitable for our study because it has bias attribute selection with large number values [26]. Since our dataset have an attribute with large number values, information gain should not be used. In contrast, another criterion called Gain Ratio which alters the information gain of each attribute to allow a consistent scaling of the attribute values can be used. Gain ration uses the column sum of the frequency table to split information or values of the attributes [27]. Gain Ration formula is shown in the equation:
228
Akanbi and Abunadi
𝐼𝑛𝑓𝑜𝑟𝑚𝑎𝑡𝑖𝑜𝑛 𝐺𝑎𝑖𝑛 𝐺𝑎𝑖𝑛 𝑅𝑎𝑡𝑖𝑜 = 𝑆𝑝𝑙𝑖𝑡 𝐼𝑛𝑓𝑜𝑟𝑚𝑎𝑡𝑖𝑜𝑛 The next parameter is minimal size for split and it refers to the size of a node which means the number of examples in its subset i.e. the size of the root node is equal to the total number of examples in the whole dataset. As such, any node with a size greater than or equal to minimal size for split parameter will be splitted. Minimal leaf size is the size of a leaf node and it presents the number of examples in the leaf subset. In order to choose the best value for minimal size for split and minimal leaf size, a repetitive process has been applied for 10 values starting from 1 which is the minimum value and 100 which is the maximum value. The values are increased from point to point quadratically as shown in Table VI, the best 10 accuracy result with a change of minimal size for split and minimal leaf. These two parameters are affected by number of dataset rows. Therefore, a subset of the whole dataset has been used; consisting of 1750 rows as the other datasets. As a result, the values of minimal size for split equal to 5 and minimal leaf equal to 1.
The statistical correlation produces an error rate and based on the error rate value the node will be pruned. Due to the approach of this pruning technique, if the node is pruned, all the descendants’ nodes will be pruned as well [18]. In order to conduct a proper pruning process, a variable initialization is needed and this initialized variable is known as confidence. This kind of initialization specifies the confidence level used for the pessimistic error calculation. In order to choose the best value for confidence parameter, a repetitive process needs to be applied. The repetitive value of confidence parameter increases from point to point linearly. Table VII shows the best 10 result with different values for confidence parameter using the dataset consisting of 1750 rows. The best value for confidence parameter is 0.350 and this value will be used for all training and testing process. TABLE VII. REPETITIVE PROCESS RESULT OF CONFIDENCE PARAMETER
TABLE VI. REPETITIVE PROCESS RESULT
The purpose of using pruning technique with Decision tree is to avoid over fitting problem. There are two approaches to avoid over fitting, pre-pruning and post pruning. In this study, only post pruning is applied since the pre-pruning might lead to inaccuracy result. Pessimistic pruning technique is used as a post pruning in this experiment. The basic idea beyond Pessimistic pruning is using statistical correlation test instead of using a pruning set or cross validation. Furthermore, Pessimistic pruning technique starts from the top of the tree to the bottom.
Furthermore, the combined dataset (phishing and nonphishing) will be divided into three groups in order to get efficient result. As such, the experiment is applied on all three datasets contributing three different results. Also, in order to generate the decision tree, gain ratio criterion is used to weight all features. This weighting process is differs across dataset groups. Table VIII, shows the weight for each feature across the three dataset:
229
Phishing Website Classification: A Machine Learning Approach
TABLE VIII. FEATURE WEIGHT USING GAIN RAITIO ACROSS THE DATASETS
number of nodes; reducing complexity and implementation time. This is a major advantage of pruning. Because of the difference in dataset, features, classifier and even the cross-validation approach used as compared to some other approaches researched by others, it will be unfair to run a comparison without a close related baseline. As such, the comparison is done amongst study results with similar baseline. Table X shows the selected researches and thus the comparison is done. Furthermore, the comparison amongst these approaches is not done to criticize previous researches but to improve on the research background. These methods selected for comparison are divided into two parts: i. HUD (Heuristic techniques based on URL and DNS information) ii. CBM (Content-Based Machine Learning method. In addition to the two popular methods, the result will then be compared to classifier ensemble method used in the next section (Phase 2). TABLE X. COMPARISON WITH OTHER METHODS
DETECTION METHOD HUD [28] HUD [29] CBM [30] CBM [31] CBE [32] Our Result
There are slight differences in weights amongst all features in the three subsets. But ssl_connection has the highest value of 1 as compared to all the other features; therefore this node is selected as the root of the decision tree. The next node is the google_position feature, as it has the next highest weight to ssl_connection. In accordance to the weights, any node with least weight value will be subjected to being pruned. In addition, a node like that of the submit feature with a value of zero will not be consider in the decision tree. Next, we discuss about the performance evaluation of each feature based on metrics (Accuracy, precision, recall, f-measure and false positive). Table IX shows the result.
PRECISION
RECALL
61.82% 86.62% 90.25% 93.78% 98.12% 98.65%
5.30% 58.32% 68.74% 88.42% 98.73% 98.95%
From Table X, it shows that our result is comparatively better than the others in terms of precision and recall measures. B. PHASE 2 (SINGLE CLASSIFIERS) Like discussed earlier, four classifiers will be trained and tested in order to eliminate the weakest leading to the design of ensemble of classifiers. The process of training and testing is termed as generic in the course of this study. Figure 4 shows the procedure for training and testing in a generic model.
TABLE IX. OVERALL RESULT BEFORE AND AFTER PRUNING Dataset Group A Group B Group C Average
Accuracy 99.71% 98.29% 99.29% 99.12%
Dataset Group A Group B Group C Average
Accuracy 99.71% 98.29% 99.29% 99.12%
BEFORE PRUNING Precision Recall F-M 99.43% 100% 99.71% 97.25% 97.25% 97.25% 99.40% 99.60% 99.50% 98.69% 98.95% 98.82% AFTER PRUNING Precision Recall F-M 99.43% 100% 99.71% 97.25% 97.25% 97.25% 99.40% 99.60% 99.50% 98.69% 98.95% 98.82%
FP 2 6 3 3.5 FP 2 6 2 3.3
Note that F-M denotes F-measure while FP denotes Falsepositive. It is noticeable that no difference in performance before and after pruning. This is a good sign that the accuracy is same before and after; therefore the pruning does not affect the accuracy. Although, there is obvious difference in the
Figure 5. Design for training and testing generic model
In this design, the “retrieve dataset” process will retrieve the three sets of dataset one at a time and pass it over to the “training and validation” process where x-validation is used
230
Akanbi and Abunadi
and the model then applied for training. The most important component of this model is the reference classifiers used in each loop from the “performance metric” to “training and validation”. Also, the “performance metric” loop back to “retrieve dataset” after each complete iteration during the time in which the performance metrics is obtained. The iteration process continues until the three dataset have been passed through the model. Therefore, order to successfully carry out the training and testing process, some parameters are used to achieve the best result. These parameters are defined in table XI. TABLE XI. TRAINING AND TESTING PARAMETERS
Parameter
Value/Quantity
K
1
Sampling Type
Stratified Sampling
No. of Validations
10
Performance
Criteria(Accuracy, precision, recall, Fmeasure
Description Finding the K training examples that is closest to the example Builds random subsets ensuring that the class distribution in the subsets is the same as in the whole reference Size of testing set used This operator is used for statistical performance evaluation
In order to get the best results using K-NN, different number of neighbors was tested. Table XII shows the accuracy of the K-NN tested using 10 cross-validation. TABLE XII.
Figure XIII shows the confusion matrix obtained from Table XII.
Real Classes Phishin g NonPhishin g
Phishin g
NonPhishin g
Phishin g
NonPhishin g
Phishin g
NonPhishin g
99.43%
0.22%
99.43%
1.92%
98.67%
1.33%
0.55%
99.35%
0.55%
99.18%
1.28%
99.43%
Another key parameters used in training and testing process is the “sampling type”. In this implementation, Stratified sampling was chosen because the variable type of the dataset used is set to binomial. A major parameter alternated several times during the initial process is the number of validations used. Meanwhile, after using nine different validation number from 10 to 90 such that x= [10, 20, 30, ..,90] and the standard deviation of the results examined, it was concluded that because of the insignificance of the standard deviation value, any of the results can be used. Table XIV shows the accuracy of the reference classifiers showing the average and standard deviation of all the nine validation number used. The other tables containing precision recall and f-measure were truncated to avoid ambiguity. TABLE XIV. X-VALIDATION ACCURACY RESULT
K-NN
K-NN
1
2
99.03%
99.37%
99.26%
99.03%
99.08%
99.03%
99.37%
99.26%
97.88%
30
98.97%
99.03%
99.37%
99.26%
99.03%
40
98.97%
99.03%
99.37%
99.26%
99.03%
50
99.03%
99.03%
99.37%
99.26%
99.03%
60
98.98%
99.03%
99.37%
99.26%
98.80%
70
99.09%
99.03%
99.37%
99.26%
98.63%
80
98.97%
99.03%
99.43%
99.32%
99.03%
90
99.03%
99.03%
99.37%
99.25%
98.62%
AV
99.02
99.03
99.38
99.27
98.79
G
%
%
%
%
%
CV
C4.5
LR
10
99.09%
20
Looking at the accuracy of K-NN1 and K-NN2 shown in Table XIV, it is obvious to conclude that K-NN1 performs better than K-NN2 and as such K-NN1 is chosen over K-NN2 in the further implementation phase. Based on the justification discussed for number of validation, each of the reference algorithms was trained and tested across the three sets of dataset and the resulting output of this process is shown in Table XV – XVIII.
TABLE XIII. CONFUSION MATRIX RESULTED FROM K-NN K=1
K=2
K=3
SVM
TABLE XV. ACCURACY OF CLASSIFIERS
231
Phishing Website Classification: A Machine Learning Approach
Individual Technique Accuracy
shown in Table XVIII, it is obvious that K-NN f-measure is the highest at 99.55%. Hence, the best performed classifier out of all the reference classifiers is chosen as K-NN. Table XIX shows the best performed classifier.
SET
C4.5
LR
KNN
SVM
A
99.14%
99.03%
99.37%
99.03%
SET A
K-NN
B
99.31%
99.31%
99.31%
99.31%
Accuracy
99.37%
C
99.26%
99.26%
98.80%
99.26%
Precision
99.76%
Recall
99.35%
F Score
99.55%
TABLE XIX. BEST PERFORMED INDIVIDUAL CLASSIFIER
TABLE XVI. PRECISION OF CLASSIFIERS
TABLE XVII. RECALL OF CLASSIFIERS
C. PHASE 3 (ENSEMBLE AND COMPARATIVE STUDY) Experiments using varying dataset on individual classifiers was conducted in phase 2 and based on the output of this conduct; the committee of ensemble was designed. The ensemble algorithm chosen was the simple majority voting algorithm, for this reason an odd number of constituent classifiers was required. From the pool of four classifiers, all sets of classifiers of size three were chosen for ensembles. This meant that there were a total of four classifier ensembles. The components of these are summarized in Table XX. These ensembles were evaluated using the same metrics as the individual techniques. Table 5.15 – 5.17 shows the results obtained for the four ensembles
Individual Technique Recall
TABLE XX. ENSEMBLE COMPONENTS
Individual Technique Precision SET
C4.5
LR
KNN
SVM
A
99.92%
99.92%
99.76%
99.92%
B
99.88%
99.88%
99.66%
99.88%
C
98.51%
98.51%
98.66%
98.51%
SET
C4.5
LR
KNN
SVM
A
98.86%
98.69%
99.35%
98.69%
B
98.74%
98.74%
98.97%
98.74%
C
99.05%
99.05%
97.34%
99.05%
Ensemble
Alg1
Alg2
Alg3
Ensemble 1
KNN
C4.5
LR
Ensemble 2
KNN
C4.5
SVM
Ensemble 3
KNN
LR
SVM
Ensemble 4
C4.5
LR
SVM
TABLE XXI. ENSEMBLE RESULT USING SET A
TABLE XVIII. F-SCORE OF CLASSIFIERS
Individual Technique F-Score SET
C4.5
LR
KNN
SVM
A
99.38%
99.30%
99.55%
99.30%
B
99.31%
99.31%
99.31%
99.31%
C
98.76%
98.76%
97.98%
99.31%
Scrutinizing the results obtained from individual classifier performance across the varying dataset used, it was observed that K-NN perform best with SET A based on accuracy and fmeasure. Perhaps, considering both precision and recall may give a confusing interpretation to the results without considering the f-measure which is the harmonic mean of combined precision and recall. Therefore, investigating the fmeasure of individual classifiers across varying dataset as
SET A
ENS1
ENS2
ENS3
ENS4
Accuracy
99.20%
99.20%
99.03%
99.03%
Precision
99.92%
99.92%
99.92%
99.92%
Recall
98.94%
98.94%
98.69%
98.69%
F Score
99.42%
99.42%
99.30%
99.30%
TABLE XXII. ENSEMBLE RESULT USING SET B
SET B
ENS1
ENS2
ENS3
ENS4
Accuracy
99.31%
99.31%
99.31%
99.31%
Precision
99.88%
99.88%
99.88%
99.88%
Recall
98.74%
98.74%
98.74%
98.74%
F Score
99.31%
99.31%
99.31%
99.31%
TABLE XXIII. ENSEMBLE RESULT SUING SET C
232
Akanbi and Abunadi
SET C
ENS1
ENS2
ENS3
ENS4
Accuracy
99.26%
99.26%
99.26%
99.26%
Precision
98.51%
98.51%
98.51%
98.51%
Recall
99.05%
99.05%
99.05%
99.05%
F Score
98.76%
98.76%
98.76%
98.76%
Based on the result obtained from ensemble, it becomes obvious that the entire ensemble performed equally in SET B and also the results obtained are the best of the three dataset. Also, this testifies that all the ensemble perform best when the dataset is equally divided between phishing and non-phishing. Since all the ensembles have the same result when SET B dataset is used then it can be concluded that any of this ensemble can be used. Figure 6 shows the plot of the accuracy obtained from the ensembles.
D. COMPARATIVE STUDY In this sub-section, the results from the three techniques are compared. This is to justify the importance of new features when used for training and testing in machine learning algorithms. Table shows the three selected results obtained from the above implemented techniques. TABLE XXV. RESULTS
PRUNIN G DT(C4.5) 99.71%
INDIVIDUA L CLASSIFIER 99.37%
Precision
99.43%
99.76%
99.88%
Recall
100%
99.35%
98.74%
F Score
99.71%
99.55%
99.31%
PERFORMANC E METRIC Accuracy
ENSEMBL E 99.31%
From Table XXV, it can be observed that Pruning Decision Tree outperforms the other two techniques. In general, the outcome shows how effective any of the three techniques can be with respect to the features selected for this study. Figure 7 shows the graph of the performance of each technique.
Figure 6. Ensemble accuracy across varying datasets
From the graph shown in Figure 6, it can be seen that in both SET B and SET C, the accuracy of the ensembles are the same and in SET A the last two ensemble (ENS3 and ENS4) diverged in accuracy as compared to the first two ensembles (ENS1 and ENS2). This sudden drop in accuracy is due to the weak performance of LR and SVM as compared to C4.5 and K-NN. This is because both LR and SVM classify better with increased training dataset as observed across the trend of varying dataset. Meanwhile, the results obtained from ensemble using SET B shows the same value for all the ensemble and as such, any of the ensemble in SET B can be selected as the best performed ensemble. ENS1 is selected and Table XXIV shows the values obtained from this ensemble Figure 7. Comparative Performance Plot TABLE XXIV. SELECTED ENSEMBLE CLASSIFIER
SET B
ENS1
Accuracy
99.31%
Precision
99.88%
Recall
98.74%
F Score
99.31%
VI.
CONCLUSION AND FUTURE WORK
The stakes involved in combating phishing websites have been raised recently and many of the existing anti-phishing tools are using the blacklist approach which has been proven less efficient as a result of the incessant way in which phishers upload phishing websites. Nowadays, phishing websites are created using new techniques which can allow them bypass most anti-phishing tools undetected. Meanwhile, the common techniques using either/both whitelist and blacklist are less effective as compared with the current phishing trends. There are some existing tools using machine learning approach by examining each webpage content in order to detect phishing
233
Phishing Website Classification: A Machine Learning Approach websites. Furthermore, most of the existing machine learning solutions is using the same features. Some of this existing feature does not have the ability to give high classification performance since they are not common features shared between phishing and non-phishing websites. Furthermore, weighting some of the existing features has also shown that not all of them are needed especially if they have a weak contribution to classification. This kind of features can also contribute to the complexity of classification process. The aim of this study is to show the importance of viable features in website phishing classification using machine learning algorithms. Also, pruning decision tree can be used to reduce the complexity of Decision Tree algorithm in Website Phishing classification. The experimental result shows the performance trend of the classifiers across varying dataset emphasizing the strength of each classifier according to the amount of dataset introduced for training and testing. Overall, the importance of machine learning algorithms in website Phishing classification cannot be over-emphasized. In our future work, our attention will be shifted to using some of this machine learning techniques in implementing Intrusion Detection System.
REFERENCES [1]
[2]
[3]
[4]
[5]
[6]
[7]
[8]
AUTHOR BIOGRAPHIES O. A. Akanbi received his B. Sc. (Hons, Information Technology – Software Engineering) from Kuala Lumpur Metropolitan University, Malaysia in 2011, M.Sc. in Information Security from Universiti Teknologi Malaysia (UTM), in 2013. He is presently a graduate student in Computer Science at Texas Tech University (TTU), U.S.A. His area of research is in CyberSecurity. Email:
[email protected]
[9]
[10]
[11]
[12]
Ahmad Abunadi received his B.Sc. in Information Technology from Islamic University of Gaza in 2009 and M.Sc. In Information Security from Universiti Teknologi Malaysia (UTM), in 2013. He is presently a web developer at Mudah.my Sdn. Bhd., Malaysia. Email:
[email protected] Anazida Zainal is presently a senior lecturer and the academic coordinator (coursework) at the Universiti Teknologi Malaysia (UTM). She received her B.Sc. and M.Sc. in Computer Science at Rutgers University U.S.A and Ph.D. in Computer Science at UTM. Her area of research is in Computer Security, Machine Learning and Computer Network Email:
[email protected]
[13]
[14]
[15]
[16]
[17]
[18] [19]
N. A. G. Arachchilage and S. Love, "Security awareness of computer users: A phishing threat avoidance perspective," Computers in Human Behavior, 2014. 38: p. 304-312. D. Zhang, Z. Yan, H. Jiang, and T. Kim, "A domain-feature enhanced classification model for detection of Chinese phishing e-business websites," Information & Management, 2014. G. Liu, B. Qiu, and L. Wenyin. "Automatic detection of phishing target from phishing webpage." in Pattern Recognition (ICPR), 2010 20th International Conference on. 2010. IEEE. H. Zhang, G. Liu, T. W. Chow, and W. Liu, "Textual and visual content-based anti-phishing: a Bayesian approach," Neural Networks, IEEE Transactions on, 2011. 22(10): p. 1532-1546. G. Ramesh, I. Krishnamurthi, and K. Kumar, "An efficacious method for detecting phishing webpages through target domain identification," Decision Support Systems, 2014. 61: p. 12-22. P. Garrard, V. Rentoumi, B. Gesierich, B. Miller, and M. L. GornoTempini, "Machine learning approaches to diagnosis and laterality effects in semantic dementia discourse," Cortex, 2014. 55: p. 122-129. A. Abunadi, O. Akanbi and A. Zainal “Feature extraction process: A phishing detection approach.” in Intelligent Systems Design and Applications 2013. ISDA 2013. 13th International Conference. ISDA. L. A. T. Nguyen, B. L. To, H. K. Nguyen, and M. H. Nguyen. "Detecting phishing web sites: A heuristic URL-based approach." in Advanced Technologies for Communications (ATC), 2013 International Conference on. 2013. IEEE. G. Xiang, J. Hong, C. P. Rose, and L. Cranor, "Cantina+: A featurerich machine learning framework for detecting phishing web sites," ACM Transactions on Information and System Security (TISSEC), 2011. 14(2): p. 21. Y. Li, R. Xiao, J. Feng, and L. Zhao, "A semi-supervised learning approach for detection of phishing webpages," Optik-International Journal for Light and Electron Optics, 2013. 124(23): p. 6027-6033. C.-R. Huang, C.-S. Chen, and P.-C. Chung, “Contrast context histogram—An efficient discriminating local descriptor for object recog-nition and image matching,” Pattern Recognit., vol. 41, no. 10, pp. 3071–3077, Oct. 2008. M. Dunlop, S. Groat, and D. Shelly. "GoldPhish: using images for content-based phishing analysis." in Internet Monitoring and Protection (ICIMP), 2010 Fifth International Conference on. 2010. IEEE. S. Afroz and R. Greenstadt. "Phishzoo: Detecting phishing websites by looking at them." in Semantic Computing (ICSC), 2011 Fifth IEEE International Conference on. 2011. IEEE. W. Zhuang, Q. Jiang, and T. Xiong. "An intelligent Anti-phishing strategy Model for Phishing website Detection." in Distributed Computing Systems Workshops (ICDCSW), 2012 32nd International Conference on. 2012. IEEE. H. Kazemian and S. Ahmed, "Comparisons of machine learning techniques for detecting malicious webpages," Expert Systems with Applications, 2014. H. Zhang, G. Liu, T. W. Chow, and W. Liu, "Textual and visual content-based anti-phishing: a Bayesian approach," Neural Networks, IEEE Transactions on, 2011. 22(10): p. 1532-1546. H. Huang, L. Qian, and Y. Wang, "A SVM-based technique to detect phishing URLs," Information Technology Journal, 2012. 11(7): p. 921925. H. Dahan, S. Cohen, L. Rokach, and O. Maimon, Proactive Data Mining with Decision Trees. 2014: Springer. L. Olshen and C. J. Stone, "Classification and regression trees," Wadsworth International Group, 1984.
234
[20] M. priti Phalak, M. kiran Bhandari, and R. Sharma. "Analysis of Decision Tree-A Survey." in International Journal of Engineering Research and Technology. 2014. ESRSA Publications. [21] M. P. Patil, "DECISION TREES." [22] C. Elkan, "Nearest neighbor classification," University of California– San Diego, 2007. [23] A L. Dang, et al., "A novel classifier ensemble for recognition of multiple indoor air contaminants by an electronic nose," Sensors and Actuators A: Physical, 2014. 207: p. 67-74. [24] J. R. Quinlan, C4.5: programs for machine learning. Vol. 1. 1993: Morgan kaufmann. [25] H. Moreno, "Machine Learning for Student Modeling", 2012, WORCESTER POLYTECHNIC INSTITUTE.
Akanbi and Abunadi
[26] X. WANG and J. YANG, "Improvement of Information Gain Algorithm in Text Classification," Journal of Computational Information Systems, 2014. 10(14): p. 6025-6032. [27] M. Bramer, Principles of data mining. 2013: Springer. [28] J. Kang and D. Lee. "Advanced white list approach for preventing access to phishing sites." in Convergence Information Technology, 2007. International Conference on. 2007. IEEE. [29] Y.-G. Kim, et al., Method for evaluating the security risk of a website against phishing attacks, in Intelligence and Security Informatics. 2008, Springer. p. 21-31. [30] N. Sanglerdsinlapachai and A. Rungsawang. "Using domain top-page similarity feature in machine learning-based web phishing detection." in Knowledge Discovery and Data Mining, 2010. WKDD'10. Third International Conference on. 2010. IEEE.


![[PDF] A Machine-Learning Approach to Phishing ... - Google Sites](https://m.moam.info/img/260x300/pdf-a-machine-learning-approach-to-phishing-google_64778fce097c474e708bd707.jpg)