2013 10th International Conference Computer Graphics, Imaging and Visualization
Potential Perils of Biological Sequence Visualization using Sequence Logo Lee Nung Kion
Oon Yin Bee
Faculty of Cognitive Sciences & Human Development Universiti Malaysia Sarawak Kota Samarahan, Sarawak Email:
[email protected]
Faculty of Cognitive Sciences & Human Development Kota Samarahan, Sarawak Universiti Malaysia Sarawak Email:
[email protected]
tool such as CLUSTALW or MEME. Alignment columns are then trimmed on both ends to retain only the ungapped positions; (b) the aligned sequences are represented by a position-frequency-matrix (PFM) [2], which represents the likelihood of nucleotide b ∈ {A, C, G, T } occurs at position i of a sequence motif, i.e., p(b|i); (c) the sequence logo is generated from the PFM by using the information theory principle. Readers can refer to [3] for an illustrated example of how a sequence logo is generated. The idea of a sequence logo was originated from the maximum information delivery of motif information for improving accuracy on motif analysis [4]. It was argued that, a sequence logo depicts more informative and accurate nucleotide compositions in aligned binding sites in comparison with a consensus string representation. Nevertheless, as far as we know, the human factor aspects of a sequence logo have not been considered in the design. Nor there is any study that investigates human factor issues relevant to a sequence logo. A sequence logo highlights two critical pieces of nucleotides conservation information in a motif. The first is the conservation level in each multiple-alignment column of a motif which is measured in bits, with 2 bits as the maximum conservation for DNA sequences. The second is the relative frequency of the four nucleotides, i.e., A, C, G, T, which is represented by the total height of each symbol in a particular alignment position. In addition, from a sequence logo, we can identify possible minor or major grooves of the binding sequences of a TF. The perils of visualization for communicating information have been reported in many works [5]. Studies have shown that the assessment on the quality of scientific studies seems to be particularly vulnerable to confirmation bias. In other words, scientists tend to rate studies that report findings consistent with their prior beliefs more favorably than studies reporting findings inconsistent with their previous beliefs. In our previous study[6], we argued that there were severe confirmation biases when the sequence logo was used as computational tools evaluation metric. We found some claims reported in published articles were flawed because of the different heuristic rules employed for motif comparison. Furthermore, because visualized motif does not show the actual motif information, some hidden attributes about the quality of the
Abstract—Sequence motif’s characteristics are commonly visualized by using a sequence logo. This paper describes a user study aimed at evaluating the effectiveness of sequence logo as evaluation metric for motif prediction tools. We also investigate the nature of confirmation biases in using sequence logos in result reporting in publications. While sequence logos have been widely used for visualizing sequence motifs in the past 20 years, no study has reported its effectiveness and possible misuses in decision making. We conducted a paper-and-pencil test to determine the effectiveness of sequence logos in some of their common usages. A survey study was also performed to investigate sequence logos’ learnability. We found that there are great mismatches between users’ perception and actual quality of motifs when sequence logos were used as an evaluation metric. Therefore, evaluation of motif prediction tools based on sequence logos has to be interpreted cautiously. Our result also suggests that there are still room for improvements in the current sequence logo’s layout design.
I. I NTRODUCTION Information visualization is a visual representation of raw or processed data in a more appealing way so that it improves communication to human in a more cognitive friendly manner. Due to the complexity of biological data, e.g., genes, 3D structural property, motifs, and often complex relationship between them, visualization is a very useful and powerful technique to present data in a more meaningful and comprehensible way. The ultimate aim is to amplify cognitive performance in various tasks. In the motif prediction problem, bioinformaticians are interested to discover over-represented motif patterns that are recurrent in a set of biological sequences (e.g, proteins or DNA). A sequence motif is a characteristic nucleotide or amino acid sequence that is conserved in a group of sequences. In most cases, it has a biological function. In this paper, we focus our investigation on the visualization of DNA motif. DNA motifs are functional elements located in the upstream or downstream of genes they regulate during the gene expression process. The interactions between transcription factor proteins and their binding sites, i.e. proteins-DNA interaction, determine the rate and when proteins are produced. A sequence logo [1] graphically visualizes the intrinsic characteristics of motifs–the conservation of nucleotides, in DNA/RNA or proteins. A sequence logo of a sequence motif is constructed in three consecutive steps: (a) sequences are multiple aligned by using an ungapped multiple alignment 978-0-7695-5051-0/13 $26.00 © 2013 IEEE DOI 10.1109/CGIV.2013.26
106
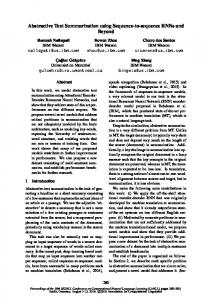
Fig. 1: Core elements of a typical DNA motif sequence logo. TABLE I: Elements in a Sequence Logo Nucleotides
Color
Height
axes
to visualize RNA/DNA logos in 3D which provides information of a motif in more dimensions. RNALogo extends sequence logos, and specifically incorporates RNA secondary structures and mutual information of base-paired regions into the graphical representation [8]. Two Sample Logo visualizes the statistical differences between two sets of sequence alignment by using sequence logos [9]. BerryLogo, on the other hand, is a motif visualization method based on the log-odd scores instead of the information content used in the sequence logo[10]. enoLogo allows visualization of logo based on the standard count matrix as well as binding energy matrix [11]. Despite many improvements made on the sequence logo in the literature, the original sequence logo design remains to be the most widely used method in publications. Table I summarizes the main elements in the layout of a typical sequence logo. Whereas Fig. 1 gives an example of a sequence logo and its core elements are labeled. Our review in [6] has identified several important usages of sequence logos in computational or wet-lab transcription analysis. The obtained sequence logos were usually compared and contrasted to some known ones to imply some qualities of computational tools or methods used. In the following we list some of the most common sequence logo usages.
The symbols A,C,G,T are corresponded to the four types of nucleotides (Adenine, Cytosine, Guanine, Thymine) that forms a DNA sequence. These symbols are shaped to become the ”bar” in the chart. Each nucleotide symbol is associated with a distinct color (users can choose to use gray scale as well). Primary colors are usually employed. There is no formal standard with the colouring scheme used. The total height of the four stacked symbols indicates the conservation level measured by using the information content concept (max 2 bits) at a particular alignment column. Each symbol height represents its relative frequency. The horizontal axis shows the actual positions relative the genes where they are located or just simply showing positions in the multiple alignment columns. The vertical axis marked the relative frequencies and conservation level of symbols.
motifs can lead to mis-interpretation. Our previous study also suggested that, current sequence logo needed improvements in the design for better support decision making and minimizing confirmation bias. In this paper, we extend our previous study by investigating two aspects of the sequence logo: (a) can it be effectively use for motif evaluation?; (b) what are some of its design features that affect users’ learnability and satisfaction? In the first question, we investigate the extent of biases and inaccuracies in using the sequence logo for decision making especially as an evaluation metric for de novo computational tools. Furthermore, we are interested to know how likely the sequence logo can cause confirmation biases in decision making. The second objective is to identify some of the sequence logo layout design elements that could affect its usability. This paper is organized as follows. Section II presents some related works and typical usages of a sequence logo in publications. Section III explains the methodology use in this study. Section IV discuss in details the results we obtained. The last section discusses and conclude our findings.
1) Computational tool evaluation. To evaluate the effectiveness of a newly proposed algorithm for solving DNA motif discovery problem, researchers employ the ability to predict known motif patterns in benchmark datasets as an indicator of a tool’s success rates (e.g. in [12]). A predicted motif is considered a true positive when its sequence logo appearance resemblances to an annotated profile. The annotated motifs can be retrieved from curated motif databases such as JASPAR[13] or those that have been published. 2) Sequence logo is also commonly used to indicate the usefulness of a wet-lab analysis methodology or protocol (e.g., ChIP-ChIP or microarray gene expression analysis). In this application, the sequence logo is used to visualize the characteristics of sequence motifs obtained (e.g., [14]). Then, they are compared to the previously discovered sequence logos. Based on that comparison, the authors can ascertain that their method works well. 3) Display motif signatures. A sequence logo allows us to investigate some distinctive characteristics of a motif. These characteristic signatures represent binding sites specificity of a TF. It also enables identification of short
II. R ELATED W ORK Several existing works have been proposed to improve the visualization of a sequence motif. [7] proposed CorreLogo
107
IV. R ESULTS
contiguous bases in binding sites that are in contact with TF during protein-DNA interaction.
Our results are summarized into two parts: 1) comparison of the effectiveness of the sequence logo tools and; 2) relationship of factors that influence user satisfaction towards sequence logo usage using Pearson-correlation.
III. M ETHODOLOGY According to the ISO 9241-11 usability framework [15], usability explains how user performance and satisfaction can be measured and the involvement of other components that will affect the whole work system. It involves in evaluating the extent of how a product or interface affects user performance in effectiveness and efficiency, besides capturing user satisfaction in the specific context of use. In our study, the first part focuses on evaluating the effectiveness of the using sequence logos to solve some tasks in relation to motif prediction. The second part involves survey questionnaire for studying usability of sequence logos. 34 final year undergraduate students (21-23 years old; 12 male, 22 female) studying at the authors’ university participated in this study. They were students from Biotechnology (20), Zoology(5), Plant (6) and Aquatic (3) major. Students were selected based on random sampling method. Since these students posses a solid foundation on molecular biology topics, this avoid the bias of having difficulties in comprehending the concepts of sequence motifs and sequence logo. Eight of the participants (23.5%) participants have some past experiences in using the sequence logo in their final year project. Prior to the first part of study, 30 minutes training session was conducted by the authors on the concept, use and reading of sequence logos. To avoid bias, we did not covered any issues related to the usages of sequence logos in publications. After the training session, participants were required to answer two set of questions, consecutively. The first set is a paper-and-pencil test which compose of tasks that require participants to use sequence logos for problem solving and decision making related to motifs predicted by de novo computational tools. A total of six tasks were prepared to be resemblance to the common usages of sequence logos discussed in Section II. Specifically, the tasks were to determine user perception on success rates, ranking and appearance of motifs predicted by various computational tools. From there, we can link the perceived and actual quality of the predicted motifs because the locations of binding sites in the DNA datasets used as input by the tools are known. The de novo computational tools we employed for motif prediction are Weeder, MotifSampler, MDSCAN and MEME. Table II summarizes all the 6 user tasks (supplementary data can be found at the correspondence author website at http://www.fcshd.unimas.my/Department-ofCS/Academicians/syafiq-lee-nung-kion.html) The second set is survey questions which asked the participants regarding user satisfaction on using the sequence logo. Our questionnaire was developed based on related theories on learnability, decision making and some interface components, for example color, layout, grouping, height and other common interface issues. Likert scale of 1-5 was used to indicate the participants options.
A. Results on Usability We report the results of our investigation on sequence logo design that influence the learnability by using Pearson Correlation. Below is a list of some of our findings: • Sequence logos provided enough information for comparison purposes (r = .43, p < 0.05). • The nucleotides alphabet shape is easy to understand (r = 0.53, p < 0.05), needed more practice to use it (r = −0.46, p < 0.05) or else it might cause the novice users to be in stress (r = −0.38, p < 0.05). • The scale for the nucleotides should be precise so that it is easier for the user to use (r = 0.31, p < 0.05) and also provide enough information for decision making (r = 0.42, p < 0.05). Our results indicated that there are significant relationships between learnability and the colour used in sequence logos. Results are shown below: • The colour used in the nucleotides affects the users’ understanding (r = 0.38, p < 0.05). It is advisable to use colour consistently across all nucleotides. However, currently there is no standard colour scheme available. • With coloured nucleotide symbols, users can compare motifs easier and the participants needed it as an important information for comparison study (r = 0.39, p < 0.05). • Grey scale sequence logos are less satisfied to the users as it is correlated with not easy to understand (r = −0.63, p < 0.05), need more practice (r = −0.36, p < 0.05) and the information is not sufficient for comparison study (r = −0.45, p < 0.05). In addition, grouping of nucleotides played an important role for learnability of the visualization. Below summarizes this finding: • There should have enough separation between different group of nucleotides to allow user easily analyze and compare motif sequence logos (r = 0.46, p < 0.05). Nucleotides in vertical stack should be closer while should have clearer distance between adjacent columns for easier motif/pattern comparison (r = 0.35, p < 0.05). These could be explained by the way human perceive grouping in law of proximity by Gestalt psychologists [16]. • The existing sequence logo visualization does not has specific boundary for the top of nucleotide alphabets, leading to confusion to the value carried by the specific nucleotides (r = −0.37, p < 0.05). • The grouping of more dominant nucleotides on the top of the vertical stack improves learnability (r = 0.44, p < 0.05).
108
TABLE II: Evaluation Tasks Description Task 1 2 3 4 5 6
Description MEME and MDSCAN were used for prediction of binding site locations. MDSCAN has higher F-measure than MEME. Participants were asked to determine each tool accuracy comparing to the annotated motif. This task ask participants on the ”successful” prediction of de novo tools. Weeder and MotifSampler were used to predict motifs in the DNA dataset. The F-measure for Weeder is 0.667, whereas for MotifSampler is 0.276. The predicted motifs were compared to the annotated ones in JASPAR. This task requires the participants to determine the ”resemblance” level between the predicted and the annotated motifs based using sequence logo. Weeder and MotifSampler results as in Task 2 were used in this task and one perturbed motif is used. Two motifs were prepared using randomly selected 10 and 20, respectively, from the original 43 binding sites. The objective is to determine the extent of biases of the on . Participants were required to rank the motifs according their score value and compare to the annotated ones. Statement is provided to state higher score should correspond to better motifs. A perturbed false motif is also included. In this task, participants were required to rank the predicted motifs using four different tools AlignACE (0.815), SOMBRERO (0.815), MEME (0.84) and Weeder (0.481).
TABLE III: Frequency table for Task 3 for combined agree and strongly agree.
B. Results on Effectiveness Our paper-and-test results indicate consistently that sequence logos are unable to be objectively used as the evaluation metric for computational motif prediction tools. In all the tasks, majority of the participants were unable to perform the provided tasks correctly. It is intriguing and surprising to discover the great extent of the inaccuracies of using sequence logo on several of the tasks. We will explain these claims by going through the results from the tasks. In Task 2, most participants responded that MotifSampler is more successful (t = −6.11, p < 0.01) in predicting the MEF motif in comparison to Weeder (21 vs 9 combined agree and strongly agree and means 2.6176 vs 3.7353). But in actual fact, Weeder obtained much better prediction. This result is expected because the motif predicted by MotifSampler appears more similar to the annotated one and participants were led into believing that corresponds to a better motif. Figure 2 illustrates this point. On the other hand, in Task 3 we test the reliability of using the level of resemblance between a predicted and annotated motif to infer a motif quality. We found that the level-ofresemblance is a weak indicator of a motif actual quality. Participants chose MotifSampler and the perturbed motif to be more resemblance to the annotated motif despite the fact that Weeder gave the best prediction. Table III summarizes the participants’ answer selection. Our result is alarming because the use of the level-of-resemblance between motif logos to establish a motif quality might be just a random guess. The information represented by a sequence logo is not sufficient or suitable to be used for determining a motif quality through comparisons. In addition, a comparison result also depends on annotated motifs use in an analysis. These results have supported our claim in [6] that the level-ofresemblance between motif logos cannot be used objectively for evaluating computational tools. Therefore, empirical results reported in publications obtained by using sequence logos alone as evaluation metric could be misleading and have to be taken cautiously. Computational predicted motifs are often associated with
Weeder 4
MotifSampler 24
Perturbed 17
some score values for ranking, filtering, or selection. Two examples are Maximum a posteriori [17] and information content [18] scores. In addition, p- or e-value can be computed as an indication of a score value confidence level. In Task 5, we investigated the influence of score values associated with sequence logo on users’ decision making. Interestingly, we found the score values affect participants perception toward the success prediction of a tool greatly. About 79.4% (27/34 for combined agree and strongly agree) of the participants agreed they used scores in their decision making. Similar percentage of the participants also believed motifs with better scores were (told in the question to simulate what generally believed in an article) better quality motif. The participants’ answers indicated that the score values associated with sequence logos caused biases in tool evaluation. Our result found most participants responded in favor of tools having better score values. However, when the same set of logos, without scores, was used in Task 3, a quite different results were obtained. Specifically, in Task 5 the tool with the highest score was given the lowest in terms of successful motif prediction in Task 3 by majority of the participants. We found no statistical significant correlation between the tools’ results obtained in Task 3 and 5. Therefore, the displayed scores do affect users’ perception significantly. We can conclude that when score values are present with sequence logos, they become a more dominant indicator of tools’ performance compare to the level of resemblance. In Task 6, we investigated the ranking of four de novo tools without scores. Figure 3 shows the statistic of participants’ answers. Surprisingly, we found that sequence logo cannot be suitably used for ranking tools’ performance. Careful analysis reveals that the tools’ predictive performance did not corresponded to participants’ ranking (spearman correlation,
109
(a) Weeder
(b) Motif Sampler
(c) Annotated MEF Motif
Fig. 2: Sequence logos used in Task 2
Fig. 3: The figure shows the motif sequence logos predicted by different de novo tools (b) AlignACE, (c) MEME, (d) Weeder, (e) SOMBRERO. Sequence logo (a) is the annotated motif. The bar chart shows the tools’ ranking distribution by the participants. The number after the tool name is its actual ranking. TABLE IV: Means ranking for tools in Task 6
ρ = 0.40, p > 0.05). Table IV gives the means ranking of each tool. The best motif in terms of the F-measure, predicted by MEME, was ranked least resemblance to the annotated sequence logo by most of the participants. Whereas Weeder, which is the worst performed tool, ranked to be much better than its actual ranking by most of the participants. It is to be noted that motif predicted by Weeder has the highest recall but the lowest precision rate, which could explain why participants’ selected it to be more similar to the annotated motif. The weak correlation between actual and users’ perceived motifs’ ranking makes us rethink how uncertain some of the claims are in published articles when sequence logo was used as the evaluation metric. In Task 6 as well, on asking how participants make their judgment on motifs ranking, majority of them were comparing on a position-by-position basis using the conservation level and the most dominant nucleotide symbols in establishing
AlignACE 3 2.85
Sombrero 2 1.88
MEME 1 3.15
Weeder 4 2.12
motif similarity. This indicates that the participants were not utilizing the less frequent symbols in visual comparison. This user’s behaviour is not in line with one of the design goals of the sequence logo. Furthermore, the position by position comparison method cannot be used when a tool predicted a partial true motif pattern, which will be difficult to establish its resemblance to the annotated ones. All these issues contributed to the inaccuracies of using sequence logos for tool evaluation purposes.
110
sequence logos for evaluation tasks. These are reserved as our future work.
V. P OTENTIAL I MPROVEMENTS A. Difficulty in judgment of nucleotides height This problem is referring to the lack of specific boundary or line dividing stacked symbols in each position of a sequence logo. Hence, it is hard for users to determine their height from the scale. This may affect users’ judgment and then lead to confirmation bias especially when picking the measurement value.
ACKNOWLEDGMENT This work is partially supported by the Universiti Malaysia Sarawak Short Grant Scheme UNIMAS/TNC(PI)03(S101)/849/2012(05). Thank to Hao Wu for proof read some parts of this article. R EFERENCES
B. Standardization of color schemes
[1] T. D. Schneider and R. M. Stephens, “Sequence logos: a new way to display consensus sequences.” Nucleic Acids Research, vol. 18, no. 20, pp. 6097–6100, 1990. [2] G. D. Stormo, “Dna binding sites:representation and discovery,” Bioinformatics, vol. 1, pp. 16–23, 2000. [3] W. W. Wasserman and A. Sandelin, “Applied bioinformatics for the identification of regulatory elements,” Nature Reviews Genetics, vol. 5, no. 4, pp. 276–287, 2004. [4] T. D. Schneider, “Consensus sequence zen,” Applied Bioinformatics, vol. 1, no. 3, pp. 111–119, 2002. [5] S. Bresciani and M. J. Eppler, “The risks of visualization: A classification of disadvantages associated with graphic representations of information,” Institute for Corporate Communicatin, Faculty of Communication Sciences, University of Lugano (USI), ICA Working Paper No 1/2008, 2008. [6] N. K. Lee and Y. B. Oon, “Decision making biases in using sequence logo visualization,” in Southeast Asian Network of Ergonomics Societies (SEANES), Langkawi, July 2012. [7] E. Bindewald, T. D. Schneider, and B. A. Shapiro, “Correlogo: an online server for 3d sequence logos of rna and dna alignments.” Nucleic Acids Research, vol. 34, no. Web Server issue, pp. W405–W411, 2006. [8] T.-H. Chang, J.-T. Horng, and H.-D. Huang, “Rnalogo: a new approach to display structural rna alignment.” Nucleic Acids Research, vol. 36, no. Web Server issue, pp. W91–W96, 2008. [9] V. Vacic, L. M. Iakoucheva, and P. Radivojac, “Two sample logo: a graphical representation of the differences between two sets of sequence alignments.” Bioinformatics, vol. 22, no. 12, pp. 1536–1537, 2006. [10] C. Berry, S. Hannenhalli, J. Leipzig, and F. D. Bushman, “Selection of target sites for mobile dna integration in the human genome.” PLoS Computational Biology, vol. 2, no. 11, p. e157, 2006. [11] C. T. Workman, Y. Yin, D. L. Corcoran, T. Ideker, G. D. Stormo, and P. V. Benos, “enologos: a versatile web tool for energy normalized sequence logos.” Nucleic Acids Res, vol. 33, no. Web Server issue, pp. W389–W392, 2005. [12] L. Ettwiller, B. Paten, M. Ramialison, E. Birney, and J. Wittbrodt, “Trawler:de novo regulatory motif discovery pipeline for chromatin immunoprecipitation,” Nature Biotechnology, vol. 4, no. 7, pp. 563–565, 2007. [13] A. Sandelin, W. Alkema, P. Engstrom, W. W. Wasserman, and B. Lenhard, “Jaspar: an open-access database for eukaryotic transcription factor binding profiles,” Nucleic Acids Research, vol. 32, no. Suppl 1, pp. D91–94, 2004. [14] J. S. Carroll, C. A. Meyer, J. Song, W. Li, T. R. Geistlinger, J. Eeckhoute, A. S. Brodsky, E. K. Keeton, K. C. Fertuck, G. F. Hall, Q. Wang, S. Bekiranov, V. Sementchenko, E. A. Fox, P. A. Silver, T. R. Gingeras, X. S. Liu, and M. Brown, “Genome-wide analysis of estrogen receptor binding sites,” Nature Genetics, vol. 38, no. 11, pp. 1289–1297, 2006. [15] ISO 9241-11:1998 Ergonomic requirements for office work with visual display terminals (VDTs)-pART 11: Guidance to Usability, 1998. [16] G. Humphrey, “The psychology of the gestalt,” Journal of Education Psychology, vol. 15, no. 7, pp. 401–412, 1924. [17] X. S. Liu, D. L. Brutlag, and J. S. Liu, “An algorithm for finding proteindna binding sites with applications to chromatin-immunoprecipitation microarray experiments,” Nature Biotechnology, vol. 20, no. 8, pp. 835– 839, 2002. [18] G. D. Stormo, “DNA binding sites: representation and discovery,” Bioinformatics, vol. 16, no. 1, pp. 16–23, 2000.
In the current sequence logo, different colors have been employed on the nucleotide symbols in the visualization. However, there are no standard colors for the them and users can choose whatever color they desired. Therefore, it will cause confusion and difficulty when comparing sequence logos. C. Lack of interactivity In motif analysis, users are required to perform various tasks to enrich result presentation. Current sequences logos generation tools are unable to support interactive analysis such as zooming, positioning, or support quantitative analysis. In addition, they are unable to support multiple sequence logos view to ease the comparison of two or more sequence logos side-by-side or top-down. More options should be made available in the visualization tool so that users can perform tasks more accurately and conveniently. Since different users have different needs, an interactive tool will be needed to support their distinct needs. VI. C ONCLUSIONS This study investigated the learnability and effectiveness of using sequence logos for motif analysis. Our results show that there are severe inaccuracies in using sequence logos as an evaluation metric for computational tools. Despite some useful properties of a sequence logo for visual comparison, it is not effective for comparing the performances of motif prediction tools. This is because a visualized motif does not show the quantitative information that is needed for accurate comparison between motifs. In addition, the sequence logo is designed for comparing motif characteristics and is not suitable to be used to evaluate predictive ability of computational tools. Comparisons of tools based solely on sequence logos may as well correspond to random guesses. For example, in one of our tasks, a random motif was perceived by most of the participants to be highly similar to the annotated motif. In addition, heuristic rules employed by different published works to compare and contrast sequence logos can be various and therefore potentially biased in favor of ones own work. Retrospectively, claims made on tools’ effectiveness derived only from sequence logos have to be interpreted with care especially when they are not supplemented with objective evaluation method. Our survey results indicate that there are some elements in the sequence logo design that can be improved. Such improvements can reduce the bias and accuracy of using
111