providing a summarized view of the input traffic. 1 Introduction. Network monitoring applications that must extract a large number of real-time metrics from many ...
Predicting Resource Usage of Arbitrary Network Traffic Queries Pere Barlet-Ros? , Gianluca Iannaccone† , Josep Sanju`as-Cuxart? , Diego Amores-L´opez? , Josep Sol´e-Pareta? ?
Universitat Polit`ecnica de Catalunya Barcelona, Spain
Abstract
†
Intel Research Cambridge, UK
application demands and the number of end-hosts in the network. The processing requirements are growing to satisfy the demands for fine grained and continuous analysis, tracking and inspection of network traffic. This challenge is made even harder as network operators expect the queries to return accurate enough results in the presence of anomalous traffic patterns when the system is under additional stress (and the query results are most valuable!).
Monitoring and mining real-time network data streams is crucial for managing and operating data networks. The information that network operators desire to extract from the network traffic is of different size, granularity and accuracy depending on the measurement task (e.g., relevant data for capacity planning and intrusion detection are very different). To satisfy these different demands, a new class of monitoring systems is emerging to handle multiple arbitrary and continuous traffic queries. Such systems must cope with the effects of overload situations due to the large volumes, high data rates and bursty nature of the network traffic – the alternative of provisioning them to handle peak rates is prohibitively expensive. In this paper, we present the design and evaluation of a system that can accurately predict the resource usage needs of network traffic queries, even in the presence of extreme and highly variable traffic conditions. The novelty of our system is that it is able to operate without any explicit knowledge of the traffic queries. Instead, it extracts a set of features from the traffic streams to build a prediction model of the query resource requirements with deterministic (and small) worst case computational cost. We present experimental evidence of the performance and robustness of our prediction methodology using real traffic traces and injecting synthetic traffic anomalies. Our results show that the system predicts the resources required to run each traffic query with small errors in all the various traffic scenarios. This prediction can later be used for load shedding purposes in order to allow current network monitoring systems to quicky react to overload situations by sampling the incoming packet streams or providing a summarized view of the input traffic.
Recently, several research proposals have addressed this challenge [17, 20, 21, 6, 12]. The solutions introduced belong to two broad categories. The first includes solutions that consider a pre-defined set of metrics and can report approximate results (within given accuracy bounds) in the case of overload [17, 12]. The second category includes solutions that define a declarative query language with a small set of operators for which the resource usage is assumed to be known [20, 21, 6]. In the presence of overload, operatorspecific load shedding techniques are implemented (e.g., selectively discarding some records, computing approximate summaries) so that the accuracy of the entire query is preserved within certain bounds. These solutions present two common limitations: (i) they restrict the types of metrics that can be extracted from the traffic streams limiting therefore the possible applications and uses of those systems, and (ii) they assume explicit knowledge of the cost and selectivity of each operator, requiring a very careful and time-consuming design and implementation phase for each of them.
1 Introduction
In this paper, we present a system that supports multiple arbitrary and continuous traffic queries on the input streams. The system can predict overload situations due to anomalous, extreme or highly variable traffic mixes. The core of our methodology consists in the real-time modeling and prediction of the system resource usage, which allows the monitoring system to anticipate future bursts in the resource requirements. The novelty of our approach is that it does not require any explicit knowledge of the query or of the types of computations it performs (e.g., flow classification, maintaining aggregate counters, string search). Thus, any load shedding scheme based on our prediction methodology would
Network monitoring applications that must extract a large number of real-time metrics from many input streams are becoming increasingly common. These include for example applications that correlate network data from multiple sources (e.g., end-systems, access points, switches) to identify anomalous behaviors, aid in traffic engineering, capacity planning or managing and troubleshooting the network. The main challenge in these systems is to keep up with ever increasing input data rates and processing requirements. Data rates are driven by the increase in network link speeds, 1
preserve the flexibility of the monitoring system and would allow fast implementation and deployment of new network data mining applications. Since we have no knowledge of the computations performed on the packet streams, we need to infer those from the relation between a large set of pre-defined “features” of the input stream and the actual resource usage. A feature is a counter that describes a specific property of a sequence of packets (e.g., number of unique source IP addresses). The features we compute on the input stream have the advantage of being lightweight with a deterministic worst case computational cost. Then, we automatically identify those features that best model the resource usage of each query and use them to predict the overall load of the system. If the prediction exceeds a threshold, we could then implement several load shedding techniques, such as packet sampling, flow sampling or computing summaries of the data streams to reduce the amount of resources required by the query to run. For simplicity, in this paper we focus only on one resource: the CPU cycles. However, we believe that our approach can be also applied to other system resources as well (e.g., memory, disk space, disk bandwidth). We have integrated our prediction mechanism into the CoMo monitoring system [14] and we evaluated it using packet traces collected on an research ISP network and running a set of seven concurrent queries on the packet streams that range from maintaining simple counters (e.g., number of packets, application breakdown) to more complex data structures (e.g., per-flow classification, ranking of most popular destinations or string search). In addition, we introduced several anomalies into the packet traces to emulate different network attacks to other systems in the network as well as targeted against the monitoring system itself. The remainder of this paper is structured as follows. The next section presents in greater detail some related work. Section 3 introduces the monitoring system we use for our study and the set of queries that will be used throughout the paper. We describe our prediction method in detail in Section 4 and validate its performance using real traffic traces in Section 5. Section 6 compares our approach to other approaches based on time series analysis and presents experimental results showing how the system can handle anomalous traffic patterns and the overhead introduced by the prediction. Finally, Section 7 concludes the paper and introduces several ideas for future work.
of Netflow) and periodically reports to a central collection server. In order to handle the large volumes of data exported and to reduce the load on the router it resorts to packet sampling. The sampling rate must be defined at configuration time, and to handle unexpected traffic scenarios network operators tend to set it to a low “safe” value (e.g., 1/100 or 1/1000 packets). Adaptive NetFlow [12] allows routers to dynamically tune the sampling rate to the memory consumption in order to maximize the accuracy given a specific incoming traffic mix. Keys et al. [17] extend the approach used in NetFlow by extracting and exporting a set of 12 traffic summaries that allow the system to answer a fixed number of common questions asked by network operators. They deal with extreme traffic conditions using adaptive sampling and memory-efficient counting algorithms. Our work differs from this approach in that we are not limited to a small set of known traffic summaries but instead we can handle arbitrary network data mining applications. Our method does not require any explicit knowledge of what information the application is trying to extract from the traffic streams. Several research proposals in the stream database literature are also very relevant to our work. The Aurora system [4] can process a large number of concurrent queries that are built out of a small set of operators. In Aurora, load shedding is achieved by inserting additional drop operators in the data flow of each query [21]. In order to find the proper location to insert the drop operators, [21] assumes explicit knowledge of the cost and selectivity of each operator in the data flow. Additional extensions have proposed mechanisms to have the drop operator discard the “right” records from the stream [9, 16]. In [5, 20], the authors propose a system that applies approximate query processing techniques, instead of dropping records, to provide approximate and delaybounded answers in presence of overload. Again, our work differs from these approaches in that we have no explicit knowledge on the query and therefore we cannot make any assumption on its cost or selectivity to know when it is the right time to drop records. Our system is based on extracting features from the traffic streams with deterministic worst case time bounds. Several solutions have been proposed in the literature to this end. For example, counting the number of distinct items in a stream has been addressed in the past in [13, 1]. In this work we implemented the multi-resolution bitmap algorithms for counting flows proposed in [13]. Finally, the overall design issues involved in building network monitoring systems that allow declarative queries as well as arbitrary traffic queries are addressed in [8, 14].
2 Related Work The design of mechanisms to handle overload situations is a classical problem in any real-time system design and several previous works have proposed solutions to the problem. In the network monitoring space, NetFlow [7] is considered the state-of-the-art. It is a widely deployed, general purpose solution supported in most of today’s routers. It extracts pre-defined per-flow information (depending on the version
3 System Overview In this section we describe the goals and challenges involved in the design of a prediction mechanism for arbitrary network data mining applications. We also introduce the monitoring platform and the set of queries we use throughout the paper 2
6
CPU cycles
x 10 4 2 0
0
10
20
30
40
50
60
70
80
90
100
0 5 x 10
10
20
30
40
50
60
70
80
90
100
0
10
20
30
40
50
60
70
80
90
100
0
10
20
30
40
50 Time (s)
60
70
80
90
100
Packets
3000 2000 1000 0
Figure 2: System overview
Bytes
15 10 5 0
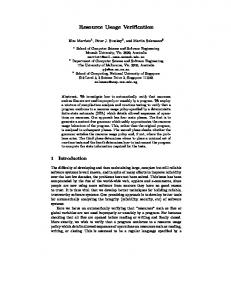
of flows increases despite the volume of packets and bytes remains fairly stable. Based on this observation, we designed a method that automatically selects the most relevant feature(s) from a small sequence of packets and uses them to accurately predict the CPU usage of arbitrary queries. This fine-grained and shortterm prediction could then be used to quickly react to overload situations by sampling the input streams or by providing a summarized view of the traffic data.
5−tuple flows
3000 2000 1000 0
Figure 1: CPU usage compared to the number of packets, bytes and flows
for evaluating our method. Our thesis is that the cost of maintaining the data structures needed to execute a query can be modeled by looking at a set of traffic features that characterizes the input data. The intuition behind this thesis is that each query incurs a different overhead when performing basic operations on the state it maintains while processing the input packet stream such as, for example, creating new entries, updating existing ones or looking for a valid match. We argue that the time spent by a query is often dominated by the overhead of some of these operations and therefore can be modeled by considering the right set of simple traffic features. A traffic feature is a counter that describes a property of a sequence of packets. For example, potential features could be the number of packets or bytes in the sequence, the number of unique source IP addresses, etc. In this paper we will select a large set of simple features that have the same underlying property: deterministic worst case computational complexity. Later we will describe how a large set of features can be efficiently extracted from the traffic stream (Section 4.1). Once we extract a large number of features from the traffic stream, the challenge is in identifying the right ones that can be used to accurately model and predict the query’s CPU usage. Figure 1 illustrates a very simple example. The figure shows the time series of the CPU cycles consumed by an “unknown” query (top graph) when running over a 100s snapshot of our data set (described in Section 3.3), where we inserted an artificially generated anomaly. The three bottom plots show three possible features over time: the number of packets, bytes and flows (defined by the classical 5-tuple: source and destination addresses, source and destination port numbers and protocol number). It is clear from the figure that the bottom plot would give us the most useful information to predict the CPU usage over time for this query. It is also easy to infer that the query is performing some sort of perflow classification, hence the higher cost when the number
3.1 Monitoring platform We chose the CoMo platform [14] for developing and evaluating our resource usage prediction method. The platform allows users to define traffic queries as plug-in modules written in C language. The user is required to specify a simple stateless filter to be applied on the incoming packet stream (it could be all the packets) and also the granularity of the measurements, hereafter called measurement interval (i.e., the time interval that will be used to report continuous query results). Then all complex stateful computations are contained within the plug-in module code. In order to provide the user with the maximum flexibility when specifying queries, CoMo does not restrict the type of computations that a plug-in module can perform. As a consequence, the platform does not have any explicit knowledge of the data structures used by the plug-in modules or the cost of maintaining them. Therefore, our load shedding mechanism must operate only with external observations of the CPU, memory and bandwidth requirements of the modules – and these are not known in advance but only after a packet has been processed. Figure 2 shows the components and the data flow in the system. The prediction subsystem (in gray) intercepts the packets from the filter before they are sent to the plug-in module implementing the traffic query. To implement the prediction we also instrumented the core platform to export some performance metrics. In this paper we focus only on the CPU cycles consumed by the query. The system operates in four phases that are executed online. First, it groups each 100ms of traffic in a “batch” of packets1 . Each batch is then processed to extract a large pre1 The choice to use batches of 100ms is somewhat arbitrary. Our goal is not to delay excessively the query results but at the same time use a time interval large enough to observe a meaningful number of packets. Indeed an interval too small would add a significant amount of noise in the system
3
Name application flows high-watermark link-count popular destinations string search trace
Description Port-based application classification Per-flow counters High watermark of link utilization Traffic load Per-flow counters for the 10 most popular destination IPs Identifies a sequence of bytes in the payload Full-payload collection
Data structures Array of counters Hash table Aggregated counters Aggregated counters Hash table, sorted lists Linked list Linked list
Dominant resource CPU CPU, memory CPU CPU CPU, memory CPU, disk bandwidth Disk bandwidth
Table 1: Queries used in the experimental evaluation Trace name Start Time Duration File size Packets Bytes w/o payloads Wed Nov 02, 2005 16:30 30 min. 8.29 GB 103.7 M 81.1 GB with payloads Tue Apr 11, 2006 08:00 30 min. 30.87 GB 49.4 M 29.9 GB Abilene Thu Aug 14, 2002 09:00 120 min. 34.08 GB 532.4 M 370.6 GB CENIC Thu Mar 17, 2005 15:50 30 min. 3.82 GB 59.5 M 56.04 GB
Avg load 360.46 Mbps 133.04 Mbps 411.90 Mbps 249.62 Mbps
Max load Min load 483.28 Mbps 197.32 Mbps 212.22 Mbps 96.15 Mbps 623.78 Mbps 286.22 Mbps 936.86 Mbps 79.05 Mbps
Table 2: Traces used in the experiments defined set of traffic features (Section 4.1). The feature selection subsystem is in charge of selecting the most relevant features for prediction purposes according to the recent history of the query’s CPU usage (Section 4.3). This subset of relevant features is then given as input to the multiple linear regression subsystem to predict the CPU cycles required by the query to process the entire batch (Section 4.2). If the prediction exceeds the current allocation of cycles, a load shedding subsystem could pre-process the batch to discard (e.g., via packet or flow sampling) a portion of the packets. Finally, the actual CPU usage is computed and fed back to the prediction subsystem to close the loop (Section 4.4).
3.2
rithm [3] where the cost is linear with the number of bytes processed. Finally flows and popular destinations perform a flow classification and maintain a large number of per-flow counters for all the flows (in a way similar to NetFlow) or just the ones that exchanged the largest number of bytes, respectively. The cost in this last two queries depend on the number of flows in the packet stream but also on the details of the data structures used for the classification. We believe that the set of queries we have chosen form a representative set of typical uses of a real-time network monitoring system and present different CPU usage profiles for the same input traffic. In the next sections we will show that our approach is general enough to handle efficiently all these different cases in normal and extreme traffic scenarios.
Queries
Despite the fact that the actual metric computed by the query is not relevant for our work – our system does not make any assumptions about it – we are interested in considering a wide range of queries when performing the evaluation. We have selected a set of queries that are part of the standard distribution of CoMo2 . Table 1 provides a brief summary of the queries. Three queries (link-count, application and highwatermark) maintain simple arrays of counters depending on the timestamps of the packets (and port numbers for application). The cost of running these queries is therefore driven by the number of packets. The trace query stores the full payload of all packets that match a stateless filter rule and therefore the cost depends on the number of bytes to be stored. The query string search stores all packets that contain a given string. It uses the Boyer-Moore algo-
3.3 Datasets Our testbed equipment consists of a PC with an Endace DAG 4.3GE card [11] equipped with 2 network interfaces. Through a pair of optic splitters, the card receives a copy of the traffic of a full-duplex 1 Gbps link that connects the Catalan academic network (also known as the Scientific Ring) with its Spanish counterpart (RedIris). For our testing purposes we collected two 30-minute traces from one of the link directions, in November 2005 and April 2006. In the first trace, we only collected the packet headers, while in the second one the full packet payloads were acquired. In order to study our method in other environments, we extend our dataset with two anonymized packet header traces collected by the PMA project of NLANR [18], in August 2002 and March 2005. The first one (Abilene) consists of a OC48c Packet-over-SONET unidirectional trace collected at the Indianapolis router node of the Abilene backbone (eastbound towards Cleveland). The second trace (CENIC) consists of the first 30 minutes of the data set collected on the 10
and increase the prediction error. Our results indicate that 100ms represents a good trade-off between accuracy and delay. However, this is clearly a function of the input traffic traces we used. We leave the investigation on the proper batch duration for future work. 2 The actual source code of each query is available at http://como.intel-research.net.
4
1 2 3 4 5 6 7 8 9 10
Gigabit CENIC HPR backbone link between Sunnyvale and Los Angeles. Details of the traces are presented in Table 2.
4
Prediction Methodology
In this section we describe in detail the three phases that our system executes to perform the prediction (i.e., feature extraction, feature selection and multiple linear regression) and how the resource usage is monitored. The only information we require from the continuous query is the measurement interval of the results. Avoiding the use of additional information increases the range of applications where this approach can be used and also reduces the likelihood of compromising the system by providing incorrect information about a query.
4.1
src-ip dst-ip protocol
Table 3: Traffic aggregates greater detail in Section 5. This large set of features (four counters per traffic aggregate plus the total packet and byte counts, i.e., 42 in our experiments) helps narrowing down which basic operations performed by the queries dominate their processing costs (e.g., creating new entries, updating existing ones or looking up for entries). For example, the new items are relevant to predict the CPU requirements of those queries that spend most time creating entries in the data structures. The repeated items feature may be most relevant to queries where the cost of updating the data structures is much higher than the cost of creating them. In order to extract the features with the minimum overhead, we use the multi-resolution bitmap algorithms proposed in [13]. The advantage of the multi-resolution bitmaps is that they bound the number of memory accesses per packet when compared to classical hash tables and they can handle a large number of items with good accuracy and smaller memory footprint than linear counting [22] or bloom filters [2]. We use two bitmaps for each aggregation level: one that keeps the per-batch unique count and the other that maintains the new count per measurement interval. The bitmap used to estimate the unique items must be updated per packet. Instead, the one used to estimate the new items can be simply updated per batch by just doing a bitwise OR with the bitmap used to mantain the unique count, because exactly the same bits will be set in the two bitmaps. The only difference between them is when they are reset to 0. As mentioned earlier, it is straightforward to derive the number of repeated and batch-repeated items from the counts of new and unique items respectively keeping just two additional counters. We dimension the multi-resolution bitmaps to obtain counting errors around 1% given the link speeds in our testbed.
Feature Extraction
We are interested in finding a set of traffic features that are simple and inexpensive to compute, while helpful to characterize the CPU usage of a wide range of queries. A feature that is too specific may allow to predict a given query with great accuracy, but could even cost as much as directly answering the query (e.g., counting the packets that contain a given pattern in order to predict the cost of signature-based IDS-like queries). Our goal is therefore to find features that may not explain in detail the entire cost of a query, but can still provide enough information about the aspects that dominate the processing cost. For instance, in the previous example of a signature-based IDS query, the cost of matching a string will mainly depend on the number of collected bytes. In addition to the number of packets and bytes, we maintain four counters per traffic aggregate that are updated every time a batch is received. A traffic aggregate considers one or more of the IP header fields: source and destination IP addresses, source and destination port numbers and protocol number. For example, we may aggregate packets based on the source IP address and source port number, where each aggregate (or “item”) is made of all packets that share the same source IP address and source port number pair. The four counters we monitor per aggregate are: (i) the number of unique items in a batch; (ii) the number of new items compared to all items seen in a measurement interval; (iii) the number of repeated items in a batch (i.e., items in the batch minus unique) and (iv) the number of repeated items compared to all items in a measurement interval (i.e., items in the batch minus new). Table 3 shows the combinations of the five header fields considered in this work. Although we do not evaluate other choices here, we note that other features may be useful (e.g., source IP prefixes or other combinations of the 5 header fields). Adding new traffic features (e.g., payload-related features) as well as considering other combinations of the existing ones constitutes an important part of our future work. However, we will address the trade-off between the number of features and the overhead of running the prediction in
4.2 Multiple Linear Regression Regression analysis is a widely applied technique to study the relationship between a response variable Y and one or more predictor variables X1 , X2 , . . . , Xp . The linear regression model assumes that the response variable Y is a linear function of the p Xi predictor variables3 . The fact that this 3 It is possible that the CPU usage of other queries may exhibit a nonlinear relationship with the traffic features. A solution in that case may
5
6
6
x 10
2.5
2.6
CPU cycles
2.4
x 10
actual SLR MLR
CPU cycles
2.8
2
2.2
1.5
1
1.5
2
2.5
2
3 3.5 Time (s)
4
4.5
5
0.2 SLR MLR
new_5tuple_hashes < 500 500