Prediction of maize hybrid performance using similarity in state and similarity by descent information D.V. Ferreira1, R.G. Von Pinho2, M. Balestre1 and R.L. Oliveira1 Departamento de Biologia, Universidade Federal de Lavras, Lavras, MG, Brasil Departamento de Agricultura, Universidade Federal de Lavras, Lavras, MG, Brasil
1 2
Corresponding author: M. Balestre E-mail:
[email protected] Genet. Mol. Res. 9 (4): 2381-2394 (2010) Received August 23, 2010 Accepted September 17, 2010 Published December 14, 2010 DOI 10.4238/vol9-4gmr955
ABSTRACT. We evaluated the efficiency of the best linear unbiased predictor (BLUP) and the influence of the use of similarity in state (SIS) and similarity by descent (SBD) in the prediction of untested maize hybrids. Nine inbred lines of maize were crossed using a randomized complete diallel method. These materials were genotyped with 48 microsatellite markers (SSR) associated with the QTL regions for grain yield. Estimates of four coefficients of SIS and four coefficients of SBD were used to construct the additive genetic and dominance matrices, which were later used in combination with the BLUP for predicting genotypic values and specific combining ability (SCA) in unanalyzed hybrids under simulated unbalance. The values of correlations between the genotypic values predicted and the means observed, depending on the degree of unbalance, ranged from 0.48 to 0.99 for SIS and 0.40 to 0.99 using information from SBD. The results obtained for the SCA ranged from 0.26 to 0.98 using the SIS and 0.001 to 0.990 using the SBD information. It was also observed that the predictions using SBD showed less biased than SIS predictions demonstrating that the predictions obtained by these coefficients (SBD) were closer to the observed value, but were less efficient in the ranking of genotypes. Genetics and Molecular Research 9 (4): 2381-2394 (2010)
©FUNPEC-RP www.funpecrp.com.br
D.V. Ferreira et al.
2382
Although the SIS showed a bias due to overestimation of relatedness, this type of coefficient may be used where low values are detected in the SBD in the group of parents because of its greater efficiency in ranking the candidates hybrids. Key words: BLUP; Maize breeding; Untested hybrids; Mixed models
INTRODUCTION In maize breeding programs, selection and evaluation of the best genotypes are extremely important for obtaining hybrids that are increasingly more productive and adapted to different growing conditions. Some tools can help breeders to direct the crosses in order to obtain the best hybrid combinations. Many studies have concentrated on estimating the performance of hybrids by determining the heterotic groups of inbred lines, in order to direct the crosses based on genetic distances (Reif et al., 2003a; Amorim et al., 2006). According to the theory of quantitative genetics, pairs that are more divergent could maximize heterosis and produce the best hybrid combinations (Melchinger, 1999). In this context, the use of molecular markers, in the determination of heterotic groups and in the prediction of maize hybrid performance, has been proposed by various authors (Reif et al., 2003b; Amorim et al., 2006). However, so far, the results are still inconsistent (Dias et al., 2004; Balestre et al., 2009). An alternative to the use of information obtained by molecular markers would be the use of this information through the methodology of linear mixed models for prediction of unrealized crosses (Bernardo, 1994; Charcosset et al., 1998; Schrag et al., 2009, Balestre et al., 2010). To do this, it becomes necessary to know the genealogy or the relatedness between the individuals evaluated and individuals in which their performance needs to be predicted (Bernardo, 1994). But the breeder does not always have such information, which could limit the use of this technique. In order to circumvent this limitation, some authors suggest the use of molecular marker information (allelic similarity in state, SIS) as an option when no genealogical data are available (Bernardo, 1994, 1995; André, 1999; Balestre et al., 2008b). According to NejatiJavaremi et al. (1997), the use of SIS has the advantage of using all the allelic similarity existing between the individuals tested. Bernardo (1993) proposes the use of a coefficient of coancestry, which uses information from genetic similarity, in order to correct possible biases of the SIS. However, this methodology is only valid for partial diallel crosses in which no endogamic crosses occur, i.e., when prior information is possessed about the heterotic groups. As an alternative to this restriction, some authors (Queller and Goodnight, 1989; Ritland, 1996; Lynch and Ritland, 1999; Wang, 2002) have suggested procedures for joint estimation of similarity by descent (SBD) using molecular markers, which can be used in full and partial diallels. These estimators, even using molecular data, consider the conditional probability that two individuals possess alleles inherited from common genitors, so that only individuals who meet this premise participate in the prediction of unanalyzed hybrids. Thus, those individuals that possess a relatedness of zero will not contribute in the prediction, leading to more consistent results. Genetics and Molecular Research 9 (4): 2381-2394 (2010)
©FUNPEC-RP www.funpecrp.com.br
Prediction of maize hybrid performance
2383
Therefore, the objective of this study was to evaluate the efficiency of the best linear unbiased predictor (BLUP) with the use of information of SIS and relatedness between genitors in order to obtain estimates of prediction of untested maize hybrids.
MATERIAL AND METHODS Description of materials Nine inbred lines (Table 1) were used from the maize breeding program of the company Geneseeds Genetic Resources Ltd. Table 1. Characterization of the nine inbred lines of maize. Line Background L30 L31 L32 L37 L63 L12 L43 L57 L84
POP GNS 10 POP GNS 10 POP GNS 30 POP GNS 10 POP GNS 20 POP GNS 50 POP GNS 70 POP USA 80 POP GNS 60
Maturity
Cateto/(Tuxpeno/Caribean) Cateto/(Tuxpeno/Caribean) Eto/Cateto Cateto/(Tuxpeno/Caribean) Tuxpeno Nicarilho/Autopionn Tuxpeno Tuxpeno B73/Tuxpeno Tuxpeno/Autoembrapa
Grain color
L A1 M A1 L A2 M A3 E A1 L A3 L A2 E A3 E A2
Maturity: E = early; M = medium; L = late. Grain color: A1 = yellow; A2 = orange; A3 = red. Geneseeds Genetic Resources Ltd., Lavras, MG, 2010.
To carry out the microsatellite marker analysis (simple sequence repeat), samples of approximately 20 seeds of each strain were germinated in a seedbed in a greenhouse. After emergence of the seedlings, when they presented the second pair of leaves, leaf tissue was collected for DNA extraction. Extraction of DNA, preparation of reactions and estimates of genetic similarity followed the procedures previously described by Balestre et al. (2008a). Subsequently, all progeny were genotyped using 48 microsatellite markers (Table 2), and all these markers linked to quantitative trait loci for components of grain yield. Table 2. Description of the primers used for microsatellite marker analysis. Primers Primers Primers Primers Primers Primers UMC 1025 UMC 1040 UMC 1042 UMC 1066 UMC 1112 UMC 1426 UMC 1528 UMC 1532
UMC 1550 UMC 1576 UMC 1614 UMC 1630 UMC 1653 UMC 1659 UMC 1737 UMC 1738
UMC 1762 UMC 1792 UMC 1812 UMC 1827 BNLG 0197 BNLG 0238 BNLG 0252 BNLG 0657
BNLG 1017 BNLG 1055 BNLG 1057 BNLG 1082 BNLG 1108 BNLG 1194 BNLG 1208 BNLG 1272
BNLG 1360 BNLG 1521 BNLG 1526 BNLG 1583 BNLG 1600 BNLG 1662 BNLG 1700 BNLG 1721
BNLG 1805 BNLG 1810 BNLG 1863 BNLG 1890 BNLG 2057 BNLG 2235 BNLG 2248 BNLG 2305
All work in obtaining the microsatellite marker information was carried out at the Laboratory of Molecular Biology, Department of Biology (LBM/DBI), Federal University of Lavras. With the microsatellite marker information, a matrix of binary values (“0” and “1”) was constructed to compare the different similarity coefficients (Table 3). The binary values were converted into allelic frequencies using the NTSYS-PC 2.1 Program (Rohlf, 2000). The SBD coefficients were determined with input from the MARK Program (Ritland, 2006). Genetics and Molecular Research 9 (4): 2381-2394 (2010)
©FUNPEC-RP www.funpecrp.com.br
2384
D.V. Ferreira et al.
Table 3. Coefficients of similarity in state (SIS) and similarity by descent (SBD) used for analysis of genetic data obtained with microsatellite markers. Coefficients
Models
SIS Sorense-Dice (SD) Jaccard (J) Simple matching (SM) Modified Rogers’ distance (MRD) SPD Lynch & Ritland (LR) Queller & Goodnight (QG) Ritland (R) Wang (W) (1) a = 1 and 1; b = 1 and 0; c = 0 and 1; d = 0 and 0; (2)n = number of loci; xki and xkj = frequency of the k-th allele of inbred lines i and j; is the estimator of additive genetic relatedness between the individual X (taken as reference) with alleles a and b and the individual Y with alleles c and d at locus k; S ab = equal to 1 if a and b are identical and equal to 0 otherwise; S ac = equal to 1 if a and c are identical and equal to 0 otherwise; S ad = equal to 1 if a and d are identical and equal to 0 otherwise; S bc = equal to 1 if b and c are identical and equal to 0 otherwise; S bd = equal to 1 if b and d are identical and equal to 0 otherwise; pa and pb are the allelic frequencies of the alleles a and b throughout the inbred lines for a given locus k; S’xy = 1.0 (x = ii; y = ii) or (x = ij; y = ij); S’xy = 0.75 (x = ii; y = ij); S’xy = 0.5 (x = ij; y = ik) and S’xy = 0.0 (x = ij; y = kl); Jo is the expected homozygosity obtained by , n being the number of loci.
Experimental design and correction of the means via mixed linear models The nine inbred lines were crossed in an unbalanced diallel design. Twenty-nine single-cross hybrids were obtained. These hybrids, along with the hybrids used as controls (P30F35, DKB 390 and DOW 2B587) were evaluated at two locations in Lavras/MG (Campus of the Federal University of Lavras and Vitorinha Farm) in the 2008/2009 season. The experimental design used was alpha-lattice 8 x 4 with three repetitions. Each plot consisted of two rows of 4.0 m in length, with spacing of 0.80 m between rows. The planting was carried out in mid-November 2008 and the harvest in mid-April 2009. At sowing, 450 kg/ha of the formulation of 08-28-16 (N, P2O5 and K2O) and 300 kg/ ha of the formulation of 30-00-20 (N, P2O5 and K2O) were used in coverage. The other agricultural treatments were those commonly recommended for the cultivation of maize in the region. The adjusted means of the hybrids for each site were corrected taking into account the recovery of interblock information.
Diallelic analysis by mixed linear models Based on the adjusted phenotypic means of the hybrids at each site, the joint diallelic analysis was conducted using the IV method proposed by Griffing (1956). Analyses were perGenetics and Molecular Research 9 (4): 2381-2394 (2010)
©FUNPEC-RP www.funpecrp.com.br
Prediction of maize hybrid performance
2385
formed using the SAS® System, IML Module Software (SAS Institute, 2000). Estimates of fixed effects and BLUPs for general combining ability (GCA) and specific combining ability (SCA) were obtained in a manner similar to that proposed by Bernardo (1995), for partial diallels. The linear model considered was the following: y = Xβ + Z1g + Z2s + e
(Equation 1)
where y is the vector of the adjusted means of the hybrid combinations; β is the vector of fixed effects (general and local mean); g is the vector of effects of GCA of the inbred lines; s is the vector of SCA of the hybrids; e is the vector of errors and X, Z1 and Z2 are the incidence matrices of the effects β, g and s, respectively. The joint solution for fixed and random effects was obtained by the following system of equations, conforming to Henderson (1984):
(Equation 2)
with
and
,
where: A1 is the additive genetic similarity matrix among inbred lines; A2 is the dominance matrix among strains. Variance components were estimated using the method of restricted maximum likelihood using the expectation-maximization algorithm. The additive genetic similarity matrices were constructed according to the SIS and SBD coefficients (Table 4). Dominance matrices (A2) were constructed as suggested by Henderson (1984) and Van Vleck (1993).
Prediction of unanalyzed hybrids The predicted genotypic values and the SCA of the unanalyzed crosses were made based on simulated losses or cross-validation. Thus, of a total of 29 analyzed hybrids, five situations were simulated considering random unbalancing of 3, 6, 9, 12, and 15 hybrids. For each situation, the process was repeated 2000 times. The model used was similar to that presented by Bernardo (1994). Considering that is the vector of the means of the analyzed hybrids corrected for fixed effects (β), it has: (Equation 3) in which: Z is the incidence matrix of the effects of the analyzed hybrids. Genetics and Molecular Research 9 (4): 2381-2394 (2010)
©FUNPEC-RP www.funpecrp.com.br
D.V. Ferreira et al.
2386
The yields of the unanalyzed hybrids were predicted by the following expression: (Equation 4) in which is the vector of the performance of the hybrids with simulated loss; C is the matrix of genetic covariance between the crosses with simulated loss and the analyzed crosses, V is the matrix of phenotypic covariance between the analyzed crosses. Similarly, the SCA values of the crosses with loss simulated were predicted using the following expression: (Equation 5) in which dnt is the vector of the SCA of the crosses with simulated loss; C is the matrix of genetic covariance between the crosses with simulated loss and the analyzed crosses; V is the matrix of genetic variance and covariance between the analyzed crosses; is the vector of the SCA of the analyzed hybrids.
Comparison of the predictions obtained by the similarity in state and relatedness coefficients To predict hybrids with simulated loss, information of SIS and relatedness was used. To compare the predictions, from the genetic similarity determined by the different coefficients, the Pearson correlation was used between the observed values of SCA and the phenotypic means with the values predicted for the untested hybrids. The sum of prediction error (PRES) (Allen, 1974) was also used, through the following expression: (Equation 6) where yi is the observed value (effect of SCA or of crossing) of the i-th hybrid untested, n is the number of parameters to be predicted and is the i-th prediction of yi. This expression measures the sum of the prediction error relative to its observed value. The efficiency of BLUP for predicting the values of SCA and the genotypic values was assessed by the magnitude of the correlation values. The selection efficiency of Hamblin and Zimmermann (1986) was also applied, comparing the nine highest predicted values of SCA and genotypic values, with the nine highest values of SCA and yield observed. Means of all genotypic values of the untested hybrids were considered, in all combinations and conditions of unbalance presented.
RESULTS The set of evaluated genotypes showed mean values of similarity in state of 0.251, 0.153, 0.646, and 0.636, for the Sorensen-Dice (SD), Jaccard (J), modified Roger’s distance (MRD), Genetics and Molecular Research 9 (4): 2381-2394 (2010)
©FUNPEC-RP www.funpecrp.com.br
Prediction of maize hybrid performance
2387
and simple matching (SM) coefficients, respectively. Concerning the mean value of relatedness, values 0.005, 0.006, 0.186, and 0.001 were observed, corresponding to the relatedness of Lynch and Ritland (LR), Queller and Goodnight (QG), Ritland (R), and Wang (W), respectively. Mean values related to grain yields of the 29 simple hybrids obtained from crosses between the nine inbred lines are found in Table 4. As mentioned in the Material and Methods section, of the 36 hybrids that could possibly be obtained in the diallel, 29 were obtained and evaluated. In this case, it is observed that the phenotypic mean was 8.780 ton/ha, of which the cross with best performance was L32XL43 with a yield of 11.547 ton/ha. Table 4. Values related to grain yield obtained at two locations (the Campus of the Federal University of Lavras and Vitorinha Farm, Lavras, Minas Gerais; Safra 2008/2009). Rank
Crosses
1 2 3 4 5 6 7 8 9 10 11 12 13 14 15
L32XL43 11.547 16 L63XL84 10.348 17 L32XL57 10.249 18 L32XL84 10.017 19 L12XL32 9.798 20 L37XL43 9.359 21 L37XL84 9.283 22 L30XL32 9.276 23 L43XL63 9.134 24 L32XL37 9.114 25 L30XL57 9.113 26 L30XL37 9.041 27 L31XL43 9.039 28 L37XL57 9.004 29 L57XL63 8.984 General mean
Grain yield
Rank
Crosses
Grain yield
L30XL43 8.861 L43XL84 8.857 L30XL84 8.824 L12XL37 8.718 L12XL30 8.475 L31XL57 8.355 L12XL63 8.311 L31XL84 8.283 L31XL32 8.259 L43XL57 8.106 L43XL84 7.618 L30XL31 7.487 L12XL43 5.902 L12XL84 5.273 8.780
Mean values of correlation between the means predicted and observed over 2000 simulations obtained at different levels of unbalance (3, 6, 9, 12, and 15 hybrids removed) using the coefficients of SIS (SD, J, MRD, and SM) are found in Table 5. It was observed that the correlations were of moderate magnitude, when considering the mean values of distribution, ranging from 0.439 to 0.494 (SD), 0.449 to 0.505 (J), 0.442 to 0.503 (MRD), and 0.434 to 0.472 (SM). When the median of the distribution is considered, the correlation values also showed moderate magnitude, ranging from 0.468 to 0.694, 0.468 to 0.728, 0.466 to 0.722, and 0.463 to 0.667, depending on the level of unbalance, for those coefficients, respectively. Furthermore, it was observed that the standard deviation of the correlations decreased as the mean number of predictor hybrids also decreased, i.e., the standard deviation of the correlations was lower when the level of unbalance was greater. However, it is noteworthy that when there is high asymmetry of the probability distribution or sampling (Figures 1 and 2), the mean and median may not reflect a good measure of position as the most plausible values are not close to these estimators, i.e., the mean and median do not reflect the values of maximum probability when a high degree of skewness occurs in the distribution due to the presence of outliers. According to Dalenius (1965) the mode is applied in some situations, such as the measure of position in asymmetric distributions, in order to express the most probable value of a probability distribution, especially when the goal of inference is related to the prediction of future values. Likewise, Bickel (2002, 2003) says that the mode is more robust than the mean and the median in cases of asymmetric probability distributions. Genetics and Molecular Research 9 (4): 2381-2394 (2010)
©FUNPEC-RP www.funpecrp.com.br
2388
D.V. Ferreira et al.
Table 5. Parameters related to the correlation values obtained from 2000 simulations at different levels of unbalance, related to grain yield and specific combining ability (SCA) of simple unanalyzed hybrids and their observed values. Coefficients
NHR
SCA
Grain yield
Mean Median Mode Mean Median Mode
Sorensen-Dice
3 0.291 0.563 0.980 0.457 0.694 0.990 6 0.373 0.441 0.650 0.494 0.556 0.700 9 0.388 0.431 0.540 0.479 0.512 0.620 12 0.374 0.412 0.490 0.462 0.492 0.560 15 0.343 0.374 0.440 0.439 0.468 0.480
Jaccard
3 0.370 0.628 0.980 0.495 0.728 0.990 6 0.433 0.515 0.660 0.505 0.569 0.650 9 0.447 0.478 0.640 0.492 0.525 0.580 12 0.401 0.432 0.490 0.478 0.501 0.570 15 0.369 0.384 0.520 0.449 0.468 0.500
Modified Rogers’ distance
3 0.112 0.231 0.980 0.493 0.722 0.990 6 0.155 0.208 0.260 0.503 0.551 0.650 9 0.183 0.227 0.380 0.486 0.514 0.570 12 0.178 0.223 0.290 0.471 0.492 0.550 15 0.164 0.191 0.270 0.442 0.466 0.520
Simple matching
3 0.145 0.343 0.970 0.434 0.667 0.990 6 0.171 0.235 0.450 0.472 0.533 0.620 9 0.196 0.253 0.350 0.471 0.516 0.560 12 0.217 0.271 0.370 0.453 0.479 0.500 15 0.206 0.239 0.330 0.435 0.463 0.540
Lynch and Ritland
3 0.365 0.585 0.990 0.455 0.692 0.990 6 0.269 0.266 0.270 0.483 0.522 0.540 9 0.185 0.157 0.065 0.454 0.476 0.510 12 0.141 0.098 0.024 0.414 0.429 0.450 15 0.105 0.075 0.002 0.358 0.371 0.410
Queller and Goodnight
3 0.399 0.655 0.980 0.461 0.708 0.980 6 0.307 0.316 0.160 0.479 0.529 0.590 9 0.243 0.237 0.096 0.456 0.482 0.520 12 0.194 0.173 0.037 0.415 0.434 0.460 15 0.151 0.125 0.009 0.366 0.381 0.400
Ritland
3 0.401 0.645 0.980 0.445 0.674 0.990 6 0.384 0.421 0.430 0.448 0.499 0.550 9 0.331 0.338 0.320 0.434 0.464 0.460 12 0.276 0.287 0.280 0.409 0.433 0.490 15 0.215 0.221 0.200 0.373 0.391 0.450
Wang
3 0.348 0.528 0.980 0.445 0.682 0.980 6 0.216 0.203 0.110 0.475 0.525 0.570 9 0.156 0.126 0.048 0.465 0.481 0.510 12 0.107 0.073 0.012 0.427 0.444 0.430 15 0.084 0.046 0.001 0.375 0.388 0.410
NHR = number of hybrids removed.
In this sense, in order to obtain the more probable correlation values during the process of cross-validation we obtained the densities of the samples and thus determined the mode of the distribution of correlation values. Taking into account the mode of the distribution, the values of most probable correlations ranged from 0.480 to 0.990, 0.500 to 0.990, 0.520 to 0.990, and 0.500 to 0.990 depending on the levels of unbalance, for the coefficients of SD, J, MRD, and SM, respectively. This allows the inference that, with 10% unbalance, i.e., when three hybrids are removed, it is possible to predict the performance with high accuracy. With levels of unbalance of 20% or above this value, i.e., 6, 9, 12, and 15 hybrids removed, the values of correlations showed moderate magnitude. Genetics and Molecular Research 9 (4): 2381-2394 (2010)
©FUNPEC-RP www.funpecrp.com.br
Prediction of maize hybrid performance
2389
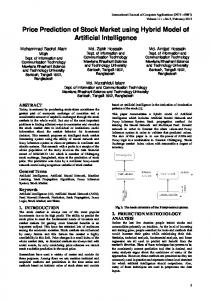
Figure 1. Frequency distribution of correlations between predicted and observed values, considering an unbalance of three hybrids. Sorensen-Dice similarity coefficient (mean = 0.49; median = 0.69; mode = 0.99, and standard deviation = 0.58).
Figure 2. Frequency distribution of correlations between predicted and observed values, considering an unbalance of three hybrids. Lynch and Ritland (1999) relatedness coefficient (mean = 0.46; median = 0.69; mode = 0.99, and standard deviation = 0.58).
In Table 5, the correlation values between predicted and observed means obtained in 2000 simulations are shown, considering the same levels of unbalance (3, 6, 9, 12, and 15 hybrids removed) relating to grain yield, using the coefficients of relatedness or SBD (LR, QG, R, and W). In this case, as well as in the SIS, the use of the correlation values referring to the mode was preferred for the same reason described above. Thus, the correlations between the predicted and observed values ranged from moderate to high magnitude, i.e., from 0.410 to 0.990 (LR), from 0.400 to 0.980 (QG), from 0.450 to 0.990 (R), and from 0.410 to 0.980 (W) according to the different levels of unbalance. The standard deviation was higher when the level of unbalance was lower. Importantly, considering the grain yield, it was observed that the values of correlation between predicted means and observed means using SIS showed slight superiority to the predictions using SBD. This situation was more pronounced when analyzing the correlations with levels of unbalance of 6, 9, 12, and 15 hybrids. Genetics and Molecular Research 9 (4): 2381-2394 (2010)
©FUNPEC-RP www.funpecrp.com.br
D.V. Ferreira et al.
2390
The correlation values between the SCA of the untested hybrids and their observed values are shown in Table 5. Similar to the grain yield situation, it can be observed that as the unbalance increases the correlation values tend to decrease for all coefficients analyzed. Similarly, it was observed that the SIS + BLUP (BLUP-SIS) method showed correlation values of a greater magnitude than the correlation values corresponding to the SBD + BLUP (BLUP-SBD) method. This fact was more pronounced when analyzing levels of unbalance with six hybrids removed. One probable explanation for these results can be associated with low relatedness values found among inbred lines making it difficult to predict when the levels of unbalance are higher. For example, considering the similarity by decent coefficient of LR, this determined relatedness only between the inbred lines L31 and L37 (0.147), L43 and L57 (0.002), and L12 and L84 (0.033). A similar situation was observed for the coefficient of QG and more so for the coefficient of W where relatedness was only detected between the parents L31 and L37, the cross of which was not possible to obtain in the field. However, it is possible to infer that even with low values of relatedness detected, the coefficients of SBD allowed the prediction, with moderate accuracy, of the performance of the untested hybrids (Table 5). Furthermore, it can be inferred that these coefficients (SBD) showed good consistency between the relatedness of the genotypes, whereas among the hybrids that showed some relatedness between the inbred lines, they did not show good performance in terms of grain yield compared to hybrids whose inbred lines showed no relatedness. For example, there are hybrids L12XL84, L12XL43, L43XL57, and L12XL30 in the performances of which were below the overall mean (data not shown). Even considering the method BLUP-SBD, for the predictive values regarding the SCA (Table 5), the accuracy of this method was lower when compared with BLUP-SIS, especially when the level of unbalance was increased. Even so, the highest value of SCA observed (L32XL43) was found among the nine highest predicted SCA values for the coefficients of QG and R (data not shown). Likewise, the second highest value of SCA observed (L63XL84) was found to be present among the nine highest predicted SCA values using the LR coefficient. Considering the predicted SCA values, it is noteworthy that the coefficient of SBD proposed by Wang (2002) failed to predict the SCAs. This occurred because of the low values of relatedness detected by the estimator. It may be noted that the observed phenotypic values corresponding to the nine largest predicted values obtained over the simulations, for the most part, were of high magnitude, with an increase over the general mean of 0.878 ton/ha for the BLUP-SIS method and a mean of 0.628 ton/ha for the BLUP-SBD method (Table 6). The selection efficiency by applying Hamblin and Zimmermann’s (1986) expression, considering the nine major phenotypic values observed, was 65% for the BLUP-SIS method, 53% for the BLUP-SBD method using the coefficient R and 42% for the other SBD coefficients (LR, QG, W). Another important finding is that the hybrid with the highest observed phenotypic mean (L32XL43) is present among the nine highest means predicted by all SBD and SIS coefficients. Furthermore, it was found that the four highest observed phenotypic means were also present among the nine largest predicted values when using the BLUP-SIS method. This fact illustrates a situation where, if such hybrids were not evaluated, but had their means predicted, they would probably be good candidates for future crossings due to the high genotypic mean value predicted by BLUP-SIS. Genetics and Molecular Research 9 (4): 2381-2394 (2010)
©FUNPEC-RP www.funpecrp.com.br
Prediction of maize hybrid performance
2391
Table 6. Parameters related to the ranking of the largest predicted genotypic values and predicted specific combining ability (SCA), obtained from over 10,000 simulations (2000 with five different levels of unbalance). Coefficients
Grain yield
SCA
Mean1 Mean2 PRES SE
Mean1 Mean2 PRES SE
SD J MRD SM LR QG R W
0.511 0.394 0.618 53% 0.284 0.366 0.542 53% 0.422 0.223 0.681 42% 0.353 0.208 0.757 42% 0.055 0.292 0.533 53% 0.062 0.377 0.532 53% 0.215 0.379 0.555 53% - - - -
12.726 9.658 3.379 65% 12.296 9.658 3.323 65% 13.164 9.658 3.239 65% 12.044 9.658 3.302 65% 12.060 9.395 3.102 42% 12.081 9.395 3.138 42% 11.966 9.446 3.244 54% 12.168 9.394 3.156 42%
Mean of the predicted values corresponding to nine selected hybrids over 10,000 simulations. 2Mean of the observed phenotypic values corresponding to nine selected hybrids. PRES = sum of prediction error; SE = selection efficiency based on nine highest phenotypic values and nine highest predicted values. For coefficient abbreviations, see Table 3. 1
It was also noted that when using the BLUP-SBD, the three hybrids with the highest observed phenotypic means were also present among the nine selected hybrid means, which were predicted over 2000 simulations. Thus, even with little relatedness information between the inbred lines, it was possible to predict performance of untested hybrids with moderate efficiency. This demonstrates the effectiveness of the BLUP in predicting the performance of untested maize hybrids through the use of SIS and SBD information. Considering the PRES values for grain yield, it can be inferred that the BLUP-SBD method showed a slight superiority (Table 6) compared to the BLUP-SIS method. This fact becomes more evident when analyzing the sum of the prediction error values of the SCAs showing that the SBD provided estimates of predictions less biased than SIS predictions (Table 6).
DISCUSSION Using the BLUP in the prediction of unanalyzed hybrids has been recommended by many authors (Bernardo, 1994, 1995, 1996a; Charcosset et al., 1998; Schrag et al., 2009, Balestre et al., 2010). In this context, the use of molecular marker information is an alternative when the pedigrees of the parents are unavailable, contributing to the obtaining of more accurate predictive estimates of the genotypic values of untested hybrids. In this study, the results obtained using SIS and SBD allowed estimates of correlation, of moderate magnitude, for grain yield, and SCA for untested maize hybrids. This allows the inference that the BLUP associated with molecular markers (BLUP-SIS and BLUP-SBD) had moderate predictive ability for performance of untested hybrids, confirming the results obtained by Bernardo (1996a,b) that found moderate correlation values in prediction studies of untested maize hybrids, for the grain yield characteristic, ranging from 0.43 to 0.76. By analyzing the results, it can be inferred that the SIS presented superior ranking ability in relation to the SBD with respect to the prediction values over different unbalanced degrees and 2000 simulations. This is evident when the correlation values between the predicted genotypic values and the observed grain yield values are compared. Similar differences were observed to the SCA parameter. Therefore, it was observed that the coefficient proposed by Jaccard showed greater accuracy on different levels of unbalance (Table 5). This coefficient does not consider the common Genetics and Molecular Research 9 (4): 2381-2394 (2010)
©FUNPEC-RP www.funpecrp.com.br
D.V. Ferreira et al.
2392
absence of bands (Table 3) in the construction of the binary data matrix, contributing to more accurate predictions than coefficients that consider this information, such as the SM coefficient (Table 3). According to some authors (Reif et al., 2005), in studies with dominant and codominant markers, the use of coefficients that consider the common absence of bands might be biased. These authors argue that this common absence does not necessarily mean that the regions of DNA are identical, which could lead to more biased estimates of similarity between genitors. Moreover, it was observed that the SD coefficient may overestimate the SIS, because it gives greater weight to the common occurrence of bands between the genitors (Table 3) compared to the J coefficient, which may have influenced the small disadvantage of the SD coefficient over the J coefficient in the predictions and ranking of the hybrids (Tables 5 and 6). Conversely, in studies of phylogeny, the use of the SD coefficient has presented good results, being superior to the other coefficients (Balestre et al., 2008a). In situations where the aim is the prediction of untested hybrids, the use of the SD coefficient, due to giving greater weight to the SIS, can result in obtaining less precise estimates of prediction compared with the J coefficient. The low values of relatedness detected between the genitors may have been one of the main reasons for the inferior accuracy of the SBD in relation to the SIS. Under this condition, little information is retrieved from the levels of the additive effects of the model and, therefore, part of the information retrieved by the methodology may be due to the participation of the coefficient of dominance associated with the effects of SCA. The low indices of relatedness found in this study may be due to the occurrence of biases in obtaining these estimates. Ritland (1996) emphasizes that the use of coefficients can lead to negative estimates of relatedness reflecting in large statistical error with small sample size of the study population, introducing bias in the estimates and distorting the associations between variables. This can occur because these coefficients were developed for studies of natural populations, where the sample size may influence the results of the relatedness estimates. Another likely explanation for the low relatedness values detected may be due to the fact that the inbred lines used in this study are, mostly, from different backgrounds, i.e., they may have originated from different populations and thus, the estimates of relatedness between these inbred lines would be expected to be low or zero. One of the reasons why the breeder may prefer to use the SBD lies in the fact that these estimators consider the conditional probability that two individuals possess alleles inherited from common genitors, where only individuals who meet this condition participate in the prediction of untested hybrids leading to more consistent and less biased predictions. Moreover, in ideal situations, such as those obtained by Bernardo (1994, 1995), where two distinct heterotic groups are evident, the predictions using the SBD tend to be more accurate and consistent with the observed values. These results were also observed by Balestre et al. (2010). However, if distinct groups do not occur and the inbred lines come from different backgrounds the level of information retrieved using the SBD may be minimal and lead to less accurate predictions, as occurred in this study. Still regarding the absence of relatedness, Bernardo (1996b) found that the BLUP is robust when up to 25% relatedness is unknown, or when there are biases in the estimates. In the case of this study, the percentage of evaluated crosses that presented the relatedness coefficient of zero was much higher than the values described by that author. It was observed that the participation of GCA in predicting the genotypic values of the hybrids was significant, which made the predictions of genotypic values more precise than the Genetics and Molecular Research 9 (4): 2381-2394 (2010)
©FUNPEC-RP www.funpecrp.com.br
Prediction of maize hybrid performance
2393
predictions considering only the SCA. This fact was also observed in several studies where the variance of GCA was higher than the variance of SCA and in these cases, as expected, the predictions were assisted. In this study, although the variance of SCA was greater than the variance of GCA, the difference between the two variances was less pronounced as observed by Balestre et al. (2010). Even in this case, the authors observed medium magnitude correlation values between the predicted and observed values. Importantly, although the BLUP-SIS method showed higher correlation and selection efficiency values (high accuracy), this method showed the highest PRES values (high bias), i.e., the predictions using the BLUP-SBD method were closer to the observed values, leading to less biased predictions of genotypic values of the untested hybrids, although the SBD prediction values were more dispersive (less accurate). The BLUP-SIS method provided a better ranking of hybrids, which can be confirmed by the selection efficiency values and correlations between observed and predicted values. In this sense, it can be inferred from this study, that the BLUP-SIS method has more practical application for the breeder, since what is sought in most cases is the identification and ranking of the best hybrids, although their predictions present a greater bias due to the retrieval of information from the entire set of analyzed hybrids. Even with the evident superiority of the BLUP-SIS method over the BLUP-SBD observed in this study, it was found that the BLUP-SBD method is very robust in relation to the level of relatedness information recovered and its predictive capacity obtained from the coefficients of this class. Thus, it can be inferred that the BLUP-SBD can be preferably used in situations where it obtains a greater quantity of measures of relatedness between the genitors and, somehow, leads to more accurate predictions of the genotypic values of the untested hybrids. Based on the results of this study it can be inferred that the SIS, although with a bias due to overestimation of relatedness, can be used in situations where the SBD presents few values of relatedness among the set of evaluated genitors. Moreover, the predictions of the performance of hybrids through BLUP-SIS and BLUP-SBD demonstrate the potential of these methodologies as tools to be used in maize breeding programs, making it feasible to predict the performance of hybrids even before these materials are effectively analyzed. This allows the breeder to reduce the number of hybrids to be analyzed and provides analysis of these hybrids in more environments and in different culture conditions, leading to the selection of hybrids with higher adaptability and yield potential.
ACKNOWLEDGMENTS Research supported by Coordenação de Aperfeiçoamento de Pessoal de Nível Superior (CAPES) and Fundação de Amparo à Pesquisa do Estado de Minas Gerais (FAPEMIG).
REFERENCES Allen DM (1974). The relationship between variable selection and data augumentation and a method for prediction. Technometrics 16: 125-127. Amorim EP, Amorim UBO and Santos JB (2006). Genetic distance based on SSR and grain yield of inter- and intrapopulational maize single cross hybrids. Maydica 51: 507-513. André CMG (1999). Avaliação da Melhor Predição Linear não Tendenciosa (BLUP) Associada ao Uso de Marcadores Moleculares na Análise Dialélica. Master thesis, Universidade Federal de Lavras, Lavras. Balestre M, Von Pinho RG, Souza JC and Lima JL (2008a). Comparison of maize similarity and dissimilarity genetic
Genetics and Molecular Research 9 (4): 2381-2394 (2010)
©FUNPEC-RP www.funpecrp.com.br
D.V. Ferreira et al.
2394
coefficients based on microsatellite markers. Genet. Mol. Res. 7: 695-705. Balestre M, Von Pinho RG, Souza JC and Machado JC (2008b). Potential of maize single-cross hybrids for extraction of inbred lines using the mean components and mixed models with microsatellite marker information. Genet. Mol. Res. 7: 1106-1118. Balestre M, Von Pinho RG, Souza JC and Oliveira RL (2009). Potential use of molecular markers for prediction of genotypic values in hybrid maize performance. Genet. Mol. Res. 8: 1292-1306. Balestre M, Von Pinho RG and Souza JC (2010). Prediction of maize single-cross performance by mixed linear models with microsatellite marker information. Genet. Mol. Res. 9: 1054-1068. Bernardo R (1993). Estimation of coefficient of coancestry using molecular markers in maize. Theor. Appl. Genet. 85: 1055-1062. Bernardo R (1994). Prediction of maize single-cross performance using RFLPs and information from related hybrids. Crop Sci. 34: 20-25. Bernardo R (1995). Genetic models for predicting maize performance in unbalanced yield trial data. Crop Sci. 35: 141-147. Bernardo R (1996a). Best linear unbiased prediction of maize single-cross performance given erroneous inbred relationships. Crop Sci. 36: 862-866. Bernardo R (1996b). Best linear unbiased prediction of maize single cross performance given erroneous inbred relationships. Crop Sci. 36: 50-56. Bickel DR (2002). Robust estimators of the mode and skewness of continuous data. Comput. Stat. Data Anal. 39: 153-163. Bickel DR (2003). Robust and efficient estimation of the mode of continuous data: the mode as a viable measure of central tendency. J. Stat. Comput. Simulation 73: 899-912. Charcosset A, Bonnisseau B, Touchebeuf O, Burstin J, et al. (1998). Prediction of maize hybrid silage performance using marker data: comparison of several models for specific combining ability. Crop Sci. 38: 38-44. Dalenius T (1965). The mode - a neglected statistical parameter. J. Royal Stat. Society 128: 110-117. Dias LA, Picoli EA, Rocha RB and Alfenas AC (2004). A priori choice of hybrid parents in plants. Genet. Mol. Res. 3: 356-368. Griffing BA (1956). Concept of general and specific combining ability in relation to diallel crossing systems. Aust. J. Biol. Sci. 9: 463-493. Hamblin J and Zimmermann MJ (1986). Breeding common bean for yield in mixtures. Plant Breed. Rev. 4: 245-272. Henderson CR (1984). Applications of Liner Models in Animal Breeding. University of Guelph, Guelph. Lynch M and Ritland K (1999). Estimation of pairwise relatedness with molecular markers. Genetics 152: 1753-1766. Melchinger AE (1999). Genetic Diversity and Heterosis. In: The Genetics and Exploitation of Heterosis in Crops (Coors JG and Pandey S, eds.). American Society of Agronomy, Madison. Nejati-Javaremi A, Smith C and Gibson JP (1997). Effect of total allelic relationship on accuracy of evaluation and response to selection. J. Anim. Sci. 75: 1738-1745. Queller DC and Goodnight KF (1989). Estimating relatedness using genetic markers. Evolution 43: 258-275. Reif JC, Melchinger AE, Xia XC, Warburton ML, et al. (2003a). Use of SSRs for establishing heterotic groups in subtropical maize. Theor. Appl. Genet. 107: 947-957. Reif JC, Melchinger AE, Xia XC, Warburton ML, et al. (2003b). Genetic distance based on simple sequence repeats and heterosis in tropical maize populations. Crop Sci. 43: 1275-1282. Reif JC, Melchinger AE and Frisch M (2005). Genetical and mathematical properties of similarity and dissimilarity coefficients applied in plant breeding and seed bank management. Crop Sci. 45: 1-7. Ritland K (1996). Estimators for pairwise relatedness and individual inbreeding coefficients. Genet. Res. 67: 175-185. Ritland K (2006). MARK - Genetic Marker Analysis Program. Version 3.1. University of British Columbia, Vancouver. Rohlf FJ (2000). NTSYSpc Numerical Taxonomy and Multivariate Analysis System. Version 2.1. Exeter Software, Setauket. SAS Institute (2000). SAS/ STAT Urse’s Guide, Version 8. SAS Institute Inc., Cary. Schrag TA, Möhring J, Maurer HP, Dhillon BS, et al. (2009). Molecular marker-based prediction of hybrid performance in maize using unbalanced data from multiple experiments with factorial crosses. Theor. Appl. Genet. 118: 741-751. Van Vleck LD (1993). Relationships from Sires and Maternal Grandsires of Males. In: Selection Index and Introduction to Mixed Model Methods for Genetic Improvement of Animals. CRC Press, Boca Raton, 298. Wang J (2002). An estimator for pairwise relatedness using molecular markers. Genetics 160: 1203-1215.
Genetics and Molecular Research 9 (4): 2381-2394 (2010)
©FUNPEC-RP www.funpecrp.com.br