construct the probabilistic map (occupancy grid) of a random field. ..... [13] H. P. Moravec and A. Elfes, âHigh resolution maps from wide angle sonar,â In Proc.
Probabilistic Map Building by Coordinated Mobile Sensors Jen-Yeu Chen, Student Member, IEEE, and Jianghai Hu, Member, IEEE
Abstract— In this paper, we develop an efficient algorithm for coordinating a group of mobile robotic sensors to collaboratively construct the probabilistic map (occupancy grid) of a random field. Each mobile sensor is responsible for exploring its onlinecomputed dynamic Voronoi polygon with a tendency of moving toward the most uncertain area, thus avoiding energy and time waste from wandering around and surplus explorations. The performance is measured by the total entropy of the built probabilistic map. Simulation results show that our algorithm is both time and energy efficient.
Each of these two approaches has its own advantages and disadvantages, and captures one aspect of the map building problem. In this paper, we focus on the second one. The major keys to the map building problem are as follows. •
I. I NTRODUCTION Map building is the process of establishing a representation of a previous unknown environment, which, for instance, might be a room in a building, a potentially hazardous working place, or a battle field. The task of map building is usually undertaken by one or multiple mobile robots which are equipped with various sensors aboard. A group of mobile robots with sensors aboard is also called a mobile sensor network in which a sensor node is a robot. Much of the research effort to date to build a map has focused on the single robot scenario, whereas in this paper we develop an efficient scheme for multiple robots to cooperatively construct a map. Because of the complicated nature of the task, map building is often coupled with other tasks. For example, in the front end, when the problem of locating the robots in the environment is also considered, one has the SLAM (simultaneous localization and mapping) problem [3], [11], [12]. Alternatively, map building can also be combined with various applications that utilize the map to be built, for example, the pursuer’s strategy in a pursuer-evader game in an unknown environment. There are two typical mapping ways to represent the knowledge of a region of interest. The first approach [3], [11], [12], assumes a set of possible shapes of obstacles, e.g. polygons or rectilinear polygons, in a given region. Usually each such shape is parameterized by a finite set of parameters which the robots need to determine. The second approach [4], [5], [6], [8], [9], [13], [14], [15] partitions the region into a regular grid of cells (as shown in Fig. 1), and associates with each cell a probability that reflects the possibility that the cell is occupied by an obstacle. The resulting cells together with the associated probabilities are often called the occupancy (uncertainty) grid. An occupancy grid is a probabilistic map of the region (environment) based on known knowledge and it can be updated by new knowledge. J.-Y. Chen and J. Hu are with School of Electrical and Computer Engineering, Purdue University, West Lafayette, IN 47907, USA (Email: {jenyeu, jianghai}@purdue.edu).
•
•
Sensor Model. Depending on the type and capability of on-board sensors, a sensor model is a function from the environment states (in this case, the configuration of obstacles and the positions and orientations of the robots) to a set of measurement readings, possibly corrupted by noises. In this paper, a sensor model P (M |A) is the conditional probability of getting the measurement M given that the environment is with property A, e.g. occupied by obstacles or not. For example, the readings from a range detector indicate the presence of obstacles within a cone together with their distances from the robot, and the readings are accurate with a certain probability determined by the distance of the obstacle, its deviation from the center of beam, and heat noises of the sensor. The Sensor models are normally investigated and determined by taking readings of the sensor in known environment states. Map Update Model. Given a set of measurements taken by the mobile robots, one needs to update the map in accordance with these measurements. Also, it is often the case in practice that the maps kept in different robots are not identical, whether this is due to communication delays, or transmission errors. It is important that one should have a mechanism to “reconcile” these discrepancies. The typical methods in map update are the Bayes’ update rule and various other inference rules. Of these we mention particularly the graphical model, which is suited for inferences under complicated relations. Control Strategy. At each time instance, one has to decide the motion and temporary goal of each mobile robot. The control strategies are classified as centralized and decentralized. The centralized strategies assume the presence of a central controller, and often the precise information on the positions of the robots, while for decentralized strategies, each robot makes decisions on its own using information that is available to it at that time, which could vary among different robots, and, occasionally, the decisions could be redundant or even contradictory at the moment. In this paper, we present a hybrid algorithm to coordinate the motion of a group of robots. A central controller doesn’t exist and all robots execute the same coordinated map building algorithm
•
based on the same information, a shared map, updated by direct communications with each other. Practical Constraints. Depending on the way of communication between robots, various practical constraints could be adopted. For example, the power limit and channel capacity of the communication units aboard the robots could constrain that at any time the robots should form a team that no robot is at a distance farther than a threshold away from the rest of the robots, or each robot should be “visible” to at least one other robot, or each robot can only receive the up to date maps from other robot after a certain time of delay. The ability to incorporate these constraints is vital for the success of the algorithm in practical situations. II. P ROBLEM
FORMULATION AND THE SOLUTION
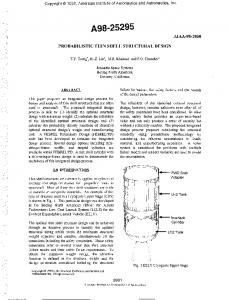
Suppose there are multiple mobile robots trying to map an unknown region D in R2 . It is possible to apply the current approach to 3D regions after certain modifications. The region D ⊂ R2 is partitioned into a grid of cells, D = {(xi , yi ) ∈ Z2 : i ∈ Γ}, where Γ is a finite set of the indices of the cells. Each (xi , yi ) ∈ D represents a rectangle [xi , xi +1]×[yi , yi +1] ⊂ R2 , which is either occupied by an obstacle totally, or is empty totally. See Fig. 1 for an example of a rectangular region D, where those cells occupied by obstacles are blackened. If at some time a robot is in a cell (xi , yi ) which is not occupied, then at the next time step, it can, according to the coordination policy, stay at cell (xi , yi ), or move to one of the un-occupied immediately neighboring cells of (xi , yi ).
A. Sensor Model We suppose all robots are with the same sensor model. Each robot takes measurement of each cell independently. A measurement of cell i = (xi , yi ) is a random variable denoted (k) as Mi ∈ {0, 1}, where k is the number of measurements made at cell i regardless from which robot (since their (k) sensor models are the same). Mi = 1 means that the kth measurement result suggests cell i is occupied whereas (k) Mi = 0 represents the k-th measurement result of cell i is un-occupied. After taking measurement, all the robots then update the shared occupancy grid, the probabilistic map of the whole region. We assume the robots can communicate1 with each other timely to update the shared occupancy grid. This assumption is based on the fact that the energy cost of robots’ movements is larger than that of communication. Thus, a coordination globally minimizing the number of robots’ movements will benefit the energy saving although it spends some energy on communications. Let Ai ∈ {1, 0} be the random variable that cell i is truly occupied (Ai = 1) or not (Ai = 0) in reality. The sensor model of each robot is hence p(Mi |Ai ). We assume the sensor model p(Mi |Ai ) is time invariant. For simplicity we denote p00
= P (Mi = 0|Ai = 0),
p01 p10
= P (Mi = 0|Ai = 1), = P (Mi = 1|Ai = 0)
p11
= P (Mi = 1|Ai = 1).
(2)
The larger p00 , p11 are, the more accurate the sensors. For a more realistic model, one can choose different values of these conditional probabilities for different cells measured, depending on the sensing pattern of the sensor and the distance as well as the angle between the sensor and the cell measured, provided that a robot can sense not only its currently located cell but also the neighboring cells. B. Map Update Model
Fig. 1.
Region D with obstacles marked.
The knowledge of a robot about the environment D is represented by the probabilistic map (occupancy grid) it keeps, which is defined to be a collection of probabilities, {pi ∈ [0, 1] : i ∈ Γ}, such that pi is the probability (the certainty) that cell (xi , yi ) is occupied. The value of pi will be updated whenever a robot explores (measures) cell i. Usually a transformed version of the probability map (occupancy grid) is more useful. For each probability pi , the odd of the cell i is defined to be pi oi = ∈ [0, ∞] (1) 1 − pi The logarithmic odd map is the collection {log oi : i ∈ Γ}.
The robots take measurements of the environment, and update the occupancy grid based on these measurements. Whenever a robot is at a position (xi , yi ), it can measure the cells in [(xi , yi ) + Nb ] ∩ D, where Nb is a cluster of points in Z2 containing the origin. Hence the robot can always measure the cell it stays at, as well as a set of cells close to it. The size of Nb reflects how powerful the sensors on board are. (1,k) Suppose a cell i has been measured k times. Let Mi = (1) (2) (k) {Mi , Mi . . . , Mi } be the sequence of k measurements on cell i. A robot now visits cell i to make a new measure(k+1) ment Mi and then updates the probability (certainty) of occupancy of cell i, (k+1)
pi
(1,k+1)
= P (Ai = 1|Mi
),
(3)
1 In the region of interest, robots may communicate with each other by one-hop direct connections, multi-hop relays among robots, or connections via a base station.
(k+1)
where the superscript (k + 1) of pi indicates the (k + 1)th step. Also, the odd of cell i at (k + 1)-th step, denoted (k+1) oi , is (k+1) pi (k+1) oi = . (4) (k+1) 1 − pi By the Bayes’ rule, we have (1,k+1)
P (Ai |Mi = = =
)
(1,k) (k+1) P (Ai |Mi , Mi ) (k+1) (1,k) (1,k) P (Mi |Mi , Ai ) · P (Ai |Mi ) (k+1) (1,k) P (Mi |Mi ) (k+1) (1,k) P (Mi |Ai ) · P (Ai |Mi ) , (k+1) P (Mi )
Fig. 2.
(0)
where the last equality follows from the assumption that all measurements are independent. However, the above equation (k+1) is not useful as the probability P (Mi ) is not readily available. To overcome this difficulty, we set Ai = 0 and Ai = 1 respectively to obtain (1,k+1)
P (Ai = 1|Mi =
)
(k+1) P (Mi |Ai
(1,k)
= 1) · P (Ai = 1|Mi
)
(k+1) P (Mi )
(1,k+1) P (Ai = 0|Mi ) (k+1) P (Mi |Ai
=
(1,k)
= 0) · P (Ai = 0|Mi (k+1) P (Mi )
)
(1,k+1)
Our goal is to find a dynamic strategy to coordinate the motions of robots such that the residual uncertainty of the map is minimized in a fixed amount of time. The residual uncertainty of a probabilistic map (occupancy grid) can be defined by the total entropy of the occupancy grid: X X H(D) = H(i) = (pi log pi + (1 − pi ) log(1 − pi )),
.
i∈Γ
)
(1,k+1) P (Ai = 0|Mi ) (k+1) P (Mi |Ai = 1) · = (k+1) P (Mi |Ai = 0)
(1,k)
P (Ai = 1|Mi P (Ai =
)
(1,k) 0|Mi )
,
which can be rewritten as (k+1)
oi
(k)
= ρM · oi ,
(5)
where ρM =
(
ρ0 = ρ1 =
p01 p00 p11 p10
(k+1)
if Mi if
(k+1) Mi
=0 = 1.
(6)
Note that the value of ρM is pre-determined by the sensor model and does not depend on the time k since we assume the sensor model to be time invariant. Normally, a sensor is of the higher probability to have a correct measurement, i.e. p00 ≥ p01 and p11 ≥ p10 . Thus normally 0 < ρ0 ≤ 1 and ρ1 ≥ 1. For practical usage, we take the logarithm of equation (5) to obtain the map update rule for the logarithmic odd: (k+1)
log oi
described in equation (7). Initially, all the probability pi are 0.5, reflecting the fact that the robots know nothing about (0) the environment. Hence log oi = 0, ∀i ∈ Γ. As time (k) goes on and new measurements are taken, in general log oi become random processes whose values at each step depend on the outcome of the random measurements by robots. Note (k+1) (k) that log oi = log oi if the cell i is outside all robots’ measurement ranges. C. Coordination and Performance Metric
,
The quotient of the above two equations yields P (Ai = 1|Mi
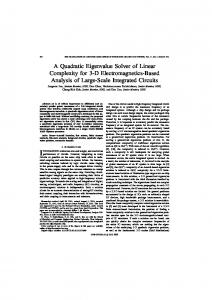
Voronoi partitions for Euclidean and street distances.
(k)
= log ρM + log oi ,
(7)
where ρM is determined by (6). At each time step, robots measure the cells within their measurement range, and update the logarithmic odd map as
i∈Γ
(8) where the first equality follows from the independence of pi of each cell. W. l. o. g., we omit the superscript (k) in the above definition. Note that the larger H(D) is, the more uncertain the corresponding probabilistic map. Since robots keep exploring the region D, the total entropy H(D) is in a decreasing tendency. The pi of equation (8) can be easily obtained from the updated odd or logarithmic odd by their relationship in equation (1). In the next section, we will present our algorithm for the coordination of multiple robots that can reduce the residual uncertainty H(D) of a probabilistic map in a time and energy efficient way. III. A LGORITHM
Suppose at some time step, the positions of the robots are (al , bl ), l = 1, . . . , m. The Voronoi partition is a decomposition of D into disjoint subsets D1 , . . . , Dm , such that Dl = {(xi , yi ) ∈ D : (xi , yi ) is closest to (al , bl )}. In case that there is more than one (al , bl ) closest to (xi , yi ), we can attribute (xi , yi ) to any one of them. Dl is called the Voronoi polygon of robot l. Shown in Fig. 2 are the Voronoi partitions under two different definitions of distance: Euclidean and street. The philosophy of our algorithm is that a robot should be responsible for the exploration of the uncertain area closest to it. To achieve this goal, every robot computes
Entropy on region 3, D
the Voronoi partition of the shared occupancy map and then moves toward the cell of the minimal absolute odd |oi | in its Voronoi polygon. If a cell i has been well explored, it would be of low entropy (high certainty) H(i) and high absolute odd, |oi |.
350 scenario1 (right down) scenario2 (right down)) scenario3 (left down) scenario4 (left down)
300
250 entropy
Assume that Euclidean distance is adopted. Our recursive algorithm is outlined below. A regular step includes all actions except the initialization. The effect of the register nl is to let the robot to turn back to the original direction after it made turns to avoid obstacles.
3
400
200
150 scenario3 100
scenario2 scenario4
50 scenario1
Algorithm: coordinated map building by multiple robots 0 0
Initialization: each robot chooses its initial position, set its mode to be “pursue” and initialize the logarithmic odd map {log oi = 0 : i ∈ Γ}. A step includes the following actions: 1. All the robots take measurements and update the occupancy map accordingly. 2. Given the positions of robots, (al , bl ), l = 1, . . . , m, construct the Voronoi partition D1 , . . . , Dm . For each robot l = 1, . . . , m, • If the mode of robot l is “pursue”, find among all cells (xi , yi ) ∈ Dl the one minimizing |oi | + λk(xi , yi ) − (al , bl )k2 ,
(9)
where λ is a positive weight. Suppose (xi∗ , yi∗ ) is one minimizer. Let goall := (xi∗ , yi∗ ). The robot l try to move to its neighbor closest to goall . – If the neighboring cell is empty then move to the cell and keep in “pursue” mode. – If that cell is occupied, turn counterclockwise (left) to find a empty neighboring cell and move to the cell unless the robot is trapped. Set the mode of robot l to “avoid” and initialize a register, nl = 0, which records the number of turns. • If the mode of robot l is “avoid”, and nl < 2 then robot l turn clockwise (right) and try to move to that neighboring cell. – If succeed, set nl = nl + 1, – else if turn counterclockwise (left) to find a empty neighboring cell and move to the cell unless the robot is trapped. • If the mode is “avoid” and nl = 2 , set the mode to “pursue” and reset nl = 0. • If the boundary of D is reached, reverse the direction of turning, reset nl = 0. 3. check for some stopping criteria (total entropy has been less than a pre-decided threshold) if it should be terminated.
50
100
150
200
250
step
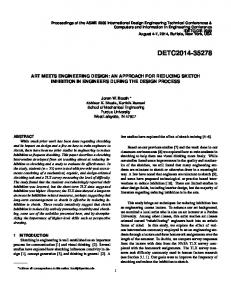
Fig. 5. D3
The total entropy (residual uncertainty) vs. time step. of Region 3
IV. S IMULATIONS A. Simulation setup We comprehensively simulate our algorithm on regions in various sizes and configurations. Fig. 3 illustrates an example of 3 mobile robots to explore a square region D, in which the snapshots of the constructed map (occupancy grid) at different time steps are plotted. We indicate the probability of occupancy of each cell in grey-scale. In the beginning, all the cells are un-explored and in neutral grey. While the mobile agents move around, they gradually reveal cells’ occupancy. The darker a cell’s color becomes, the higher the probability it is occupied. A cell become white or black as it is explored to be empty or occupied, respectively. We present simulation results on four different regions shown in Fig. 4 as four 20x20 cells in different occupancy configurations. In each case, there are four robots to explore the region. We set the parameter λ in equation (9) to 0.1. Also, the conditional probabilities to make correct measurement in condition of a cell’s occupancy, namely, p00 and p11 , are both set to 0.9. A robot can measure its currently located and neighboring cells. The p00 and p11 for the currently located cell and neighboring cells are set to be the same. We thus compare the results of robots with two different measurement ranges: (1) current cell and one cell ahead in the robot’s orientation, (2) current cell and four neighboring cells – left, right, up, and down. We measure the performance by the residual uncertainty of exploration in terms of binary total entropy, H(D). B. Simulation results The four curves in Fig. 5 show the results of four different exploration scenarios for the region D3 shown in Fig. 4(c). The four robots’ initial positions are (12,4), (13,4), (14,4), and (15,4) for scenarios 1 and 2 and (4,4), (5,4), (6,4), and (7,4) for scenarios 3 and 4. Even though robots initiate at the same positions, the exploration scenario can vary due to the
Fig. 3.
(a) Region 1, D1 .
Maps at different time steps.
(b) Region 2, D2 . Fig. 4.
(c) Region 3, D3 .
(d) Region 4, D4 .
Regions considered in simulation.
random nature of measurements. The initial total (binary) entropy is 400 as each cell has initial (binary) entropy 1. The total entropy decreases at a constant rate initially, indicating that all the robots are exploring new area. The rate of decrease slows down gradually and then abruptly after a certain time, at which point most of the region has been explored by at least one robot. The fluctuation in the curve is due to the random nature of robot measurements. All curves land on the final total entropy which is 3 for D3 since 3 cells of D3 are surrounded by obstacles and can not be explored. At the early stage, the deceasing rate of scenarios 3 and 4 are smaller than that of scenarios 1 and 2. This is because, in scenarios 3 and 4, robots which initiate at the left down corner are confined by obstacles. There are only two doors, i.e. cell (2,7) and cell (12,3) for those robots to go through to explore other areas of D3 . A robot may keep searching explored cells at left down corner before it goes through one of the doors. On the other hand, in scenarios 1 and 2, all robots which initiate at the right down corner are free to search un-explored cells. The left sub-figure of Fig. 6 shows the total entropy decreasing by time steps on four different regions shown in Fig. 4 whereas the right sub-figure magnifies the steps from 200 to 300 to show the different final total entropies of the 4 different regions. The final total entropy of Region 2, D2 , is 0 since no cell is surrounded by obstacles in D2 . The Region 4, D4 , with the largest number of cells being surrounded by obstacles, hence has the largest final total entropy. Rarely but once in a while, especially at the final stage, the total entropy could lightly buck up and then return to the decreasing trend as shown in the curve 4 in the right sub-
figure of Fig. 6. It is possible that two consecutive measurements of a cell are opposite and hence the latter measurement increases the entropy (the uncertainty) of the cell. Most cells get consecutive same (and correct) measurements in that the probability of correct measurement is 0.9. Each of them contributes to the decrement of total entropy. Only few cells have opposite consecutive measurements, contributing to the increment of total entropy. The effect of increment from consecutive opposite measurements will manifest at total entropy only when (1) most of the cells have been well explored and the changes of their entropy become extremely small (near 0). (2) one cell which has been explored once (in the case of curve 4) has a measurement opposite from its previous one, incurring a (big) entropy increment larger than the sum of all the extremely small entropy decrements from other cells. These two conditions will only happen (with low possibility) at the late stage of simulation as in the curve 4 in right sub-figure of Fig6. The following measurements of the cell will decrease the entropy back.
Fig. 7 compares the effect of different measurement ranges of robots. We show the results of two regions, D1 and D2 . In each case, two measurement ranges are considered: (1) one neighboring cell in the direction of robot’s orientation and (2) four neighboring cells. Robots initiate at cells (6,6), (15,6), (6,15) and (15,15). The wider measurement range does help at the early stage in decreasing the total entropy as it explores more cells at a time. After most of the cells have been explored, the range will not help much at the late stage of exploration.
Total entroy vs step on 4 different regions 400
20
region1 D1 region2 D2 region3 D3 region4 D4
350
region1 D 1 region2 D2 region3 D 3 region4 D4
18 16
300 14 12
entropy
entropy
250
200
3 150
1
10
4
8
1
4 6
3
100 4 50
2
2
2 0 1
100
200
0 200
300
220
step
240
260
280
300
R EFERENCES
step
Fig. 6. The total entropy (residual uncertainty) vs. time step on 4 different regions. Total entropy on Region 1, D
Total entropy on Region 2, D
1
2
400
400 1 neighbor 4 neighbors
350
350
300
300
250
250 entropy
entropy
1 neighbor 4 neighbors
200
200
150
150
100
100
50
50
0 1
50
100
150
200
250
step
0 1
50
100
150
200
step
Fig. 7. The total entropy (residual uncertainty) vs. time step. for different measurement ranges of robots on Region 1 D1 and Region 2 D2 .
V. C ONCLUSION
show that, via collaboration, robots who only search their own Voronoi polygons obtain the map of the whole region efficiently both in time and energy costs. In the presented coordination algorithm, we assume all robots can communicate to share a probabilistic map. This assumption is based on the fact that the energy cost of communication is less than the energy cost of robot movement. To further reduce the energy cost, we now are lifting this assumption and considering the situation that robots can only communicate with nearby robots within a certain distance to exchange and their maps. Thus, different robots will have different maps at the early stage and then reach the consensus after all. Each robot decides where to move and explore solely depending on its own map. It will be interesting to see the drawbacks and benefits of this modification.
AND FUTURE WORKS
In this paper, we present a coordination algorithm for a group of mobile robots with sensors aboard to efficiently construct the probabilistic map (occupancy grid) of a random field. The probabilistic sensor model and the mapupdating model of the probabilistic map are also thoroughly developed. We measure the performance of the coordinating algorithm by the total entropy (residual uncertainty) of the built probabilistic map. The map construction task will finish when the total entropy is below a desired threshold. All robots can communicate to update a shared map. By the dynamically computed Voronoi areas (cells), the region under exploration is separated into several areas. Through the coordination algorithm, a robot will be responsible to explore the area closest to it in distance, efficiently saving the energy cost for its movements. Our simulation results
[1] I. J. Cox and J. J. Leonard, “Modeling a dynamic environment using a Bayesian multiple hypothesis approach,” Artif. Intell., 66(2): pp. 311-344, 1994. [2] J. L. Crowley, “Coordination of action and perception in a surveillance robot,” IJCAI, pp 793-796, 1987. [3] M.W.M. G. Dissanayake, P. Newman, S. Clark, H. Durrant-Whyte and M. Csorba, “A solution to the Simultaneous Localization and Map building (SLAM) problem,” IEEE Transaction on Robotics and Automation, 17(3): pp. 229-241, 2001. [4] A. Elfes, “Using occupancy grids for mobile robot perception and navigation,” Computer, 22(6): pp. 46-57, 1989. [5] A. Elfes, “Occupancy grids: A stochastic spatial representation for active robot perception,” In Proc. Sixth Conference on Uncertainty in AI. 1990. [6] A. Elfes, “Dynamic control of robot perception using multi-property inference grids,” In Proc. IEEE International Conference on Robotics and Automation, 1992. [7] D. Hahnel, R. Triebel, W. Burgard, S. Thrun, “Map building with mobile robots in dynamic environments,” In Proc. IEEE International Conference on Robotics and Automation, pp 1557-1563, 2003. [8] K. Konolige, “Erratic competes with the big boys,” AI Magazine, 16(2): pp. 61-67, 1995. [9] K. Konolige, “Improved occupancy grids for map building,” Auton. Robots, 4(4): pp. 351-367, 1997. [10] K. Konolige, “Large-scale map-making,” In Proc. AAAI, pp. 457-463, 2004. [11] J. Leonard, H. Durrant-Whyte, and I.J. Cox, “Dynamic map building for an autonomous mobile robot,” In IROS, pp. 89-95, 1990. [12] J. Leonard and H. Durrant-Whyte, Directed Sonar Sensing for Mobile Robot Navigation, Kluwer Academic Publisher, Boston, 1992. [13] H. P. Moravec and A. Elfes, “High resolution maps from wide angle sonar,” In Proc. 1985 IEEE International Conference on Robotics and Automation, pp. 116-121. 1985. [14] H. P. Moravec, “Sensor fusion in certainty grids for mobile robots,” AI Magazine, 9(2): pp. 61-74, 1988. [15] H. P. Moravec, M. Blackwell, “Learning sensor models for evidence grids,” Robotics Institute Research review, pp. 8-15, 1992. [16] C. Ortiz, K. Konolige, R. Vincent, B. Morisset, A. Agno, M. Eriksen, D. Fox, B. Limketkai, J. Ko, B. Steward, D. Schulz, “Centibots: Very large scale distributed robotic teams,” In Proc. AAAI, pp. 1022-1023, 2004. [17] B. Schiele, J. L. Crowley, “A comparison of position estimation techniques using occupancy grids,” In Proc. IEEE International Conference on Robotics and Automation,, pp. 1628-1634, 1994. [18] B. Stewart, J. Ko, D. Fox, K. Konolige, “The revisiting problem in mobile robot map building: A hierarchical Bayesian approach,” UAI, pp. 551-558, 2003. [19] R. Szabo, “Topological navigation of simulated robots using occupancy grid,” CoRR cs.RO/0411022, 2004. [20] S. Thrun, “A probabilistic online mapping algorithm for teams of mobile robots,” Int. J. Robotics Research, 20(5): pp. 335–363. 2001. [21] S. Thrun, “Learning occupancy grid maps with forward sensor models,” Auton. Robots, 15(2): pp. 111-127, 2003.