Clinical and Experimental Ophthalmology 2008; 36: 464–467 doi: 10.1111/j.1442-9071.2008.01799.x
Original Article Red-green colour blindness in Singaporean children Audrey Chia FRANZCO,1,2 Gus Gazzard MD FRCOphth,3 Louis Tong FRCS(Edin) DM,1,2 Xiaoe Zhang MSc,4 Ee-Ling Sim BSc,1 Allan Fong MRCS(Edin)1,2 and Seang Mei Saw MBBS PhD4 1
Singapore Eye Research Institute, 2Singapore National Eye Centre, 4National University, Singapore; and 3University Hospital, London, UK
ABSTRACT Purpose: X-linked red-green colour blindness is the most common form of colour blindness. Various studies suggest that, worldwide, 2–8% of men are afflicted with this condition. The purpose of this study is to determine the prevalence of red-green colour blindness in Singaporean schoolchildren. Method: A total of 1249 children aged 13–15 years were screened using the Ishihara 24-plate edition book during the School Cohort study of the Risk factors for Myopia visit. Results: A total of 1210 children (96.8%) managed to correctly identify at least 13 of the initial 15 plates and were deemed to have normal colour vision.Thirty-three children (32 boys, one girl) were only able to identify nine or less plates and were considered to be colour blind. Overall, 5.4% (95% confidence interval 3%, 7%) of Chinese, 4.9% (1%, 9%) of Malay and 4.9% (2%, 11%) of Indian boys were colour blind (P = 0.97). Classification plates 16–17 were useful in determining deutran or protan tendencies in only 14 (43%) of the 33 children identified as being colour blind. Conclusion: 5.3% of boys and 0.2% of girls were found to be colour blind in this Singapore-based study. Although the Ishihara test proved useful in identifying colour-blind children, other tests are required to accurately classify the types of red-green colour blindness in these children. Key words: Asia, colour blindness, Singapore.
INTRODUCTION Discrimination of colour in humans depends on unequal stimulation of three (red, green and blue) cone types to lights of different wavelengths. Unfortunately, when abnormalities exist in one or more of the cone types, the affected individual
may have difficulty differentiating between certain hues.1,2 The most common type of inherited colour blindness is the X-linked recessive red-green type, where either the photopigment of the green or red cone is absent (deutranopia or protanopia) or where the photo-pigment response of the green cones is shifted towards that of the red cones (deuteranomaly) or vise versa (protanomaly).1–3 Heterozygous females are asymptomatic carriers, and their male off-springs have a 50% chance of being colour blind. Some children born with inherited colour deficits may not even realize that they have a problem as they have never been exposed to the full colour experience. Some form of screening is therefore useful as being colour blind can limit a person’s future job selection.1 In Singapore, for example, people who are colour blind cannot be electricians, chemists, policemen, or pilots, and may find themselves disadvantaged as painters or graphic designers. Similar restrictions may exist in other jurisdictions. Studies on populations of European origin have found red-green colour-blindness rates in about 8% of males and 0.4% of females.1,2 The prevalence of deuteranomaly was estimated at 5%, and deutanopia, protanopia and protanomaly accounted for a further 1% each.2 Other types of colour blindness such as yellow-blue colour blindness (tritanopia and tritanomaly), rod and blue-cone monochromaly exist but were extremely rare.1 In a Turkish study, Citirik et al found that 7.3% of male military personal were red-green colour blind with a deutran : protan ratio of 2 : 5.4 Studies from the Middle East have found male prevalence rates of red-green colour blindness of 8.1% in Iran, 2.9% in Saudi Arabia, 8.7% in Jordan and 2.2% in Libya.5–8 Several studies from India have found male prevalence rates of 2.3–3.8%.6,9 In East Asia, Kim et al noted colour blindness in 5.9% of Korean men, 0.4% of females with a deutran : protan ratio of 5 : 3.10 Yet another study in Thailand noted male rates of 5.6% in both their Thai and Chinese populations with a deutran : protan ratio of 5 : 2.11 The purpose of this study is to determine the prevalence of red-green colour blindness rates in Singaporean children.
䊏 Correspondence: Dr Audrey Chia, Singapore National Eye Centre, 11 Third Hospital Avenue, Singapore 168750. Email:
[email protected] Received 10 March 2008; accepted 10 June 2008 © 2008 The Authors Journal compilation © 2008 Royal Australian and New Zealand College of Ophthalmologists
Red-green colour blindness in Singaporean children
465
100%
Percentage
80% 60% 40% 20% 0% p2
p3
p4
p5
p6
p7
p8
p9
p10
p11
p12
p13
p14
p15
p16
p17
Plates from Ishihara 24-plate edition Normal response Other abnormal response Response consistent with red-green deficit No response
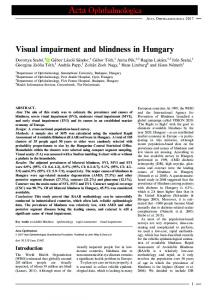
Figure 1. Responses given by children with ‘normal’ colour vision who made 1–2 mistakes during the test (n 143). Plates 2–7 were transformation (or confusion) plates, plates 8–13 were vanishing plates, plates 14–15 were hidden digit plates, and plates 16–17 were classification plates. For plates 8–13, no response is also response consistent with red-green colour deficit. For plates 14–15, no response is consistent with both normal and total red-green colour deficit response. For plates 16–17, all those with responses consistent with red-green colour blindness showed a deutran deficit.
METHODS Children from the School Cohort of Risk-factors for Myopia (SCORM) study were recruited for this study. Children in the SCORM study were first recruited in 1999 from three government-run schools, located in the North, East and West of the island. Those with severe medical conditions (e.g. congenital heart diseases), ocular syndromes associated with myopia, and allergy to cyclopentolate drops were excluded from the study. The original cohort consisted of 1979 children with a drop-out rate of approximately 5–10% per year. Children returning for their 2006 visit, aged 13–15 years, were screened for colour deficits using the Ishihara 24-plate edition book (Kanehara Shipping Co. Ltd., Tokyo, Japan). The test was performed under daylight conditions supplemented by classroom fluorescein lighting by a trained observer. Children wore their current spectacle correction, and only the right eyes were tested. Each child was given 5 s to identify the numbers on each plate and all answers were recorded. The initial 15 plates of the Ishihara 24-plate book were used to screen children for colour blindness. These were divided into the Introductory plate (plate 1), the Transformation (or Confusion) plates (plates 2–7), the Vanishing plates (plates 9–13) and the Hidden Digits (plates 14–15)1,3,13. The Introductory plate is a positive control that should be correctly read independent of the state of colour vision. Children who were unable to correctly identify the number on the Introductory plate were excluded from the study. Ability to see at least 13 plates of the first 15 plates correctly suggested normal colour vision, whereas ability to see nine or less plates indicated colour blindness. There was a grey area in which individuals could only see 10–12 plates, where colour deficiency was classified as being ‘indeterminate’. The last two Classification plates (plates
16–17) were used when a colour defect was detected in previous plates, to determine if the defect was deutran or protan in nature. The prevalence rate of colour blindness in male and female populations was first calculated and difference analyses using unpaired t-test. After exclusion of children of mixed or other ethnicities, prevalence rates in the three major racial groups were then analysed. All statistical analysis was performed using Statview Version 5.0.1. The study was approved by the Ethics Committee of Singapore Eye Research Institute and all procedures were conducted with adherence to the tenets of the Declaration of Helsinki.
RESULTS A total of 1249 children returned for their 2006 SCORM study visit (i.e. 63% of the 1979 children from the original 1999 cohort). Participants were slightly younger (13.7 vs. 14.1 years, P = 0.03), and less likely to be Chinese (71.2% vs. 80.7%, P < 0.0001) than non-participants. All children were aged between 13 and 15 years. The ethnic ratio of Chinese : Malay : Indian was 71 : 21 : 8, which was comparable to Singapore’s overall racial mix. Fourteen children were of ‘Other or Mixed’ ethnicity. All children tested identified the Introductory plate correctly. Most children (1210, 96.8%) were able to read at least 13 of the first 15 plates correctly and were deemed to have normal colour vision. The majority (1067, 88.2%) managed to identify all plates accurately, and 110 (9.1%) made one mistake and 33 (2.7%) made two. Of the 143 children who made only 1–2 mistakes, the most common errors were made in plate 13 (66%) followed by plates 3 (14 %), 14 (12%) and 5 (11%) (Fig. 1). Plate 13 (number ‘73’) was most often identified as ‘78’ (77% of the
© 2008 The Authors Journal compilation © 2008 Royal Australian and New Zealand College of Ophthalmologists
466
Chia et al.
Table 1. Colour-blindness rates according to gender Colour vision
Colour-blind Indeterminate
Number (prevalence rate, %) (95% confidence interval) Total
Male
Female
(n = 1249)
(n = 612)
(n = 637)
33 (2.6) (1.9, 3.8) 6 (0.5) (0.1, 0.9)
32 (5.2) (3.6, 7.2) 2 (0.3) (0, 0.8)
1 (0.2) (0, 0.5) 4 (0.6) (0.01, 1.2)
responses for this plate), plate 3 (number ‘29’) as ‘20’ (100%), plate 14 (hidden number ‘5’) as ‘11’ or ‘17’ (32%), and plate 5 (number ‘3’) as ‘8’ (100%). Six children (four girls, two boys) were only able to read 10–12 of the first 15 plates correctly and had ‘indeterminate’ colour vision. Thirty-three children (2.6%) were only able to identify nine or less plates correctly and were deemed to be ‘colour blind’. Males (5.2%) were more likely to be colour blind than females (0.2%) (P < 0.001; Table 1). Colourblindness prevalence rates for Chinese males was 5.4% (95% confidence interval [CI] 0.03, 0.07), and rates for Malay and Indian males were 4.9% (95% CI 0.01, 0.09) and 4.9% (95% CI 0.02, 0.11) respectively. There was no significant difference in rates between the three major racial groups (P = 0.97). Of those with colour blindness, more abnormal readings were obtained with the Vanishing plates 8–13 (91%) compared with Transformational plates 2–7 (81%) (Fig. 2). Fiftysix per cent were unable to see any numbers in the Hidden plates 14–15 (which is also the normal response), a further 10% had a response consistent with that expected red-green deficit, and 34% provided some other numerical response. Classification plates 16–17 were useful in only 43% of those identified as being colour blind, all of which were deutran in nature. Thirty per cent were able to see both classification numbers, 10% saw neither, and 17% saw some other number.
DISCUSSION In this Singapore-based study, red-green colour-blindness prevalence rates ranged from 4.9 % (in ethic Malay and Indian boys) to 5.2% (in Chinese boys) (Table 1). This rate is lower than the 8% commonly quoted in many in Caucasian populations, higher than those in South Asia (India), native America and Africa; and similar to that noted in East Asia (Korea and Thailand).4–11 However, even within apparently ethnically similar populations, variation in rates can occur. In an Australian-based study where the population was mainly of European origin, Cosstick et al found male rates of only 3.8%.12 Conversely, there are regions of Scotland and Ireland where the rates of colour blindness are exceptionally high.13 Some Turkish authors have commented that rates in their army recruits may be artificially elevated due to malingering.14 Rates recorded in the Middle East range from 2.2% to 8.7%.5–8 In short, although true variation in gene frequency may exist, differences in sampling methods, types
of colour tests used and diagnostic criteria may account for further disparity. In Singapore, recruitment for the SCORM study was designed to achieve a cross-sectional representation of the population by selecting schools on different parts of the island. Children from these schools had different socioeconomic, racial and academic profiles. Several years into the study, only 63% of the original cohort returned for their 2006 visit. Critics may argue that the study population would no longer be representative. Indeed, children who returned in 2006 were slightly younger and less likely to be Chinese. However, as colour-blind children have normal visual acuity and function similarly to other children, there was no reason why they may be specifically more or less likely to drop out of the study. Colour deficiency can be both congenital and acquired (i.e. due to drug reactions, optic nerve or macula abnormalities). All children who were found to be colour defective were referred to an ophthalmology service. However, some already knew they were colour blind, or had been reviewed previously and declined follow up. Of those who were formally assessed, none were known to have had acquired colour blindness. The Nagel anomaloscope remains the gold-standard for assessment and typing of colour blindness. Unfortunately, its large size, cost and importability make it a poor screening device. There is also a large range of other colour vision tests (such as the Richmond HRR, Farnsworth D15 or 100 Hue test) each with their individual strengths and weakness.1–3 The Ishihara test, which consists of a series of colour plates, was developed by Shinobu Ishihara in 1917 and is highly sensitive and specific in the detection of red-green colour blindness.1–3,15,16 It is the most commonly used screening test for red-green colour blindness. It was selected as the screening tool for this study because of its high sensitivity and specificity in detecting red-green colour blindness, and also because it was quick and easy to use. Unfortunately, the Ishihara test is limited by its inability to detect yellow-blue (tritanomaly) colour deficits, and to differentiate between inherited and acquired colour defects.1–3 The Ishihara chart consists of several different plates, and the effectiveness of each plate can vary. In her study on colour-deficiency subjects, Birch found with the 38-plate Ishihara test that the transformation and vanishing plates were sensitive in detecting defects in >95% but that the hidden plates were only sensitive in 50%.15,16 These proportions were remarkably similar to those noted using the 24-plate test in this study where colour-defective children provided abnormal readings in 81% and 91% of the transformational and vanishing plates, respectively, but only identified 52% of the digits on the hidden plates (Fig. 1). Cosstick et al, in a study on 6-year-old Sydney school children, noted numeral confusion in 76% of children identified as having ‘normal’ colour vision using the 24-plate Ishihara chart.12 These children made only 1–2 mistakes while reading plates 2–15. In his study, children had most difficulties with plates 3 (48%), 7 (14%), 5 (17%) and 13
© 2008 The Authors Journal compilation © 2008 Royal Australian and New Zealand College of Ophthalmologists
Red-green colour blindness in Singaporean children
467
100%
Percentage
80% 60% 40% 20% 0% p2
p3
p4
p5
p6
p7
p8
p9
p10 p11 p12 p13 p14 p15 p16 p17
Plates from Ishihara 24-plate edition Normal response Other abnormal response Response consistent with red-green deficit No response
Figure 2. Responses given by colour-blind children for plates 2–17 (n 33). Plates 2–7 were transformation (or confusion) plates, plates 8–13 were vanishing plates, plates 14–15 were hidden digit plates, and plates 16–17 were classification plates. For plates 8–13, no response is also response consistent with red-green colour deficit. For plates 14–15, no response is consistent with both normal and total red-green colour deficit response. For plates 16–17, all those with responses consistent with red-green colour blindness showed a deutran deficit.
(16%).12 In our Singaporean children, confusion was only noted in 12% of ‘normal’ children and problems were most often encountered with plates 13 (66%), 3 (14%), 14 (12%) and 5 (11%), suggesting that genetic and phenotypic differences may exist between the two groups (Fig. 1). However, the Singapore children were also much older, and possibly more likely to provide reliable responses. Birch also found that the classification plates made an accurate diagnosis in 94% of deuteranopes and 82% of protanopes, but only 57% of deutranomaly and 47% of protanomaly subjects.16 Overall, it is estimated that the Ishihara tests may be useful in differentiating between deutran and protan in 30–40%.1,2 In our study, the Ishihara 24-plate test classification was useful in only 43% of children resulting in our inability to determine the deutran and protan ratio in our population. As colour vision was tested with only one test, it is possible that in a large-enough population, some colour-blind people (in particular those with milder defects) may be missed. These findings suggest although the Ishihara test is a useful screening tool, other tests such as the Nagel anomaloscope, Richmond HRR, Farnsworth D15 and 100 Hue test are necessary to classify the type and extent of the colour defect.1–3
ACKNOWLEDGEMENT This study was supported by National Research Council (NMRC) grant NMRC/095/2005.
REFERENCES 1. Birch J. Diagnosis of Defective Colour Vision. Hong Kong: Oxford Medical Publications, 1993. 2. Schwartz SH. Visual Perception: A Clinical Orientation, 3rd Edn, USA: McGraw-Hill, 2004.
3. Cole BL. Assessment of inherited colour vision defects in clinical practice. Clin Exp Optom 2007; 90: 157–75. 4. Citirik M, Acaroglu G, Batman C, Zilelioglu O. Congenital colour blindness in young Turkish men. Ophthalmic Epidemiol 2005; 12: 133–7. 5. Modarres M, Mirsamadi M, Peyman GA. Prevalence of congenital colour deficiencies in secondary-school children in Tehran. Int Ophthalmol 1996; 20: 221–2. 6. Rahman SA, Singh PN, Nanda PK. Comparison of the incidence of colour blindness between sections of Libyan and Indian populations. Indian J Physiol Pharmacol 1998; 42: 271–5. 7. Al-Aqtum MT, Al-Qawasmeh MH. Prevalence of colour blindness in young Jordanians. Ophthalmologica 2001; 215: 39–42. 8. Osuobeni EP. Prevalence of congenital red-green colour vision defects in Arab boys from Riyadh, Saudi Arabia. Ophthalmic Epidemiol 1996; 3: 167–70. 9. Mahajan OP, Gogna RS. Study of colour blindness in school children. Indian J Physiol Pharmacol 1977; 21: 59–61. 10. Kim HB, Lee SY, Choe JK, Lee JH, Ahn BH. The incidence of congenital colour deficiency amongst Koreans. J Korean Med Sci 1989; 4: 117–20. 11. Adam A, Puenpatom M, Davivongs V, Wangspa S. Anomaloscopic diagnosis of red-green blindness amongst Thais and Chinese. Hum Hered 1969; 19: 509–13. 12. Cosstick M, Robaei D, Rose K, Rochtchina E, Mitchell P. Numerical confusion in ishihara testing: findings from a population-based study. Am J Ophthalmol 2005; 140: 154–6. 13. Cobb SR. One a possible explanation of the unusually high rates of colour vision defects in some west of Scotland primary schools. Med Hypotheses 1984; 14: 127–30. 14. Gundogan FC, Altinsoy HI. Congenital colour blindness in young Turkish men. Ophthalmic Epidemiol 2007; 14: 98. 15. Birch J, McKeever LM. Survey of accuracy of new pseudoisochromatic plates. Ophthalmic Physiol Opt 1993; 13: 35–40. 16. Birch J. Efficiency of the Ishihara test for identifying red-green colour deficiency. Ophthal Physiol Opt 1997; 17: 403–8.
© 2008 The Authors Journal compilation © 2008 Royal Australian and New Zealand College of Ophthalmologists