122
IEEE SIGNAL PROCESSING LETTERS, VOL. 21, NO. 1, JANUARY 2014
Referenceless Measure of Blocking Artifacts by Tchebichef Kernel Analysis Leida Li, Hancheng Zhu, Gaobo Yang, and Jiansheng Qian
Abstract—This letter presents a Referenceless quality Measure of Blocking artifacts (RMB) using Tchebichef moments. It is based on the observation that Tchebichef kernels with different orders have varying abilities to capture blockiness. In a block manner, high-odd-order moments are computed to score the blocking artifacts. The blockiness scores are further weighted to incorporate the characteristic of Human Visual System (HVS), which is achieved by classifying the blocks into smooth and textured. Experimental results and comparisons demonstrate the advantage of the proposed method. Index Terms—Blocking artifact, image quality assessment, Tchebichef moment.
I. INTRODUCTION
I
MAGES are inevitably subject to degradations during their acquisition and processing. Image quality assessment (IQA) evaluates the quality of an image quantitatively. The current IQA methods can be classified into full-reference (FR), reduced-reference (RR) and no-reference (NR) metrics [1]. In practice, NR metrics are more demanding, because a reference image is not always available. Blocking artifacts are mainly caused by block-DCT based image compression. Wang et al. modeled the blocky image as a non-blocky image interfered with a blocky signal [2]. Blockiness was measured by estimating the power of the blocky signal. Bovik et al. modeled the blocking artifact as a step function and the blockiness score was obtained by estimating its magnitude [3]. In [4], blockiness was estimated as the average differences across block boundaries. Activity of the image was then incorporated to generate the quality score. Perra et al. adopted Sobel operator to extract the edge map, and they measured the blockiness by luminance variations [5]. In [6], blockiness was measured using the edge direction histogram. Liu et al. calculated the blockiness by estimating local-pixel based distortion, combined with a simplified visual masking model [7]. In [8], the
difference image was computed, normalized and averaged, producing a one-dimensional signal. Then Fourier transform was adopted to analyze the periodic peaks. In [9], the boundaries with blocking artifacts were detected using the pixel gradient values on both sides of the block boundary. The quality score was computed as log of average strength of blockiness over the entire image. If blocking artifacts occur, the intensity changes abruptly across the block boundary and the same pixel value usually spans along the entire boundary [9]. We find that Tchebichef kernels with different orders have varying abilities to capture the blockiness. Based on the observation, we propose a Referenceless Measure of Blocking artifacts (RMB) using Tchebichef moments. The characteristic of human eyes is also incorporated in the weighting stage. The simulation results demonstrate that RMB outperforms the existing metrics. II. TCHEBICHEF KERNEL ANALYSIS A. Tchebichef Moment The th order, N-point Tchebichef kernel is defined as [10]:
(1) These kernels satisfy the following orthogonal condition: (2) . The computation of with , Tchebichef moments for an image : is based on a set of scaled Tchebichef kernels (3) where
Manuscript received June 05, 2013; revised September 07, 2013; accepted December 04, 2013. Date of publication December 06, 2013; date of current version December 18, 2013. This work was supported by National Natural Science Foundation of China under Grants 61379143, 51204175 and U1261105, and by the Fundamental Research Funds for the Central Universities under Grant 2012QNA59. The associate editor coordinating the review of this manuscript and approving it for publication was Prof. Kyoung Mu Lee. L. Li, H. Zhu and J. Qian are with School of Information and Electrical Engineering, China University of Mining and Technology, Xuzhou 221116, China (e-mail:
[email protected]). G. Yang is with School of Information Science and Engineering, Hunan University, Changsha 410082, China (e-mail:
[email protected]). Color versions of one or more of the figures in this paper are available online at http://ieeexplore.ieee.org. Digital Object Identifier 10.1109/LSP.2013.2294333
, and (4)
with
The Tchebichef moments up to the ( tained by matrix multiplications:
1070-9908 © 2013 IEEE
)th order can be ob-
(5)
LI et al.: REFERENCELESS MEASURE OF BLOCKING ARTIFACTS BY TCHEBICHEF KERNEL ANALYSIS
123
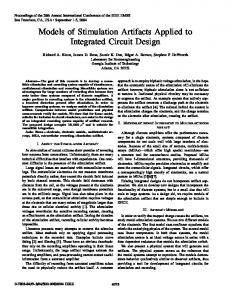
Fig. 2. Blocks with ideal, nonideal, no blockiness and ratios of the summation of absolute 7th order moments to the summation of absolute all non-DC moments. (a) Ideal. (b) Nonideal. (c) No.
Fig. 1. Plot of the scaled Tchebichef kernels for
.
where denotes the transpose, is the moment matrix, and are matrices defined by the image block.
is (6)
B. Kernel Analysis The Tchebichef moments with different orders have varying abilities to capture the blockiness. This can be known from the characteristics of the kernels. In fact, the scaled Tchebichef kernels satisfy the following symmetry property [10]: (7) Fig. 1 shows the scaled Tchebichef kernels up to the fifth order for . It is easily known that is odd symmetric with if the order is odd. Similarly, it is respect to even symmetric if is even. For an ideal blocking artifact, a constant pixel value usually spans along the entire block boundary. According to the symmetry property, it is easy to know that in Eq. (5) the odd order (for vertical boundary) or (for horicomponents of zontal boundary) are equal to zero. Therefore, the corresponding odd order moments are all zeros. By comparison, the moments deviate from zero greatly for a block without blockiness. As a result, odd order moments can capture the ideal blocking artifacts. In practice, the blocking artifacts may not be ideal, so the odd order moments are not exactly equal to zero. In order to capture the blocking artifacts better, high order moments can be used. This is because high order moments can capture more high frequency components of an image [10], and blocking artifacts are typically high frequency information. image blocks extracted from the Fig. 2 shows three “womanhat” image in LIVE database [12], and the ratios of the summation of absolute 7th order moment values to the summation of absolute all non-DC moment values (Eq. (11) in Section III.B). It is observed that for ideal blockiness the ratio is zero. Nonideal blockiness has bigger value and the block without blockiness produces the biggest value. Therefore, high-odd-order moments can capture the blocking artifacts.
blocks, the target block ( ) covers the right half the left block ( ) and left half of the right block ( ). Similarly, the vertical target block covers the bottom half of the upper block ( ) and upper half of the bottom block ( ). The size of all blocks is . Human eyes are more sensitive to the blocking artifacts in smooth areas. Therefore, it is reasonable to classify the target blocks into smooth and textured, and assign different weights. In this work, block classification is achieved using the sum of square of all non-DC moment values (SSM) [11]: (8) , is emwhere is a block, is its mean. A threshold, , the block ployed to perform the classification. If is classified as smooth, otherwise textured. In this letter, classification of a target block is based on its adjacent coding block. The reason is that when there is a block artifact, even a smooth block may produce high SSM value and lead to misclassification. In implementation, a target block is classified as smooth/ textured if its left ( ) or upper ( ) coding block is classified as smooth/textured. Given an image, the number of smooth , and that of textured blocks is denoted blocks is denoted by . by B. Blocking Artifact Score For a target block, the Tchebichef moments up to the ( order are first computed: .. .
..
.
.. .
)th
(9)
Since the block size is , the highest order of the moment ). The blocking artifact scores in horizontal and is 14 ( vertical directions are defined by (10)
(11)
III. BLOCKING ARTIFACT MEASURE A. Target Block Classification In JPEG compression, the blocks are quantized independently, so blocking artifacts occur at the block boundaries. To evaluate the blockiness, target blocks covering these boundaries should be determined. For two horizontally adjacent coding
and , where is index of the target block. The smaller the heavier the blocking artifacts. The reason is that for heavier blocking artifacts, the numerator is smaller. For ideal blocking artifacts, the numerator is exactly zero. Another characteristic of Human Visual System (HVS) should be considered, namely human eyes are only sensitive to
124
IEEE SIGNAL PROCESSING LETTERS, VOL. 21, NO. 1, JANUARY 2014
visible blocking artifacts. As a result, a threshold is adopted to process the initial blockiness scores: (12) where , is the blockiness visibility threshold. A weighted sum is then calculated to obtain the overall blockiness scores in horizontal and vertical directions: (13) (14) (0, 1), and . The blocking artifact where score for the whole image is then obtained by (15)
Fig. 3. Scatter plot between DMOS and predicted scores on LIVE database. TABLE I COMPARISONS OF CC, RMSE AND SROCC ON LIVE DATABASE
Finally, a logarithmic function is employed to map the quality score to the range (0, 1): (16) A small score indicates that the image is heavily contaminated by blocking artifacts, while a high score corresponds to an image free of blocking artifacts. IV. EXPERIMENTAL RESULTS A. Experiment Setup The performance of our method is evaluated on JPEG images from four databases, including LIVE [12], MICT [13], IVC [14] and CSIQ [15]. The block classification threshold is , and the blockiness visibility threshold is . The . The classification optimal weights are set to threshold is determined based on literature [11]. In [11], with set to 4000, 300 image blocks are classified into plane, edge and texture with promising results. In this letter, the blocks are classified into smooth and textured, a higher threshold is adopted so that smooth blocks can be steadily obtained. The visibility threshold and the optimal weights are determined by experiments. To evaluate the overall performance of the proposed method, Pearson linear correlation coefficient (CC) and root-mean-square error (RMSE) are used to evaluate the prediction accuracy, while Spearman rank-order correlation coefficient (SROCC) is used to evaluate the prediction monotonicity. These criterions are computed between the predicted scores and the subjective scores, where nonlinear fitting is first conducted to bring them on the same scale [16]. For comparison, the results of eight popular no-reference blocking artifact metrics are also provided, i.e., algorithms [2] to [9]. B. Performance Evaluation Fig. 3 shows the nonlinearly fitted curve between the subjective scores and the predicted scores on LIVE database, where the subjective scores are measured using the Difference Mean Opinion Score (DMOS). It is clear that the predicted scores are highly correlated with the subjective ratings.
Based on the nonlinear fitting, CC, RMSE and SROCC are computed. Table I lists the experimental results on LIVE database. It is clear that RMB performs better than all the compared methods, in terms of all three criterions. The performances of Bovik’s, Wang’s [4], Liu’s, Chen’s and Lee’s metrics are competitive, and they outperform Wang’s [2], Perra’s and Pan’s metrics. In order to evaluate the statistical significance of each metric’s performance relative to RMB, F-test is performed on the prediction errors between the predicted scores and subjective scores [16]. Since F-test is performed on the prediction errors, it can be used to judge if a compared metric has statistically larger (or smaller) prediction error than RMB. The F-score between a compared metric and RMB is defined as: (17) where denotes the variance of the prediction errors between the subjective scores and the quality scores predicted by a comdenotes the variance of the prediction errors pared metric, between the subjective scores and the quality scores predicted by RMB. Fig. 4 shows the results of F statistics. The variance of the predicted errors of RMB is smaller than those of all compared methods. Table II lists the simulation results on other three databases, where the two best results are marked in boldface. Wang’s method [4] and RMB rank the top two for all databases. For MICT and CSIQ, they perform competitively. For IVC, Wang’s method [4] performs better. Except for Wang’s method [4], our method outperforms the other seven metrics, indicating that the results are very satisfactory. Finally, a summary of the statistical performance of each metric relative to RMB is listed in Table III. This is obtained
LI et al.: REFERENCELESS MEASURE OF BLOCKING ARTIFACTS BY TCHEBICHEF KERNEL ANALYSIS
125
It is known from Table III that RMB performs statistically the best in LIVE databases. In MICT, Bovik’s, Wang’s [4] and RMB perform statistically competitive, and they outperform the other metrics. In IVC, four methods are competitive to RMB. In CSIQ, Wang’s [4] and Lee’s methods perform statistically competitive to RMB. To sum up, the statistical performance of RMB is the best, followed by Wang’s [4], Bovik’s and Lee’s methods. V. CONCLUSION Fig. 4. F statistics of the compared metrics against RMB on LIVE. TABLE II SIMULATION RESULTS ON MICT, IVC AND CSIQ
Orthogonal moments are effective in image analysis. We find that high-odd-order Tchebichef kernels can capture the blocking artifacts in images. Based on this observation, we propose a no-reference quality metric of blocking artifact. The characteristics of HVS are also incorporated in the weighting stage. Extensive experiments demonstrate that the proposed method outperforms state-of-the-arts. REFERENCES
TABLE III SUMMARY OF THE PERFORMANCE BETWEEN RMB AND OTHER METRICS
1, RMB Performs Statistically Better;–, RMB Performs Statistically Competitive.
by comparing F-score with a threshold ( ), which is determined based on the number of predicted errors and a ( ), RMB confidence level. If performs statistically better (statistically worse). In this study, the confidence level is 99%.
[1] W. S. Lin and C. C. Jay Kuo, “Perceptual visual quality metrics: A survey,” J. Vis. Commun. Image R., vol. 22, no. 4, pp. 297–312, May 2011. [2] Z. Wang, A. C. Bovik, and B. L. Evans, “Blind measurement of blocking artifacts in images,” in Proc. IEEE Int. Conf. Image Processing, Sep. 2000, pp. 981–984. [3] A. C. Bovik and S. Z. Liu, “DCT domain blind measurement of blocking artifacts in DCT-coded images,” in Proc. IEEE Int. Conf. Acoustics, Speech, and Signal Processing, May 2001, pp. 1725–1728. [4] Z. Wang, H. R. Sheikh, and A. C. Bovik, “No-reference perceptual quality assessment of JPEG compressed images,” in Proc. IEEE Int. Conf. Image Processing, Sep. 2002, pp. 477–480. [5] C. Perra, F. Massidda, and D. D. Giusto, “Image blockiness evaluation based on Sobel operator,” in Proc. IEEE Int. Conf. Image Processing, Sep. 2005, pp. 389–392. [6] F. Pan, X. Lin, S. Rahardja, E. P. Ong, and W. S. Lin, “Using edge direction information for measuring blocking artifacts of images,” Multidimen. Syst. Sign. P., vol. 18, no. 4, pp. 297–308, Dec. 2007. [7] H. T. Liu and I. Heynderickx, “A perceptually relevant no-reference blockiness metric based on local image characteristics,” EURASIP J. Adv. Signal Process., vol. 2009, pp. 1–14, 2009, Article ID: 263540. [8] C. H. Chen and J. A. Bloom, “Image blockiness evaluation based on Sobel operator,” in Proc. Pacific-Rim Conf. Advances in Multimedia Information Processing, 2010, pp. 112–123. [9] S. W. Lee and S. J. Park, “A new image quality assessment method to detect and measure strength of blocking artifacts,” Signal Process. -Image, vol. 27, no. 1, pp. 31–38, Jan. 2012. [10] R. Mukundan, S. H. Ong, and P. A. Lee, “Image analysis by Tchebichef moments,” IEEE T. Image Process., vol. 10, no. 9, pp. 1357–1364, 2001. [11] K. H. Thung, R. Paramesran, and C. L. Lim, “Content-based image quality metric using similarity measure of moment vectors,” Pattern Recognit., vol. 45, no. 6, pp. 2193–2204, Jun. 2012. [12] H. R. Sheikh, K. Seshadrinathan, A. K. Moorthy, Z. Wang, A. C. Bovik, and L. K. Cormack, Image and Video Quality Assessment Research at LIVE 2004 [Online]. Available: http://live.ece.utexas.edu/research/ quality [13] Y. Horita, K. Shibata, Y. Kawayoke, and Z. M. P. Sazzad, MICT: Image Quality Evaluation Database 2000 [Online]. Available: http:// mict.eng.u-toyama.ac.jp/mict/index2.html [14] A. Ninassi, P. Le Callet, and F. Autrusseau, Subjective Quality Assessment IVC Database 2005 [Online]. Available: http://www2.irccyn.ecnantes.fr/ivcdb [15] C. Larson and D. M. Chandler, Categorical Image Quality (CSIQ) Database 2009 [Online]. Available: http://vision.okstate.edu/csiq [16] D. M. Chandler and S. S. Hemami, “VSNR: A wavelet-based visual signal-to-noise ratio for natural images,” IEEE Trans. Image Process., vol. 16, no. 9, pp. 2284–2298, Sep. 2007.