Reverse Engineering of Dependency Graphs via ... - Semantic Scholar
Recommend Documents
The system dependency graph (SDG) for program P is a directed graph .... Analysis. Program. Source Code. Data Dependencies. Slicing. SDG. Construction.
such as Lotus 1-2-3 and Microsoft Excel also offer macro languages for ... Similarly, Lotus is planning a cross-application scripting language for their product.
Feb 18, 2002 - that underlie the file structures are mainly procedure- independent ... attempting to recover the implicit constructs, i.e., the data properties that ...
Feb 18, 2002 - Even if reverse engineering the data structure is easier ... schema programs physical schema conceptual schema. DDL code analysis. Raw.
Nov 23, 2012 - From a procedural point of view, Sentiment Analysis can be done at different ... poses. This could be done by Data Visualization techniques which .... using a propagation coefficient alpha=0.3, the term good, that has an initial ...
Position paper for Workshop on Empirical Studies in Reverse Engineering within STEP 2005. - 1 / 4 -. Characterization of Reverse Engineering Experiment ...
Aug 6, 2014 - Now we apply the model of uncertain adjacency matrix to the analysis of RandWalk [10]. ... is equivalent to computations in lines 2-6 and Q + QT is equivalent to ..... implemented in Python and run on a desktop PC with Intel®.
provides a single HTML table of all spending data ordered by the name of the ... 1Personal email communication with Friedrich Lindenberg (pudo.org). CREATE ...
Portability of a User Interface (UI) generally refers to the capability of a UI to be ported from one computing platform to another with an effort that remains minimal.
C, the Django web framework, written in Python, and the. Hadoop distributed .... wrapper, removes old code, refines the API, and improves the efficiency and ...
Reverse engineering chemical structures from molecular descriptors: how many ...... (1982) 463. 6. Tong, W., Lowis, D.R., Perkins, R., Chen, Y., Welsh, W.J.,.
The hydrogen Lyman-α (Lyα) line, a major source of ionization of metals in the ... disks of pre-main sequence (PMS) stars, is usually not observed due to ...
Dec 5, 2013 - Engineering the Neuroblastoma Regulatory Network Uncovers MAX as One of .... Given that the MYC/MAX/MAD network may regulate up to.
294-1279; E-mail: [email protected]. Journal of ... structures matching signature fragments of various sizes. .... solutions correspond to all possible molecular.
they maintain a great amount of valuable business data and their functionality is often critical for ..... Design recovery of legacy database applications based on.
allows software engineers to compare alternative architectural designs for a given ... sides, the reverse engineered models help understanding a soft- ware architecture in .... which covers a store from its cash desk line to the central enterprise ..
Keywords. WebML, Reverse Engineering, Web Applications, ASP.NET ..... application programmer is notified to either delete the link from the specific page or ...
method is used to evaluate interactions between genes in the SOS signaling ... gene regulatory network, DNA microarray, differential evolution, SOS DNA.
Abstract. Understanding the behaviour of distributed applications is a very challenging task, due .... Our work centers around the development of tools to derive.
Austin, TX 78759-2200 ... design decisions made during system development. .... The first one is the development of software by stepwise refinement introducing ...
Jul 13, 2006 - of graphs f : G â L where the graph L is a collection of loops at a single vertex (but it .... We reprise some of the basic notions we shall need.
software system, usually drive such changes. In fact, the ... usually task driven and can sometimes be hard to predict in advance. Software .... Every method aimed at recovering knowledge about an existing software system in support to the ..... In o
Jun 21, 2014 - take down Citadel command-and-control servers. .... System calls are monitored, malware activities ... th
Web site reverse engineering with the intent to raise aware- ..... Utah Lighthouse Ministry, the owners of a Web site host- ...... Best practices for avoiding linking.
Reverse Engineering of Dependency Graphs via ... - Semantic Scholar
Sep 13, 2011 - niquesâDistributed/Internet based software engineering tools and techniques ... Keywords. Reverse engineering, Monitoring, Dynamic analysis, Depen- ... republish, to post on servers or to redistribute to lists, requires prior specific permission ... Conference (IEEE INMIC 2008), pages 373â378. IEEE,. 2008 ...
Reverse Engineering of Dependency Graphs via Dynamic Analysis [Invited talk] Wilhelm Hasselbring
University of Kiel Institute of Computer Science Software Engineering Group D-24118 Kiel, Germany
[email protected] ABSTRACT Reverse engineering of software systems often employs static analysis of a program’s source code. In this invited talk, I will present our approach to reverse engineering of software systems via analyzing monitoring data of a programs operational use; thus, via dynamic analysis. Our Kieker monitoring framework generates dependency graphs from observed monitoring data. It is used in several industrial cooperations on which I’ll report.
Categories and Subject Descriptors D.2.2 [Software Engineering]: Design Tools and Techniques—Distributed/Internet based software engineering tools and techniques; D.2.7 [Software Engineering]: Distribution, Maintenance, and Enhancement—Restructuring, reverse engineering, and reengineering; D.2.8 [Software Engineering]: Metrics/Measurement—Performance measures; D.3.3 [Programming Languages]: Language Constructs and Features—Frameworks; D.4.8 [Operating Systems]: Performance—Measurements Monitors; H.4 [Information Systems Applications]: Miscellaneous
DYNAMIC ANALYSIS WITH THE KIEKER MONITORING FRAMEWORK
The object-oriented Kieker monitoring framework has been designed for continuous monitoring of software systems. The
Permission to make digital or hard copies of all or part of this work for personal or classroom use is granted without fee provided that copies are not made or distributed for profit or commercial advantage and that copies bear this notice and the full citation on the first page. To copy otherwise, to republish, to post on servers or to redistribute to lists, requires prior specific permission and/or a fee. ECSA’11 Workshop TDSA’11, September 13, 2011, Essen, Germany Copyright 2011 ACM ISBN 978-1-4503-0618-8/11/09 ...$10.00.
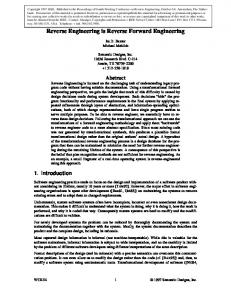
framework components for software instrumentation, logging, and analysis/visualization are extensible and may easily be replaced to fulfill the requirements of specific project contexts. For instance, as a non-intrusive instrumentation technique, we employ aspect-oriented programming (AOP). Kieker uses a common data structure for monitoring records in all components that produce or consume monitoring data. For analysis of monitoring data, Kieker provides several visualizations of a system’s runtime behavior, such as UML sequence diagrams, and dependency graphs. These models are extracted from recorded application-internal traces originating from system-provided services. The analysis may be performed online or offline. Kieker supports distributed request tracing, since the service-providing components of large-scale software systems are usually distributed across several execution containers on physical or virtual server nodes. In our research, we employ Kieker for various purposes, e.g., fault localization based on timing behavior anomaly detection [3], architecture-based runtime adaptation / reconfiguration [8, 4], visualization of software runtime behavior [7], application-level intrusion detection [2], and tracebased performance analysis [5, 6]. Kieker is structured into the two main components Kieker.Monitoring and Kieker.Analysis with the Monitoring Log in between, as illustrated in Figure 1. Kieker.Monitoring provides a reusable infrastructure for collecting application-level monitoring data in Monitoring Probes and writing this monitoring data to the Monitoring Log, e.g., the local file system, a database, or a messaging queue, using a Monitoring Log Writer. The Monitoring Controller is responsible for initializing and controlling a Kieker.Monitoring instance. The Monitoring Log contains Monitoring Records, each holding the monitoring data of a single measurement created by the Monitoring Probes. Kieker.Analysis provides the infrastructure for analyzing the Monitoring Log: a Monitoring Log Reader (Figure 1) reads Monitoring Records from the Monitoring Log and delivers these to registered Monitoring Record Consumers, according to the observer design pattern [1]. Monitoring Record Consumers perform the actual analysis or visualization functionality. A Kieker.Analysis instance is initialized and controlled by an Analysis Controller instance (Figure 1). Figure 2 shows an example dependency graph generated by Kieker.TraceAnalysis, visualizing calling dependencies among classes and their operations. This figure provides an ag-
Figure 2: Generated deployment-level operation dependency graph gregated view of the runtime dependencies as observed in 1635 traces. Kieker is open-source software. For more information on Kieker, please refer to http://kieker.sourceforge.net/
2.
REFERENCES
[1] E. Gamma, R. Helm, R. Johnson, and J. Vlissides. Design Patterns – Elements of Reusable Object-Oriented Software. Addison-Wesley, 1995. [2] I. A. Gul, N. Sommer, M. Rohr, A. van Hoorn, and W. Hasselbring. Evaluation of control flow traces in software applications for intrusion detection. In Proceedings of the 12th IEEE International Multitopic Conference (IEEE INMIC 2008), pages 373–378. IEEE, 2008. [3] N. S. Marwede, M. Rohr, A. van Hoorn, and W. Hasselbring. Automatic failure diagnosis support in distributed large-scale software systems based on timing behavior anomaly correlation. In Proceedings of the 13th European Conference on Software Maintenance and Reengineering (CSMR 2009), pages 47–57. IEEE Computer Society, Mar. 2009. [4] J. Matevska and W. Hasselbring. A scenario-based approach to increasing service availability at runtime reconfiguration of component-based systems. In Proceedings of 33rd Euromicro Conference on Software Engineering and Advanced Applications (SEAA), pages 137–144. IEEE Computer Society, Aug. 2007.
[5] M. Rohr, A. van Hoorn, S. Giesecke, J. Matevska, W. Hasselbring, and S. Alekseev. Trace-context sensitive performance profiling for enterprise software applications. In Proceedings of the SPEC International Performance Evaluation Workshop 2008 (SIPEW ’08), volume 5119 of Lecture Notes in Computer Science, pages 283–302. Springer, June 2008. [6] M. Rohr, A. van Hoorn, W. Hasselbring, M. L¨ ubcke, and S. Alekseev. Workload-intensity-sensitive timing behavior analysis for distributed multi-user software systems. In 1st Joint WOSP/SIPEW International Conference on Performance Engineering (WOSP/SIPEW 2010). ACM, Jan. 2010. To appear. [7] M. Rohr, A. van Hoorn, J. Matevska, N. Sommer, L. St¨ over, S. Giesecke, and W. Hasselbring. Kieker: Continuous monitoring and on demand visualization of Java software behavior. In Proceedings of the IASTED International Conference on Software Engineering 2008 (SE 2008), pages 80–85. ACTA Press, Feb. 2008. [8] A. van Hoorn, M. Rohr, A. Gul, and W. Hasselbring. An adaptation framework enabling resource-efficient operation of software systems. In Proceedings of the 2nd Warm-Up Workshop for ACM/IEEE ICSE 2010 (WUP ’09), pages 41–44. ACM, Apr. 2009.