RNAV: NON-CODING RNA SECONDARY STRUCTURE VARIATION SEARCH VIA GRAPH HOMOMORPHISM Zhibin Huang* Department of Computer Science, University of Georgia Athens, GA 30602, U.S.A. * Email:
[email protected] Russell L. Malmberg Institute of Bioinformatics, Department of Plant Biology, University of Georgia Athens, GA 30602, U.S.A. Mohammad Mohebbi Department of Computer Science, University of Georgia Athens, GA 30602, U.S.A. Liming Cai* Department of Computer Science, Institute of Bioinformatics, University of Georgia Athens, GA 30602, U.S.A. * Email:
[email protected] Non-coding RNA (ncRNA) secondary structural homologs can be detected effectively in genomes with profile-based search methods. However, due to the lack of appropriate ncRNA structural evolution models, it is difficult to accurately detect distant structural homologs, i.e., ncRNA structures with variations caused by evolutionary changes such as the insertion or deletion of a substantial portion in the structure. This paper presents results of an investigation toward developing a new framework for distant ncRNA structural homolog search. In this work, secondary structure conformations are modeled as graphs with small tree width and sequence-structure alignment for homolog detection is formulated as graph homomorphism. The technique of NULL stem is used to resolve the issue of optional stems that may be deleted from the structure profile or may be a misalignment. Test results on 51 benchmark data sets of Infernal (9 of them containing pseudoknots) show that a program based on these methods, RNAv, with the capability of detecting pseudoknots, has a comparable performance to the latest version of Infernal, and is better in detection of some distant homologs.
1. INTRODUCTION
benchmark ncRNA data sets with a high efficiency (Appendix, Table 1). However, the structural search tools have been most successful in identifying ncRNAs homologs with little or small structural variation. RNA secondary and tertiary structures are both constant and variable across evolution15,2,23; that is, some sub-structures, such as stem-loops, will be found in all members of a given ncRNA family, but other sub-structures will be found only in some of the sequences of the family. Such structural variation poses novel challenges in profiling distant homologs for effective searches23. In previous work18,19,25-27 RNA base and base pair evolution information was incorporated into SCFG models. To profile more substantial structural variations, usually these systems model variation with ribosomal RNA
Non-coding RNAs (ncRNA) are biologically important with functions in gene regulation, chromosome replication and RNA modification as well as other roles10,24,36. Homology-based searching 4,22,11,17,37,21,9 methods have become important for annotation of ncRNAs12,14,22,28,29,33. Genome search programs for ncRNA annotation have been developed22,17,21,9 based on the covariance model (CM), a type of stochastic context-free grammar (SCFG), introduced by Eddy and Durbin7. The CM can profile position-specific compensatory mutations between base pairs as well as base conservations, yielding accurate ncRNA-specific and reconfigurable structural homolog search tools. Typically, the latest version of Infernal9 can achieve more than 95% accuracy in recognizing 51
56
basepair evolution information due to the lack of more general, adequate structural evolution models. An improved model for RNA structural evolution has also been proposed15,3 which can deal with limited degree of structure rearrangement between homologs but has yet to be incorporated into a search program. The program, trCYK20, a local alignment algorithm for Infernal, contains a technical solution that addresses the issue of aligning the structural model with incomplete sequences. The scoring is based on conserved primary sequence and structure information instead of a structural evolution model. To date, a general method that addresses both possible misalignments and structural variation is still missing1. Searches for structurally distant homologs still largely rely on customized methods or tools2. The current paper reports preliminary results from our on-going effort in developing a profiling framework for effective search of ncRNA homologs that contain substantial structural variation. We profile the RNA secondary structure with the conformational graph model developed from a notion used in our previous work RNATOPS16. It is a coarse-grain model that profiles the relationships (i.e., stems and loops) with graph vertices and edges. The current work is different from the previous research, however, in both search targets and supporting techniques. In particular, to detect structurally distant homologs, we describe the structural variation with novel graph homomorphism rules that can define the deletion/insertion of stems and loops with homomorphic mapping between an ancestor and a descendent structure graphs. The homomorphism rules allow deletion of edges and vertices from the conformational graph, which was not permitted in our previous work with RNATOPS. The detection of the structural variation is accomplished with a new technique of NULL stem that identifies any stem with a high probability of being deleted in the evolution. Although the threshold for such (evolutionary) probabilities is still being determined in a related study32, the investigation of the graph homomorphic rules and implementation techniques is necessary because they are the mechanism to describe alternative and optional substructures, much the same role as context-free rules for CM7. We have tested on this new method to evaluate its capability to detect substructures (individual stems or
combinations) possibly removed in the evolution. Typically, each used data set is a collection of multiple RNA sequences with a structural alignment and consensus, in which some stems may present in some but not all involved sequences. We have chosen to use the 51 benchmark data sets used by Infernal9 in our tests. Although certain regions in these data sets are highly conserved, overall it exemplifies substantial structural variation. For example, we obtained (through calculations) 19.57 as the averaged standard deviation of the sequence lengths in these data sets. Totally there are 5686 training sequences in these 51 benchmark datasets, and 540 of them have at least one stem absent, accounting for 9.5% of the total number of sequences. Since Infernal performs well on these benchmarks, the evaluation on our method with comparison to Infernal is appropriate. We conducted tests based on filtering method and non-filtering method, and compared the search results based on different ratio threshold for the percentage of the hit region overlapping with the real RNA region.
2. METHOD We introduce a new method to profile RNA secondary structure variation for distant homolog search. It consists of three parts: the model to profile the consensus structure, rules for structural variation, and an algorithm to implement structure-sequence alignment and search. The model is based on the notion of conformational graph developed in our previous work to profile the consensus structure of multiple RNA sequences16,30,31, with additional elements convenient for the description of structural variation.
2.1. Conformational Graph The consensus secondary structure of RNA can be viewed as a topological relation among basic structural units, each of which is a stem or a loop. The structure model consists of two components: a weighted conformational graph that represents the relationship among all these basic structural units, and a set of simplified CMs and profile HMMs, each modeling a stem or a loop. In such a conformational graph H, each vertex represents a contiguous sequence segment, either a loop or one of the two half-stems. It is a mixed graph containing both directed and undirected edges. Each
57
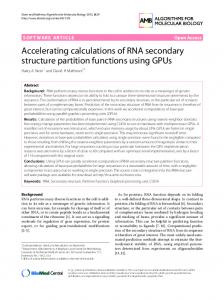
directed edge connects two neighboring sequence segments, i.e. one of base-pairing stem regions and one loop region, and each undirected edge connects two base-paired sequence segments that form a stem. Fig.1 shows one example of a pseudoknot structure and the corresponding conformational graph, H (Fig.1(a)). Searching in a target genome for a profiled structure consists of sliding a window of appropriate size along the target genome and aligning the structure model to a target sequence. Technically, the sequence segment within each window is preprocessed to identify the top k candidates for all CM models. Given the set of candidates of all profiled stems in the structure, a candidate graph can be constructed similarly to the construction of a conformational graph. Based on this construction, each vertex u in the conformation graph can only be mapped to a specific set of the same number of vertices in the candidate graph G, each of which is called a candidate of the vertex u.
2.2. Homomorphism Variation
for
maximum weighted subgraph that is homomorphic to the conformational graph. The weight is defined by the alignment score between vertices (stems and loops), in the conformational graph, and their counterparts, in the candidate graph. This graph homomorphism problem is an NP-hard problem13, but tree decomposition based dynamic programming allows achieving efficiency for the computation16. To handle structure variations, the deletions allowed on the profile graph H can be classified into the following two categories. (a) Deletion of a stem, which removes the base pairing between the two involved sequence segments. As shown in Fig.1(b), stem (3, 7) will be deleted from profile graph H. The homomorphic mapping merges vertex 3 (i.e., one arm of the stem), and its neighboring vertices, 2 and 4 (i.e., both loops), into one vertex, 3’(i.e. a loop). Similarly, it merges vertex 7, and its neighboring vertices, 6 and 8, into one vertex, 7’, in query sequence, Q. (b) Deletion of a substructure,consisting of more than one stem, e.g., a pesudoknot structure, by applying (a) repeatedly. As shown in Fig.1(c), the pseudoknot structure contains stem (3, 7) and stem (5, 9) and loop 4, 6 and 8. To delete this pseudoknot structure, the first step is to delete stem (3, 7), which is to merge vertices 2, 3, 4 into vertex 3’ and to merge vertices 6, 7, 8 into vertex 7’. The second step is to delete stem (5, 9), which is to merge 3’, 5, 7’ into vertex 5’ and merge vertices 9, 10 into vertex 9’ since 7’ has been used. The homomorphism used in this work is somewhat non-standard, as all operations need to meet the standard definition of graph homomorphism on vertices representing base-pairing regions only and not for vertices representing loops. In particular, edge preserving properties through homomorphism only apply to edges formed between vertices that represent base pairing regions and contribute to stems.
Structural
(a) A pseudoknot structure and the corresponding conformational graph, H
(b) Graph homomorphism from H to query sequence, Q, which deletes stem(3, 7) from H.
2.3. Structure-Sequence Alignment An alignment between a structure profile and a target sequence is essentially a homomorphism between the conformational graph H for the structure profile and some subgraph of the candidate graph G constructed from the target sequence. Generally, RNAv follows the basic idea of tree decomposition-based dynamic programming to compute the optimal alignment between graph H and the subgraph of G16. To consider structural
(c) Graph homomorphism from H to query sequence, Q, which deletes one pseudoknot structure stem(3, 7)&stem(5, 9) from H.
Fig. 1. Graph homomorphism from H to query sequence Q.
The optimal structure-sequence alignment between the structure model and the target sequence thus corresponds to finding, in the candidate graph, a
58
variation, one special stem candidate, NULL stem, will be added to the candidates of every stem model in the profile. For each tree node, the algorithm examines all possible combinations of the candidates including the NULL stem candidate, from the number 0 to the number max_NULL_stem, in the tree node (where max_NULL_stem is the maximum number of NULL stems). Thus, the optimal alignment will consider all k+1 candidates for every stem in the tree decomposition based dynamic programming. For each tree node, the optimal alignment score and the number of NULL stems (which can be technically constrainted) will be saved. The final optimal alignment score will be obtained in the tree root and a recursive process can be applied to trace back the optimal alignment. In this way, RNAv places a limit to the maximum number of NULL stems, max_NULL_stem, making it possible to identify from the target genome to RNAs conforming to the profiled structure but with possible structural variation from the consensus.
for structure on incomplete query sequence, and RNATOPS is an earlier version of our program that allows little and small structural variation. This section will evaluate the performance of RNAv using Infernal’s performance as a reference. Due to page limitation, we have to move some of tables and figures to the appendix. We also created a webpage (http://www.cs.uga.edu/~zhibin/csb2010_RNAv_data.ht ml) containing all the tested data results for this paper.
3.1. Data preparation and Evaluation criteria Infernal’s benchmark datasets do not contain any sequence pair that is more than 60% identical8,9. Each data set is a multiple structure alignment including the annotation of the consensus structure. We used each data set as training data to construct a structure profile for search. For the purpose of testing the recognition capability, we designed the following leave-one-out, pseudo-genomic searches: we followed a crossvalidation approach and embedded each RNA sequence, which was removed from the training alignment, in the middle of a 2000-nucleotide-long random sequence, which shares the same nucleotide frequency as that RNA sequence. The remaining alignment sequences were used as the training set for a search on that pseudogenome. We applied both an HMM filtering method34, 35 (Infernal also uses QDB-filtering method8 and the nonfiltering method to the pseudo-genome test. There are two levels of search performance. The first level is to compare the predicted position of the tested RNA with its real position on the searched
3. EVALUATION The newly introduced methods have been implemented into the search program, RNAv, which has been tested in different gcc version 3.4.6, 4.2.1 and 4.4.1. We collected Infernal’s benchmark dataset (51 ncRNA families) from RFAM seed alignment database (release 9.1) and tested them on the following four programs: Infernal (1.0.2), trCYK (Infernal can be accessed from http://infernal.janelia.org/ and trCYK is one of Infernal’s functions), RNAv and RNATOPS, where trCYK is a new function of Infernal for local alignment to search
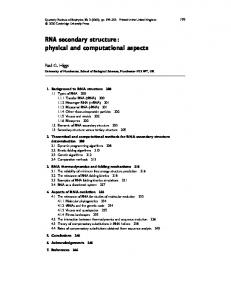
Fig. 3. Comparison of position prediction among Infernal, trCYK and RNAv.
59
genome. The second level is to compare the predicted structure with its real structure. For position comparison, we used the percentage ratio of overlap, between the real RNA sequence and the predicted one, with different thresholds (0.75, 0.8, 0.85, 0.9 and 0.95). Position performances of these search programs with these different thresholds are shown in Appendix-Fig. 2. In this section, we analyzed the results with the threshold of 0.85. In these 51 datasets, 9 of them contain pseudoknots. Since Infernal does not explicitly predict pseudoknot structures, we remove the crossing stems from those pseudoknot structures when testing them on Infernal and trCYK. On all programs, the top one hit candidate reported was taken as the prediction.
by Infernal. There are 10 such datasets, for which RNAv’s filtering search performance was better than Infernal and 7 datasets, for which RNAv’s non-filtering search performance is better than Infernal (we labeled these 17 dataset in bold font in Appendix-Table 1). Due to the page limitation, we picked 4 structure prediction typical cases to analyze: RF00023(Bacterial tmRNA) from the filtering-search test, and RF00024(Telomerasevert), RF00029(Intron_gpII) and RF00230(T-box), from the non-filtering-search test.
3.3.1. RF00023 Bacterial tmRNA RF00023, Bacterial tmRNA, has 228 training sequences, and the length of sequences in this alignment file ranges from 235 to 436, and its standard deviation is 26.35. We also calculated the pseudo-energy score for all the stems, and used the threshold of -4.0 to estimate, in the original alignment file, the number of good/NULL/weak stems (Appendix-Table 3). Test result (Appendix-Table 2) shows that, in this dataset, RNAv found all of stems, and Infernal missed 4 cases (with the index of sequence 98/212/219/225 in the alignment file). Checking the 4 cases Infernal missed revealed that most of interior stems in these 4 alignments are weak stems while the outer stems are good stems. We also calculated the number of NULL stem in the original alignment and candidate hit alignment (Appendix-Table 4, Table 5). There are 77 NULL stems in this RF00023 alignment file, and RNAv finds 30 of them. Actually RNAv detects 216 NULL stems, 30 of them are real NULL stem in the original alignment, and 186 of them were used to predict weak stems that are 100 in number (Here we used -4.0 as the threshold of pseudo-energy score to determine weak stems). For the other 47 real NULL stems, RNAv detected real stems for them and 25 of them are good stems. We show the
3.2. Position Search accuracy The search position accuracy comparisons between Infernal, trCYK and RNAv are shown in Fig. 3 and Appendix-Table 1. Infernal has the highest average position prediction performance, 97.51% using the filtering method and 97.67% in the non-filtering method. RNAv gets 93.70% in the filtering method and 93.73% in the non-filtering method, followed by trCYK, which gets the accuracy, 89.28%. However, in 10 datasets, RNAv’s filtering-search appears to perform better than Infernal and in 7 datasets its non-filtering-search performance is better than Infernal. We focus on analysis between the results of Infernal and of RNAv as trCYK, local motif search function, may not be entirely appropriate for detecting global structure with missing substructures.
3.3. Capability variation
to
detect
structural
We analyze the capability of RNAv in detecting structural variation by examining those cases that missed
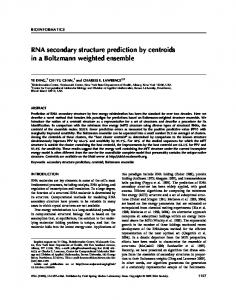
Fig. 4. Alignment of case-98 in the RF00023 dataset (x-axis is the position of nucleotide in the pseudogenome, arc with dash-line
means NULL stem. Same for all other figures).
60
Fig. 5. Alignment of RNAv’s result of case-98 in the RF00023 dataset, arc in red color means some difference from the original one. Same for all other figures.
test result of the 98th query sequence as an example to explain RNAv’s performance discussed here. In this case, RNAv detected stem N/L/E/M and NULL stem H correctly (Fig. 5); for stem A/B/C/I/D, actually in the original alignment these stems are very weak (Fig. 4), containing many non-canonical basepairings, and RNAv predicted the candidates with lower pseudo-energy score; for stem K/J/F/G, RNAv could not find the candidates for them and used NULL stems to represent these two stems (see Appendix-Tables 4 and 5).
from 382 to 559, and its standard deviation is 38.21. We also estimate, in the original alignment file, the number of good/NULL/weak stems (see Appendix-Table 6). Test result (Appendix-Table 2) shows that, in this dataset, RNAv missed 1 case, and Infernal missed 2 cases. We checked those missed cases of RNAv and Infernal. For the one missed case, RNAv only detected part of the whole structure correctly, resulting in the overlap region not large than 85%. For those two missed cases, Infernal detected local hit, 12.23% and 27.7% of the whole structure hit respectively. We compute the number of NULL stems in the original RF00024 alignment and candidate hit alignment (Appendix-Table 7, Table 8). Totally there are 26 NULL stems in this RF00024 alignment file, and RNAv finds 9 of them. The total number of NULL stems in the
3.3.2. RF00024 Telomerase-vert RF00024, Telomerase-vert, has 37 training sequences. The length of sequences in this alignment file ranges
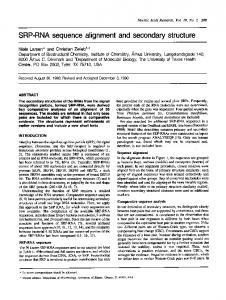
Fig. 6. Alignment of case-22 in the RF00024 dataset (x-axis is the position of nucleotide in the pseudogenome).
Fig. 7. Alignment of RNAv’s result of case-22 in the RF00024 dataset.
Fig. 8. Alignment of Infernal’s result of case-22 in the RF00024 dataset.
61
candidate hits are 66, and RNAv uses 57 NULL stems to replace weak stems and 9 of them are real weak stems. For example, in this test of the 22nd query sequence, there are total 17 stems and15 of them are real stems. RNAv found (Fig.7) those two NULL stems, Stem F/E correctly. For those 15 real stems, RNAv detected 12 of them correctly, and 3 of them mostly correct but with some nucleotides shifted. Infernal (Fig.8) found a candidate for Stem F/E, which was actually no sequence in the original alignment, and some nucleotides shifted in the candidate stem of K.
Fig. 10. Alignment of RNAv’s result of case-98 in the RF00029 dataset
3.3.3. RF00029 Intron_gpII RF00029, Intron_gpII, has 113 training sequences. The length of sequences in this alignment file ranges from 61 to 154, and its standard deviation is 22.03. We also estimate, in the original alignment file, the number of good/NULL/weak stems (Appendix-Table 9). Test result (Appendix-Table 2) shows that, in this dataset, RNAv missed 1 case, and Infernal missed 7 cases. We now use the test of the 98th query sequence as an example to explain the performance difference between RNAv and Infernal. We checked the original alignment file and found there was a special stem C that had a big sequence variation within its loop region. RNAv and Infernal both predicted the first two stems, Stem A/B, correctly. For the last stem, Stem C, RNAv found one candidate stem with a lower pseudo-energy score than the real one, while Infernal found one candidate stem with a higher pseudo-energy score (Fig.9, Fig.10, Fig.11). However, RNAv failed in the one with the largest sequence variation. Infernal only outputted local structure search results for those 7 missed cases.
Fig. 11. Alignment of Infernal’s result of case-98 in the RF00029 dataset
3.3.4. RF00230 T-box RF00230, T-box, has 65 training sequences. The length of sequences in this alignment file ranges from 167 to 370, and its standard deviation is 32.86. We also estimate, in the original alignment file, the number of good/NULL/weak stems (Appendix-Table 12). We checked the original alignment file and found there was a loop region, between Stem G and Stem H, which has a big sequence variation. RNAv missed 2 cases, outputting only local structure hits, so did Infernal in those missed 6 cases (Appendix-Table 2). Here we analyzed the test result with the 26th query sequence. In this test, RNAv found most of the real stems correctly, and found Stem E with both sides having a position shift, and used a NULL stem to replace Stem C, which actually had high pseudo-energy score in the original alignment file. Interestingly, RNAv and Infernal both found the same candidate for Stem H, which was different the one in the original alignment, but Infernal could not find Stem I.
Fig. 9. Alignment of case-98 in the RF00029 dataset (x-axis is the position of nucleotide in the pseudogenome)
Fig. 12. Alignment of case-26 in the RF00230 dataset (x-axis is the position of nucleotide in the pseudogenome)
62
technique make it possible to effectively detect substantial structure variation, typically stems missing in the structure because of evolution. Evident by the test results, the implemented program, RNAv, had comparable overall performance as Infernal on the 51 benchmark data sets selected and used for testing Infernal. RNAv was able to detect some structural variations that were missed by Infernal. Overall impression from the tests is that RNAv works for ncRNA search with diversed sequences while Infernal works with conserved ncRNA sequences. The comparison between RNAv with the earlier version RNATOPS shows an overall enhancement in performance, with more than 13% of accuracy improvement (Appendix, Fig. 2). The same table also shows the performance of trCYK, a new local alignment algorithm for Infernal that can locally aligns the structural model with incomplete sequences. Our result shows that local motif search techniques may not be entirely appropriate for detecting global structure with missing substructures. In addition to the capability of handling pseudoknots and the search efficiency inherited from RNATOPS16, there are a couple of more advantages demonstrated by RNAv. One is RNAv's capability to suppress some impact of noisy training data. Profilebased search algorithms can be inherently alignmentsensitive. If more than 50% of a stem alignment contains canonical base pairs and others are non-canonical base pairs, then the stem modeling based on this alignment will be correct. When this correct model is used to predict those non-canonical base pairs, the score of searched stem candidates will be insignificant. In this scenario, RNAv may use NULL stem as the predicted local structure when all possible stem candidates are “too weak” to be meanful. This explains the reason why Infernal missed those 4 cases with interior weak stems and outer good stems in Bacterial tmRNA data set while RNAv found them. Another interesting advantage of RNAv is its potential for detection of evolutionary structural changes. In testing the 51 data sets, RNAv was able to detect at least 34% or more regions with missing stems in each data set. These regions are presumably to have evolved to unpaired loop regions instead to base pairing stem regions or drastic mutations have caused stems in these regions to disappear. Therefore, RNAv may present as a technical solution to the issue of modeling
Fig. 13. Alignment of RNAv’s result of case-26 in the RF00230 dataset
Fig. 14. Alignment of Infernal’s result of case-26 in the RF00230 dataset
3.4. RNAv Vs. RNATOPS One of problems in RNATOPS is if heuristic preprocessing step does not include the real candidate of the stem in those k pairs of candidate regions for each individual stem, then it may fail16. Actually this was the original motivation of proposing NULL stem technique. We used RNATOPS to repeat RNAv’s filtering search test, and see how much improvement RNAv can make using NULL stem technique. Test result shows that RNAv can improve about 16% of accuracy in filtering method and 13% in non-filtering method.
3.5. Analysis of RNAv’s parameters There are two parameters in RNAv. One is k, the number of stem candidates; the other is max_NULL_stem, the maximum number of NULL stems. In general, the values of these parameters are determined by the training data. When sequences in the alignment are conserved, a small value for k can yield decent search accuracy and larger values for k may further improve/fine-tune search results. On the other hand, if the data manifest some significant structural variation, the search accuracy may not be substantially improved by simply increasing values for k; while parameter, max_NULL_stem, affects the search result.
4. DISCUSSION In this paper, we presented preliminary results from our on-going research in developing a new profiling framework for RNA secondary structure search for distant homologs. The new method profiles substantial structural variation with the conformational graph we previously developed; the newly introduced graph homomorphic mapping rules and the NULL stem
63
8.
stem evolution including insertion or deletion. One can apply RNAv to search for an ncRNA of interest across species, which may not be conserved in the structure, leading to the discovery of new members of the RNA, possibly in evolutionarily distant species. Graph homomorphic mapping appears to be powerful to account for ncRNAs structure evolution. Together with the structure evolution study35 on specific ncRNAs and the notion of graph homomorphic mapping to define stem insertion and deletion, RNAv and the underlying method will be further developed into an accurate solution to detecting distant structural homologs.
9.
10.
11.
12.
Acknowledgments 13.
This research project was supported in part by NIH BISTI R01GM072080-01A1 grant and NIH ARRA Administrative supplement to this grant. We also thank the authors of Infernal who have made their software packages publicly available to use. Conflict of Interest: none declared.
14.
15.
References 1.
2.
3.
4.
5.
6.
7.
Andreas R. Gruber, et al. 2010. Rnaz 2.0: Improved Noncoding Rna Detection, Pacific Symposium on Biocomputing 15:69-79. Axel Mosig. et al. (2009) Customized strategies for discovering distant ncRNA homologs, Briefings in Functional Genomics and Proteomics, doi:10.1093/bfgp/elp035. Bradley RK, Holmes I (2009) Evolutionary Triplet Models of Structured RNA. PLoS Comput Biol 5(8): e1000483. doi:10.1371/journal.pcbi.1000483. Brown,M and Wilson,C. (1996) RNA pseudoknot modeling using intersections of stochastic context free grammars with applications to database search. In Hunter,L. and Klein,T. (eds) Proceedings of Pacific Symposium on Biocomputing. World Scientific Publishing Co, Singapore. Cai,L. et al. (2003) Stochastic modeling of RNA pseudoknotted structures: a grammatical approach. Bioinformatics, 19 (Suppl. 1), i66–i73. Durbin,R. et al. (1998) Biological Sequence Analysis: Probabilistic Models of Proteins and Nucleic Acids. Cambridge University Press. Eddy,S.R. and Durbin,R. (1994) RNA sequence analysis using covariance models. Nucleic Acids Res., 22, 2079–2088.
16.
17.
18.
19.
20.
21.
22.
64
Eric P. Nawrocki and Sean R. Eddy. (2007) Querydependent banding (QDB) for faster RNA similarity searches. PLoS Comput. Biol., 3, e56. Eric P. Nawrocki, Diana L. Kolbe, and Sean R. Eddy, Infernal 1.0: inference of RNA alignments, Bioinformatics. 2009 May 15;25(10):1335-7. Frank,D.N. and Pace,N.R. 1998. Ribonuclease P: unity and diversity in a tRNA processing ribozyme. Annu. Rev. Biochem., 67, 153–180. Gautheret D., and A. Lambert. 2001. Direct RNA motif definition and identification from multiple sequence alignments using secondary structure profiles. J. Mol. Biol. 313:1003–1011. Griffiths-Jones,S. (2007) Annotating noncoding RNAgenes. Annu. Rev. Genomics Hum. Genet., 8, 279–298. Hell, Pavol; et al. (2004). Graphs and Homomorphisms (Oxford Lecture Series in Mathematics and Its Applications). Oxford University Press. Hofacker,I.L. (2006) RNAs everywhere: geonomwide annotation of structured RNAs. Genome Inform., 17, 281–282. Holmes I: A probabilistic model for the evolution of RNA structure. BMC Bioinformatics 2004, 5:166. Huang, Z., Y. Wu, J. Robertson, L. Feng, R. Malmberg, and L. Cai. 2008. Fast and accurate search for non-coding rna pseudoknot structures in genomes. Bioinformatics. 24:2281–2287. Klein,R.J. and Eddy,S.R. (2003) RSEARCH: finding homologs of single structured RNA sequences. BMC Bioinformatics, 4, 44. Knudsen B, Hein J (1999) RNA secondary structure prediction using stochastic context-free grammars and evolutionary history. Bioinformatics 15: 446–454. Knudsen B, Hein J (2003) Pfold: RNA secondary structure prediction using stochastic context-free grammars. Nucleic Acids Res 31: 3423–3428. Kolbe DL, Eddy SR, Local RNA structure alignment with incomplete sequence, Bioinformatics, 25(10):1236-1243, 2009. Liu,C. et al. (2006) Efficient annotation of noncoding RNA structures including pseudoknots via automated filters, In Proceedings of Life Science Society Computational Systems Biology Conference (CSB 2006). Imperial College Press, London, pp. 99–110. Lowe,T.M. and Eddy,S.R. (1997) tRNAscan-SE: a program for improved detection of transfer RNA
23.
24.
25.
26.
27.
28.
29.
genes in genomic sequence. Nucleic Acids Res., 25, 955–964. Menzel P, Gorodkin J, Stadler PF. (2009) The tedious task of finding homologous non-coding RNA genes. RNA, 15(12):2075-2082, 2009. Nguyen,V.T. et al. (2001) 7SK small nuclear RNA binds to and inhibits the activity of CDK9/cyclin T complexes. Nature, 414, 322–325. Pedersen JS, Meyer IM, Forsberg R, Simmonds P, Hein J (2004a) A comparative method for finding and folding RNA secondary structures within protein-coding regions. Nucleic Acids Res 32: 4925–4936. Pedersen JS, Forsberg R, Meyer IM, Hein J (2004b) An evolutionary model for protein-coding regions with conserved RNA structure. Mol Biol Evol 21: 1913–1922. Pedersen, J.S., Bejerano, G., Siepel, A., Rosenbloom, K., Lindblad-Toh, K., Lander, E., Rogers, J., Kent, J., Miller, W., and Haussler, D. Identification and Classification of Conserved RNA Secondary Structures in the Human Genome. PLoS Computat Biol 2(4), e33 (2006). Rivas,E. and Eddy,S.R. (2001) Noncoding RNA gene detection using comparative sequence analysis. BMC Bioinformatics, 2, 8. Rivas,E. et al. (2001) Computational identification of noncoding RNAs in E. coli by comparative genomics. Curr. Biol., 11, 1369–1373.
30.
31.
32.
33.
34.
35.
36.
37.
Song,Y. et al. (2005) Tree decomposition based fast search of RNA structures including pseudoknots in genomes. Proc. IEEE Comput. Syst. Bioinform. Conf., IEEE Computer Society Press. 223–234. Song,Y. et al. (2006) Efficient parameterized algorithms for biopolymer structuresequence alignment. IEEE/ACM Trans. Comput. Biol. Bioinform., 3, 423–431. Srivastava, A., Cai, L., Mrazek, J., Malmberg, R.L. 2010, Evolutionary Analysis of Bacterial tmRNA and RNAseP Secondary Structures, Research Article, in revision. Washietl,S. et al. (2005) Fast and reliable prediction of noncoding RNAs. Proc. Natl Acad. Sci. USA, 102, 2454–2459. Weinberg, Z. and Ruzzo, W. L. (2004). Exploiting conserved structure for faster annotation of noncoding RNAs without loss of accuracy. Bioinformatics, 20 Suppl. 1:I334–I341. Weinberg, Z. and Ruzzo, W. L. (2006). Sequencebased heuristics for faster annotation of non-coding RNA families. Bioinformatics, 22:35–39. Yang,Z. et al. (2001) The 7SK small nuclear RNA inhibits the CDK9/cyclin T1 kinase to control transcription. Nature, 414, 317–322. Zhang, S., B. Haas, E. Eskin, and V. Bafna. 2005. Searching genomes for noncoding RNA using FastR. IEEE/ACM Trans. Comput. Biol. Bioinform. 2:366–379.
5. APPENDIX Table 1. Comparison of filtering/nonfiltering search accuracy among Infernal, trCYK and RNAv(ratio_threshold=0.85)
RFAM_id
RNA_name
No. of total training sequences
Infernal
RNAv
Filtering NonFiltering with trCYK
Filtering
NonFiltering
RF00002
5_8S_rRNA
62
100.00%
100.00%
90.32%
95.16%
95.16%
RF00003
U1
100
99.00%
100.00%
97.00%
97.00%
100.00%
RF00004
U2
212
96.70%
96.70%
90.09%
95.75%
96.23%
RF00005
tRNA
1052
95.91%
99.62%
91.16%
94.77%
98.48%
RF00008
Hammerhead_3
84
98.81%
98.81%
94.05%
86.90%
91.67%
RF00009
RNaseP_nuc
122
98.36%
98.36%
85.25%
95.08%
95.90%
RF00010
RNaseP_bact_a
306
100.00%
100.00%
99.67%
99.67%
89.87%
RF00011
RNaseP_bact_b
115
99.13%
99.13%
100.00%
100.00%
100.00%
RF00012
U3
27
100.00%
100.00%
100.00%
88.89%
92.59%
RF00015
U4
184
92.39%
92.39%
80.98%
89.67%
91.30%
RF00017
SRP_euk_arch
104
97.12%
100.00%
98.08%
100.00%
100.00%
RF00018
CsrB
14
100.00%
100.00%
100.00%
100.00%
100.00%
RF00019
Y
127
100.00%
100.00%
97.64%
100.00%
100.00%
65
RF00020
U5
184
94.57%
RF00023
71.74%
95.11%
228
98.25%
37
91.89%
RF00025
tmRNA Telomerasevert Telomerase-cil
99.12%
99.56%
100.00%
98.25%
94.59%
100.00%
97.30%
97.30%
24
91.67%
RF00028
Intron_gpI
30
80.00%
91.67%
91.67%
100.00%
95.83%
80.00%
56.67%
60.00%
53.33%
RF00029
Intron_gpII
113
93.81%
93.81%
88.50%
98.23%
99.12%
RF00030
RNase_MRP
89
RF00031
SECIS
61
93.26%
98.88%
97.75%
84.27%
94.38%
100.00%
100.00%
86.89%
100.00%
100.00%
RF00033
MicF
4
RF00037
IRE
39
100.00%
100.00%
100.00%
75.00%
75.00%
100.00%
100.00%
87.18%
92.31%
100.00%
RF00040
rne5
6
RF00054
U25
8
83.33%
83.33%
83.33%
83.33%
83.33%
100.00%
100.00%
87.50%
87.50%
100.00%
RF00055
snoZ37
9
RF00059
THI
118
100.00%
100.00%
88.89%
100.00%
88.89%
98.31%
98.31%
77.97%
93.22%
95.76%
RF00066
U7
RF00067
U15
47
100.00%
100.00%
80.85%
95.74%
85.11%
18
100.00%
100.00%
88.89%
94.44%
88.89%
RF00080
yybP-ykoY
25
100.00%
100.00%
92.00%
88.00%
88.00%
RF00096
U8
49
100.00%
100.00%
93.88%
100.00%
100.00%
RF00101
SraC_RyeA
13
100.00%
100.00%
100.00%
100.00%
100.00%
RF00104
mir-10
11
100.00%
100.00%
72.73%
81.82%
100.00%
RF00114
S15
80
98.75%
98.75%
86.25%
95.00%
96.25%
RF00163
Hammerhead_1
75
98.67%
98.67%
82.67%
98.67%
98.67%
RF00165
Corona_pk3
14
100.00%
100.00%
100.00%
92.86%
100.00%
RF00167
Purine
133
99.25%
99.25%
76.69%
100.00%
100.00%
RF00168
Lysine
47
100.00%
100.00%
97.87%
97.87%
97.87%
RF00169
SRP_bact
468
99.15%
98.93%
85.47%
98.29%
98.07%
RF00170
msr
10
90.00%
80.00%
60.00%
70.00%
80.00%
RF00174
Cobalamin
439
97.72%
97.72%
80.41%
98.86%
99.09%
RF00177
SSU_rRNA_5
341
96.19%
97.07%
98.24%
95.89%
42.82%
RF00206
U54
22
100.00%
100.00%
95.45%
100.00%
100.00%
RF00213
snoR38
19
100.00%
100.00%
78.95%
94.74%
100.00%
RF00230
T-box
65
90.77%
90.77%
100.00%
96.92%
96.92%
RF00234
glmS
18
100.00%
100.00%
100.00%
94.44%
94.44%
RF00373
RNaseP_arch
72
100.00%
100.00%
100.00%
95.83%
93.06%
RF00379
ydaO-yuaA
106
100.00%
100.00%
90.57%
87.74%
97.17%
RF00380
ykoK
96
100.00%
100.00%
98.96%
100.00%
100.00%
RF00448
IRES_EBNA
6
100.00%
100.00%
66.67%
100.00%
100.00%
RF00504
gcvT
53
100.00%
100.00%
84.91%
92.45%
96.23%
97.51%
97.67%
89.28%
93.70%
93.73%
RF00024
Avg
66
95.11%
95.11%
Fig. 2. Comparison of search accuracy of Infernal, trCYK, RNAv and RNATOPS in nonfiltering method
Table 2. Search results of RNAv and Infernal on RF00023/ RF00024/RF00029/RF00230 dataset. RF00023 Number of Training Sequences Filter Used Number of NULL stem Number of Genomes Searched Accuracy
RF00024
RF00029
RF00230
RNAv
Infernal
RNAv
Infernal
RNAv
Infernal
RNAv
Infernal
227
227
36
36
112
112
64
64
HMM
HMM/QDB
N/A
N/A
N/A
N/A
N/A
N/A
5
N/A
5
N/A
5
N/A
5
N/A
228
228
37
37
113
113
65
65
100%
98.25%
97.3%
94.59%
99.12%
93.81%
96.92%
90.77%
Table 3. Statistics of stems in RF00023 alignment Stem Id
N
L
K
J
A
E
F
B
G
C
I
H
D
M
Good Stem
214
217
63
224
195
191
153
189
115
178
117
131
179
212
Null Stem
14
0
0
2
9
4
0
1
2
10
7
7
5
16
Weak Stem
0
11
165
2
24
33
75
38
111
40
104
90
44
0
Table 4. Statistics of NULL stem in the RF00023 alignment and candidate hit alignment Stem Id
N
L
K
J
The original alignment file
14
Candidate
13
Real NULL stem in candidate
12
A
E
F
B
G
C
0
0
2
9
4
0
2
19
6
34
15
18
1
10
0
16
8
9
6
I
H
D
M
1
2
10
16
24
6
7
7
5
16
77
10
45
5
3
216
16
6
6
34
3
3
130
Table 5. Summary of stem and NULL stem in RF00023 alignment and candidate hit alignment Stem
NULL stem
The original alignment file
2976
77
Candidate
2345
30
Sensitivity
78.8%
42.86%
67
Table 6. Statistics of the stems in RF00024 alignment Stem Id
F
E
D
C
B
A
M
L
K
J
H
G
I
Q
P
O
N
Good 32 Stem Null Stem 4
27
22
33
37
37
37
34
37
36
37
29
37
34
35
37
35
4
13
0
0
0
0
2
0
0
0
3
0
0
0
0
0
Weak Stem
6
2
4
0
0
0
1
0
1
0
5
0
3
2
0
2
1
Table 7. Statistics of the NULL stem in RF00024 alignment and candidate hit alignment Stem Id
F
E
D
C
B
A
M
L
K
J
H
G
I
Q
Original sequence
4
4
13
0
0
0
0
Candidate hit
8
8
3
5
1
2
0
Real NULL stem in candidate
5
3
3
0
0
0
0
2
0
0
0
3
0
1
11
0
1
6
0
1
0
0
0
4
0
Table 8. Summary of stem and NULL stem in RF00024 alignment and candidate hit alignment Stem
NULL stem
The original alignment file
563
26
Candidate
271
9
Sensitivity
48.13%
34.6%
B
A
O
N
0
0
0
0
26
1
11
6
2
66
1
1
0
0
18
Table 9. Statistics of the stems in RF00029 alignment Stem Id
Table 10. Statistics of the NULL stem in RF00029 alignment and candidate hit alignment Stem Id
P
B
A
C
Good Stem
112
97
74
Null Stem
0
0
0
Weak Stem
1
16
39
Table 11. Summary of stem and NULL stem in RF00029 alignment and candidate hit alignment
C
Stem
NULL stem
339
0
292
0
Original sequence
0
0
0
Alignment
Candidate hit
0
0
0
Candidate
Real NULL stem in candidate
0
0
0
Sensitivity 86.14%
N/A
Table 12. Statistics of the stems in RF00230 alignment Stem Id
E
D
C
B
A
F
G
H
I
Good Stem
51
0
17
8
65
48
47
64
65
Null Stem
0
0
0
0
0
6
9
1
0
Weak Stem
14
65
48
57
0
11
9
0
0
Table 13. Statistics of the NULL stem in RF00230 alignment and candidate hit alignment
Table 14. Summary of stem and NULL stem in RF00230 alignment and candidate hit alignment
Stem Id
E
D
C
B
A
F
G
H
I
Stem
NULL stem
Original sequence
0
0
0
0
0
6
9
1
0
16
Alignment
553
16
Candidate hit
4
2
7
0
0
5
6
7
1
32
Candidate
369
Real NULL stem in candidate
2
2
6
0
0
4
6
1
0
21
Sensitivity 66.73%
68
10 62.5%
placeholder
69