Robust Performance Evaluation of POMDP-based Dialogue Systems
Recommend Documents
agr 2 sem 4. â¤. â¢. â¢. â¦. (9). An overview of all grammar rules defined in the fragment at the moment, together with the structures and principles from which they ...
1. INTRODUCTION. Traditionally, computational linguistics has developed for- malisms for .... the flight arrives at london heathrow terminal four (1.4). U:.
E-mail: [email protected]. Abstract ... according to the dialogue history; goal driven ... System: This is the AT&T CHRONUS Air Travel Information System.
good performance. There is a variety of commercial products available for supporting email services. Most of them rely on Internet standard protocols to format, ...
Sys There are 3 restaurants in the north of town serving Indian food! Would you ... Sys Sure, It is on Cambridge Leisure Park Clifton Way Cherry Hinton. Usr .... A call was made using an android mobile phone paired via Bluetooth with an ...
the best FFS for a given hardware / software context. We can also highlight some ... Linux kernel, officially (JFFS2, UBIFS) or through the application of a patch ...
and it is di cult to understand their interdependen- cies. Di erent business processes carried out by one organization and the e ects of restricted shared re-.
milestone in standardizing phasor measurements and defining performance ...
Measurement Unit, PMU Testing and Characterization, North. American ...
applications, the NASPI Performance and Standards Task Team. (PSTT) has ... collaboration of industry best practices while the DOE continues to ... Currently, there are about 140 phasor monitoring the North. America .... Analysis Tools. Other.
machines (AACMM). By using four different probing systems (passive spherical probe, active spherical probe, self-centering passive probe and self- centering ...
The present commercial solar cell converts solar water heating in a closed system, the inlet tem- energy into electricity with a relatively low ef- perature will vary ...
techniques to perform cogeneration plant evaluation, from an energy saving, ..... G.Genon and. P.Mancarella, Environmental impact of small- scale distributed ...
The problem of performance evaluation of such systems is of great im- ... is based upon the ratio between the number of weapon-target assignments and.
Coastal Sandy Clay Loam Soil at a Pilot Area in Krishna ... area in Krishna Western Delta (KWD) in South India to combat the problems of water logging (depth ...
Samuel Chindaro, Ming Ng, Ziheng Zhou, Farzin Deravi. Department of ... Abstract: The 3D Face project investigates the use of 3D face recognition technologies ...
applications, the NASPI Performance and Standards Task Team. (PSTT) has ... Measurement Unit, PMU Testing and Characterization, North. American ...
September 14th 2016. Callejas-RodrÃguez, A., Villatoro-Tello E. (et al.) A Teenager Chatbot for Preventing Cyber-Pedophilia. TSD 2016, Brno, Czech Republic.
Robust Header Compression Schemes for TCP and UDP. Traffic in Static ... UDP packets (such as source and destination addresses or port numbers, etc.) .... (RC), in which the context is (partially) corrupted and smaller packet types have to be.
Abstract. Least Squares Support Vector Regression (LS-SVR) is a po- werful kernel-based learning tool for regression problems. Nonlinear sys-.
This paper derives the power spectral density(PSD) of the output generated by a discrete-time feedback control system in which feedback measurements are.
Passive hysteresis +pp : Cae -+ I!&, having the in- put/output property with loops that are circuited counter- clockwise. As a result, for bounded input x([tl, tz]), for.
Robust Performance Evaluation of POMDP-based Dialogue Systems
domain independent, but it often fails to accurately model realistic user behavior. Since the ..... travel booking domain. We selected the first 300 dialogues in.
IEEE TRANSACTIONS ON AUDIO, SPEECH, AND LANGUAGE PROCESSING
1
Robust Performance Evaluation of POMDP-based Dialogue Systems Dongho Kim, Student Member, IEEE, Jin H. Kim, and Kee-Eung Kim, Member, IEEE
Abstract—Partially observable Markov decision processes (POMDPs) have received significant interest in research on spoken dialogue systems, due to among many benefits its ability to naturally model the dialogue strategy selection problem under unreliable automated speech recognition. However, the POMDP approaches are essentially model-based, and as a result, the dialogue strategy computed from POMDP is still subject to the correctness of the model. In this paper, we extend some of the previous MDP user models to POMDPs, and evaluate the effects of user models on the dialogue strategy computed from POMDPs. We experimentally show that the strategies computed from POMDPs perform better than those from MDPs, and the strategies computed from poor user models fail severely when tested on different user models. This paper further investigates the evaluation methods for dialogue strategies, and proposes a method based on the bias-variance analysis for reliably estimating the dialogue performance. Index Terms—Decision theory, partially observable Markov decision process (POMDP), planning under uncertainty, dialogue management, spoken dialog system (SDS).
I. I NTRODUCTION POKEN dialogue systems interact with the users using speech in order to help accomplish their intended tasks [1]. Spoken dialogue systems are increasingly ubiquitous for information search (e.g., querying for a train schedule) or command and control (e.g., controlling a car audio). Fig. 1 shows the three core components used in spoken dialogue systems: the speech recognition / language understanding component for interpreting the user’s speech, dialogue management component for determining an appropriate system response, and the response generation / text-to-speech component for converting the system response to speech [2]. The main focus of this paper is about determining the best system response in the dialogue management component. The traditional approach to developing the dialogue management component is to hand-code the dialogue strategy by a human expert. However, recent advances in sequential decision making and reinforcement learning have made it possible to learn the dialogue strategy from a corpus. While the early work on this approach has primarily adopted Markov decision
S
Copyright (c) 2010 IEEE. Personal use of this material is permitted. However, permission to use this material for any other purposes must be obtained from the IEEE by sending a request to [email protected]. This work was supported in part by Korea Science and Engineering Foundation (KOSEF) Grant R01-2007-000-21090-0 and in part by the Industrial Strategic Technology Development Program (10035348) funded by the Ministry of Knowledge Economy (MKE, Korea). D. Kim, J. H. Kim, and K.-E. Kim are with the Department of Computer Science, Korea Advanced Institute of Science and Technology, 335 Gwahakro, Yuseong-gu, Daejeon, Republic of Korea (e-mail: [email protected], {jkim, kekim}@cs.kaist.ac.kr).
speech recognition & language understanding dialogue management
user response generation & text-to-speech Fig. 1.
A block diagram of spoken dialogue systems.
processes (MDPs) as the model for dialogue management, the implication of using MDPs is that the current state of the dialogue is known exactly, and thus they do not easily capture the uncertainty introduced by errors in speech recognition / language understanding. To deal with the limited expressiveness of MDPs, partially observable Markov decision processes (POMDPs) have gathered interest for modeling spoken dialogue systems over the recent years [3]. POMDPs extend MDPs by allowing partial or uncertain observations, and hence, it is well suited for computing the optimal dialogue strategy under unreliable automatic speech recognition / natural language processing. Although the task of solving POMDPs is known to be intractable, recently proposed approximate algorithms such as point-based value iteration (PBVI) [4], heuristic search value iteration (HSVI) [5], [6], and composite-summary PBVI [7] show great promise for building spoken dialogue systems. However, we should note that the POMDP approaches are essentially model-based1: casting the dialogue system as a POMDP requires a model of user behaviors and speech recognition errors, which correspond to the transition and the observation probabilities in the POMDP model. Hence if the model is poor, i.e., far from real user behaviors, the dialogue strategy computed from the corresponding POMDP can be useless. To model user’s behavior accurately, various user models have been proposed and evaluated in the dialogue management literature. For example, the effect of model quality on dialogue strategies has been extensively studied in [13], but only in the context of the less expressive MDPs. Moreover, there is one more fundamental problem: it is often impossible to obtain a completely accurate estimate of 1 There are some recent works on reinforcement learning approaches to POMDP-based dialogue systems [8], [9]. However, they should be better understood as real-time dynamic programming (RTDP) for solving POMDPs [10], rather than reinforcement learning. Since they also require the model as an input, we expect that they are also susceptible to the correctness of the model. Reinforcement learning in partially observable environments is a hard problem, and it is still being actively studied [11], [12].
2
IEEE TRANSACTIONS ON AUDIO, SPEECH, AND LANGUAGE PROCESSING
user model parameters due to a finite amount of data. A simple technique is to divide data into two pieces, training and test data, and the policy optimized given training data is evaluated on the user model estimated from test data. However, this method is still limited when an insufficient amount of data is available. This paper is about building the user model and evaluating its effect on dialogue strategies in POMDPs. We build the user models from real data and use a symbolic version of HSVI for solving POMDPs [14]. We then compare the generalization capabilities of the MDP and the POMDP dialogue strategies across different user models, extending the results in [13]. To assess the robustness of learned strategies under model uncertainty, we propose an evaluation method based on the bias-variance analysis of value functions [15]–[17] and show that this method can evaluate the dialogue strategies in a more reliable way than previous evaluation methods (e.g., crossmodel evaluation and corpus-based correlation evaluation) in the sense that good strategies consistently outperform poor strategies across different user models. This paper is organized as follows. Section II briefly reviews the MDP and POMDP models for spoken dialogue systems. Section III describes some of the standard approaches for modeling user behavior in the dialogue management literature. In Section IV, we explain the existing evaluation methods for dialogue strategies, as well as our proposed method based on the bias-variance analysis. Section V describes our experimental setting and evaluation results. Finally, Section VI concludes this paper. II. MDPS
AND
POMDP S
FOR
D IALOGUES
This section reviews the definition of MDPs and POMDPs and explains how spoken dialogue systems can be cast as a POMDP. A. Review of MDPs and POMDPs An MDP is defined as hS, A, T, R, γi: S is the set of states; A is the set of actions; T is the transition function where T (s, a, s′ ) denotes the probability P (s′ |s, a) of changing to state s′ from state s by executing action a; R is the reward function where R(s, a) denotes the immediate reward of executing action a in state s; γ ∈ [0, 1) is the discount factor where rewards at t timesteps in the future are discounted by γ t . A stationary policy π : S → A specifies an action a = π(s) to take in each state s. The value of state s under policy π is defined as the sum of expected discounted rewards over an infinite horizon starting in state s and executing actions according to π: "∞ # X π t V (s) = E γ R(st , at )|s0 = s, π t=0
where st and at denote the state and action at timestep t. The mapping V π : S → R is called the value function according to π. The goal of MDP algorithms is to compute a policy π ∗ that ∗ maximizes the value in each state, i.e., V π (s) ≥ V π (s), for all s and π. Such a maximizing policy and its value function
are said to be optimal. Note that the optimal value function V ∗ is unique and it satisfies a system of non-linear equations: X V ∗ (s) = max R(s, a) + γ T (s, a, s′ )V ∗ (s′ ) ∀s ∈ S, a∈A
s′ ∈S
which is called the Bellman equation. One of the fundamental limitations of MDPs is the assumption of complete observability: it inherently assumes that there is no error in observing the state. POMDPs [18] make the model more expressive by allowing partial or uncertain observations. A POMDP is defined as hS, A, Z, T, O, R, γ, b0 i: S, A, T , R, and γ are defined the same as in MDPs. The states are now hidden in the sense that the agent makes observations from the set Z instead. O is the observation function where O(s, a, z) denotes the probability P (z|s, a) of making observation z when executing action a and arriving in state s. Since the state is hidden, the information available to determine the action consists of the history of past actions and observations. However, since action-observation histories grow with time, it is common to summarize histories with a fixed-length sufficient statistic of the state, which is called the belief state b ∈ ∆(S) where ∆(S) is the belief space representing |S|-dimensional probability simplex. b(s) denotes the probability that the agent is at state s. The belief state b can be updated to the successor belief b′ given an action a and an observation z according to Bayes theorem, which we denote b′ = τ (b, a, z) such that: X b′ (s′ ) = kO(s′ , a, z ′ ) T (s, a, s′ )b(s) (1) s∈S
where k is a normalizing constant. The policy π specifies an action π(b) to execute given any current belief b. Similarly to MDPs, the value function V π : ∆(S) → R can be defined as: "∞ # X π t V (b) = E γ R(bt , at )|b0 = b, π . t=0
The optimal value function also satisfies the following Bellman equations: X V ∗ (b) = max R(b, a) + γ P (z|b, a)V ∗ (τ (b, a, z)) a∈A
z∈Z
P
where R(b, a) P= s∈S b(s)R(s, a) and P (z|b, a) P ′ O(s , a, z) T (s, a, s′ )b(s). s′ s
=
B. MDPs and POMDPs for Spoken Dialogue Systems
MDPs and POMDPs for spoken dialogue systems typically model the dialogue states as S and the system actions as A. The dialogue state keeps track of various attributes of the dialogue, which can be naturally represented in a factored form: a state space described by a set of state variables each of which represents specific aspect of the dialogue, as in factored MDPs and POMDPs [19], [20]. The standard approach is to factor state s into three components hsu , au , sd i where su is the user goal, au is the current user response, and sd is the dialogue progress [3]: The user goal su represents what the user is trying to accomplish through the dialogue, and the
KIM et al.: ROBUST PERFORMANCE EVALUATION OF POMDP-BASED DIALOGUE SYSTEMS
3
important belief states. If a traversal has ended, value backups for belief states in the traversal are performed in the reversed order. HSVI utilizes the forward exploration heuristic favoring the belief state with a large difference between the lower and upper bound of the value function. There are also a number of algorithms for factored MDPs and POMDPs. These algorithms utilize factored state space representation to make computations in the algorithm faster by representing all the vectors and matrices used in the algorithms as the algebraic decision diagram (ADD) [23]. In our work, we used SPUDD [24] for factored MDPs and Symbolic HSVI [14] for factored POMDPs. Fig. 2.
A factored POMDP for spoken dialogue systems.
dialogue progress sd generally captures what the user has said and the information which the machine has received from the user. Based on the users goal and the system action, the user takes response au . Note that au represents the users true response, which generates noisy recognition result z = a ˜u when using POMDPs. By making some conditional independence assumptions, the transition and the observation probabilities in POMDP models for dialogues can be formulated as: P (s′ |s, a) = P (s′u |su , a)P (a′u |s′u , sd , a) P (s′d |s′u , a′u , sd , a)
(2)
P (z|s, a) = P (˜ au |au ). These probability models can be described compactly using a graphical model [21], i.e., a factored POMDP model for spoken dialogue systems as shown in Fig. 2. Factored representation of the state space can be used in various spoken dialogue systems. We focus on slot-filling dialogues, in which there is a set of slots and the machine has to collect values from the user for filling in the slots. In slot-filling dialogues, the user goal is represented as the set of values for each slot, which the user has in mind. The user response specifies the user’s reaction to the system action, such as mentioning a value for a particular slot, responding to a yes/no question, hanging up or starting the dialogue from scratch, and so on. The dialogue progress records a dialogue history including the status of each slot, such as the grounding status, the values of slots, or how confident the system is about the values. C. Algorithms for Factored MDPs and POMDPs Compared to MDPs, solving POMDPs exactly is known to be notoriously hard: it has been shown that finding an optimal policy over the entire belief space for a POMDP is PSPACEcomplete [22]. However, a number of approximate POMDP algorithms, including point-based algorithms, have made significant progress in recent years. A family of point-based value iteration algorithms achieves speed up in solving POMDPs by performing value backups at reachable belief states rather than over the entire belief space. For example, HSVI [5], [6] finds traversals through belief space by recursively exploring
III. U SER M ODELS FOR MDP S AND POMDP S In this section, we review some of the standard probabilistic approaches for modeling user behavior, i.e., P (a′u |s′u , sd , a), in the second multiplicative term of (2). One of the earliest user models is the Bigram model [25], which is a simple stochastic model for predicting the user response to the given system action. The Bigram model is specified as the probability P (a′u |a) for every possible pair of system action a and user response au . The Bigram model has the advantage of being “naive”: purely probabilistic and domain independent, but it often fails to accurately model realistic user behavior. Since the sampled user response may only be consistent with the previous system action, the user behavior may not make sense in the context of the whole dialogue. This model can be generalized to an n-gram model to use the wider context of the dialogue [26], [27]. The n-gram model is specified as P (a′u |at−1 , at−2 , . . . , at−n+1 ). However, n cannot be arbitrarily high due to data sparsity problems. If no n-grams match the current history, the model can back-off to a smaller n. This model is called the Trigram model when n = 3. More “sophisticated” user models have been proposed seeking a more accurate account of the real user behavior. The Levin model [28] is a modification to the pure Bigram model, which reduces the number of model parameters by limiting to admittable user responses. For instance, for the air travel information system (ATIS) task in [28], three types of system actions are assumed: greeting, constraining question and relaxation prompt. The constraining questions are the set of actions each requesting a value for a particular slot from the user, and the relaxation prompt is the action requesting the user to relax a particular constraint that was specified earlier. The user response for greeting is parameterized by P (n), n = 0, 1, 2, . . ., the probability of providing values for n slots in the same response, and P (k), the probability distribution on each slot k. The user response of the constraining questions is similarly parameterized by P (n|k) and P (k ′ |k) where P (k ′ |k) specifies the probability of the user specifying a value for slot k ′ when asked for the value of slot k, and n is the number of additional unsolicited slots in the same response. The user is only allowed to either accept or reject the proposed relaxation of slot k, hence the user response is parameterized by P (yes|k) = 1 − P (no|k). The Bigram and the Levin model both suffer from the lack of goal consistency in user behavior. To overcome this
4
IEEE TRANSACTIONS ON AUDIO, SPEECH, AND LANGUAGE PROCESSING
problem, the Pietquin model [29] extends the Levin model by conditioning the probabilities in the Levin model on the user goal su , i.e., P (a′u |s′u , a). The user goal is represented as a table of slot-value pairs. The Hidden Markov Model (HMM) [30] is a model for simulating both system actions and user behaviors. Hence, the model consists of the system model for predicting system actions and the user model for predicting user responses. There are many ways to define the system model, and the simplest approach is to use the classical definition of HMMs. In this case, the system model2 is defined by the transition probabilities P (s′d |sd ) and the observation probabilities P (a|sd ). However, since it is desirable to take the user response into account when predicting the system action, the system models using the Input Hidden Markov Model (IHMM) and the InputOutput Hidden Markov Models (IOHMM) are proposed as variants. The IHMM system model modifies the state transition probabilities in HMM to be P (s′d |sd , au ), and the IOHMM system model further modifies the observation probabilities in IHMM to be P (a|sd , au ). The user model is defined as the probability P (a′u |sd , a). If a dialogue has multiple goals, it can be divided into multiple segments, each of which has a particular goal. To capture this, the HMM user model can be extended to a twolevel model where the HMMs for each dialogue goal are connected by goal transition probabilities. All of the above user models are designed for predicting the true user response, and can be estimated from the dialogue corpus. If we model the dialogue problem as an MDP, we treat the recognized (and possibly incorrect) user response as the true user response 3 , and use these user models in the transition probabilities. Note that the reinforcement learning approach in [13] is equivalent to solving MDPs via stochastic optimization, where the recognized user response is sampled from the user model. If we model the dialogue problem as a POMDP, we use a dialogue corpus annotated with true user response, and additionally estimate the uncertainty in speech recognition results for observation probabilities. Our detailed methodologies for obtaining the models are described in Section V-C. IV. E VALUATION M ETHODS
FOR
D IALOGUE S TRATEGIES
It is generally non-trivial to evaluate dialogue strategies obtained from MDPs and POMDPs. The main challenge comes from the fact that when the computed strategy deviates from the dialogue flow in the corpus, there is no intuitive way of predicting how the dialogue will continue. In [31], we used the cross-model and the corpus-based correlation evaluation techniques [13] to evaluate the MDP and POMDP dialogue 2 The original definition of the HMM dialogue simulation model uses an abstract dialogue state for capturing the progress of the dialogue, for which we use sd since it plays an equivalent role. 3 MDPs can be constructed to account for the dialogue state uncertainties in various ways: if the confidence score from the speech recognizer is available, we can include it into the state space; we can also include n-best list of recognition results into the state space [3]. In fact, theoretically speaking, we can include the complete history of actions and observations into the state space of an MDP to be as expressive as a POMDP, but such a representation will be no longer manageable.
strategies. In this section, we review the above evaluation techniques, discuss the their shortcomings, and present a more reliable way of evaluating dialogue strategies adopting the recent work on bias-variance analysis of MDP and POMDP policies [15]–[17]. A. Cross-model Evaluation Ideally, we would like to evaluate the dialogue strategies by interacting with real users. When it is not possible, the availability of several user models allows us the cross-model evaluation [13], which involves testing the learned strategy across different user models. We prepare the dialogue simulators corresponding to each user model, and compare the returns by simulating the strategies. It is essential to test the strategies on different user models, since testing on the same user model may show good performance results even when the user model is significantly different from real user behaviors. Hence, we can expect that the dialogue strategy which generalizes well across different user models will perform well when tested with a real user. In order to simulate speech recognition errors, we construct each simulator using the corresponding POMDP model. Hence, the recognized user response is generated from the simulator, but each strategy monitors the dialogue state using its own user model. We make POMDP strategies monitor the dialogue state using the belief update from (1), but we make the MDP strategies simply take the recognized user response as the true user response, since the policies in MDP are inherently memoryless and reactive. One of the issues in using this evaluation method is that a dialogue strategy obtained from a naive user model may appear to perform very well when evaluated on the same user model (e.g., Bigram strategy evaluated on Bigram simulator), but may show poor performance when tested on a different user model (e.g., Bigram strategy evaluated on Levin simulator). B. Corpus-based Correlation Evaluation Since the cross-model evaluation instead uses simulators assuming specific user models, it inevitably introduces a bias. The corpus-based correlation evaluation [13] is an attempt to mitigate the bias by evaluating the learned dialogue strategy directly on the real dialogue data. We first calculate the similarity score θ(πd , π ∗ ) based on how similar the strategy πd followed in the dialogue d is to the learned strategy π ∗ . We then measure the correlation between θ(πd , π ∗ ) and the discounted return of the dialogue d. The idea here is that the correlation coefficient is expected to reflect the quality of the learned strategy because we can expect that the strategy will show high similarity to the dialogues with high returns, and low similarity to those with low returns. Hence, the dialogue strategy with the largest correlation coefficient is most preferable. Let a dialogue be a sequence of state-action pairs, d = −1 {(st , at )}Tt=0 . The similarity score between the learned policy ∗ π and the policy πd of dialogue d can be defined as: θ(πd , π ∗ ) =
T −1 1 X θπ∗ (st , at ) T t=0
KIM et al.: ROBUST PERFORMANCE EVALUATION OF POMDP-BASED DIALOGUE SYSTEMS
Dirichlet prior
where θπ∗ (s, a) is an action similarity measure reflecting how well the selected system action a in the data agrees with π ∗ and π ∗ (s).4 An action similarity could be defined in various ways. We use three definitions proposed in [13]: 1) the reciprocal rank of a according to the ordering of Qvalues in the policy π for the state s in which a was executed 1 ; θπ (s, a) = 1 + |{a′ ∈ A|Qπ (s, a′ ) > Qπ (s, a), a′ 6= a}|
dialogue data Dirichlet posterior
sampled model 1
2) the softmax of Q-values5 exp(Qπ (s, a)) ; π ′ a′ ∈A exp(Q (s, a ))
θπ (s, a) = P
|{ak ∈ a} ∩ {ak ∈ aπ }| . |{ak ∈ a} ∪ {ak ∈ aπ }|
We abbreviate the above metrics as RR, SQ, and RSA respectively. The correlation coefficient, however, is not a perfect measure because it only indicates the strength of a linear relationship between the similarity score and the return. In [31], we proposed regressing a linear function on the similarity-return data and compute the area under the linear function to evaluate the dialogue strategies in the hope that it will better reflect the quality of dialogue strategies. In hindsight, these evaluation methods appear to be useful only in limited settings. First, it is well known that there can be multiple optimal policies for an MDP or a POMDP. Hence, the optimal dialogue strategy computed from the model can be radically different from the successful dialogues in the corpus. Second, although there is a general tendency that learned strategies show low similarity to unsuccessful dialogues and high similarity to successful dialogues, the linear relationship assumption between the similarity and the return seems to be problematic. Depending on the similarity metric we use, the relationship may become nonlinear, making the correlation coefficient not very useful for differentiating good user strategies from poor ones. Hence, a careful choice of the similarity metric is required for reliable results. C. Bias-Variance Evaluation As pointed out in the cross-model evaluation method, the average return obtained from the simulation of the same user model used for computing the strategy is often misleading. The same can be said about the value function obtained from the MDP and POMDP algorithms. This is because the crossmodel evaluation does not consider the uncertainty inherent in the estimated model especially when learned from a finite 4 State s in the definitions of action similarity is replaced by belief state b in the case of POMDP policies. One step look-ahead is performed to calculate Q-values given the learned POMDP policy. 5 In [13], this similarity metric was defined as the ratio of the Q-value to the sum of all Q-values. We use a softmax of Q-values because it gives more reliable scores.
sampled model 2
...
sampled model n
sample ... sample trajectory trajectory
sample ... sample trajectory trajectory
average return
average return
bias
variance
average return
3) the ratio of the number of hsystem speech action, sloti pairs present in both a and aπ = π(s) to pairs present in either a or aπ θπ (s, a) =
5
estimated model
Fig. 3.
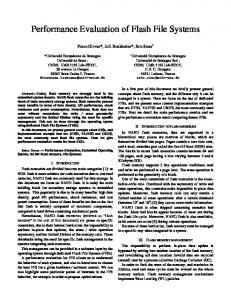
Computing bias and variance using user model simulation.
amount of data. Hence, we need to take this uncertainty into account when we evaluate dialogue strategies using user model simulators. In this section, we propose a model-based simulated evaluation scheme which stems from the recent work on bias-variance analysis of value functions in MDPs and POMDPs [15]–[17]. Given a dialogue strategy, our evaluation method works as follows. First, we assume Dirichlet prior on the probabilities and update Dirichlet prior to Dirichlet posterior using a dialogue corpus. Second, we sample multiple user models according to the Dirichlet posterior on the probabilities. These samples correspond to the test user models where the parameter values are perturbed. The perturbation represents the variation in the parameter values due to the limited amount of data available for estimating the user model. Third, we construct simulators using each sampled user model, and run multiple trials on each simulator to obtain average returns. We compute the average and the variance of the average returns. This evaluation process is illustrated in Fig. 3. This method can be seen as a Bayesian approach to computing the bias and variance of a value function using MonteCarlo simulation. Fig. 4 shows the bias and variance of a value function. A strategy is optimized for the estimated parameters of the user model, achieving the estimated value Vˆ . Let V be the random variable denoting the true value of the strategy in the (unknown) true user model, and thus the uncertainty in the model parameters introduces the bias and variance in V . The bias denotes the difference between Vˆ and E[V ], the expectation of V over parameters of the user model. Since the strategy is optimized for the estimated user model, the value V can significantly decrease from Vˆ if there is some amount of perturbation in the true model. Hence, E[V ] can be regarded as an indicator of how well the strategy will perform on “average” over the parameter values of the user model. The variance σ 2 (V ) of true value V also originates from the model uncertainty, representing the amount of variation in the performance of the strategy with respect to the uncertainty
6
IEEE TRANSACTIONS ON AUDIO, SPEECH, AND LANGUAGE PROCESSING
B. State Space, Action Space, and Reward Function
variance
bias value Fig. 4.
Bias and variance of a value function.
in the true model parameters. We can approximate E[V ] and σ 2 (V ) by the sample average and variance of the average returns calculated from the above Monte-Carlo simulation. The analytical formula for computing the bias and variance of value functions in MDPs and POMDPs can be found in [15] and [16] respectively. However, we cannot directly use the formula since the dialogue management model has a large state space. Using ADDs for the formula was also computationally infeasible in our experiments, but the Monte-Carlo estimation yielded reliable results. The idea of evaluating the dialogue strategies by Monte-Carlo simulation has appeared in [17] for the task of selecting the best features to be included in the model, although no explicit connection was made to the biasvariance analysis of value functions and developed only in the context of MDP-based systems. V. E XPERIMENTS In this section, we present experimental results of dialogue strategy evaluation methods. We describe the corpus used in experiments and the details of the model implementation before showing the results. A. Dataset The DARPA C OMMUNICATOR 2000 corpus [32]–[34] used in our experiments contains 648 real human-computer dialogues recorded using different dialogue managers from the travel booking domain. We selected the first 300 dialogues in the corpus for manually tagging the true user response with semantic information such as the type of the user response and its corresponding slot. Hence, the tags allow us to view the dialogues as sequences of “intentions”. In order to deal with the data sparsity problem in estimating user models, we ignored the slot values. We also constrained ourselves to the task of completing the first leg flight reservations. As a result, the dialogue manager has to fill out four slots: orig_city, dest_city, depart_date and depart_time, which means the starting location, the destination city, the departure date, and the departure time, respectively. Note that our preparation of the dataset from the corpus follows almost the same procedure used in [13]. The only difference is that we used a subset of the corpus, and tagged the dialogues manually.
The factored state space hsu , au , sd i of the MDP and POMDP for our dialogue management problem is specified as follows: The dialogue progress variable sd represents that a particular slot is unknown, known, or confirmed, resulting in a total number of 34 = 81 possible combinations. Similarly, the current user response variable au is determined by the user response for each slot: au = hau,orig city , au,dest city , au,depart date , au,depart time i. We have eight types of user responses for each slot: provide_info, reprovide_info, correct_info, reject_info, yes_answer, no_answer, question, and null (no mention of any slot value in the response). The user goal variable su , which is only used in the Pietquin user model, will be explained in the next subsection. Note that we ignored slot values, and thus they are not tracked in the dialogue state. However, the POMDP still tracks multiple dialogue progress states for each slot, as well as user response types and user goals. The action space is determined by the combination of the system actions for each slot: null, request_info, implicit_confirm, and explicit_confirm, resulting in a total of 44 system actions. We added hangup to the action set for finishing the dialogue. Ideally, we would like to use all system actions, but most of them are unlikely to be used in practice, e.g., implicit_confirm for all the slots at the same time. It was also difficult to include all possible system actions because of the large memory requirement of the POMDP algorithm. We thus used 32 system actions which appeared at least once in the corpus. We treated request_info for all slots as greeting system action. The reward function is selected as follows. First, every interaction incurs a negative reward of −1 in order to penalize long dialogues. Second, successful slot-filling (changing from unknown to known regardless of slot values) or confirmation (changing from known to confirmed) for each slot is awarded by +25, but this reward is given only at the end of the dialogue, i.e., when the system executes hangup action, in order not to provide any clue on how to complete the task during the dialogue. Third, we assign relatively large penalty of −10 for executing inappropriate actions in certain states: executing request_info on a known or confirmed slot, and executing implicit_confirm or explicit_confirm on an unknown or confirmed slot. Without this penalty, the dialogue strategy can show too much repetitive information request and confirm actions, which is undesirable. Fourth, we assign very large penalty of −100 for not executing the mandatory greeting action in the first turn, or executing it in other than the first turn. This enforces that greeting is the only action which should be executed only once in the first turn. The discount factor of γ = 0.95 was used for all experiments. Note that our reward function closely resembles the one used in [13]. When we actually measure the performance of dialogue strategies, the return of the dialogue is determined by the same reward function as above, using the true dialogue progress state in the simulator (cross-model and bias-variance evaluation) or
KIM et al.: ROBUST PERFORMANCE EVALUATION OF POMDP-BASED DIALOGUE SYSTEMS
au,orig city au,dest city au,depart date au,depart time
in the annotated corpus (corpus-based correlation evaluation). Table I shows how the rewards are measured using a dialogue example. C. User Model Implementation There are 8 possible user responses for each slot, and hence the number of the combined user responses is 84 = 4096. To deal with the data sparsity problem when building the Bigram model, we made the naive Bayes assumption, i.e., the user response for each slot is conditionally Q independent of others given the system action: P (a′u |a) = k P (a′u,k |a) where k is the index of a slot. We also built the Trigram model using the same assumption. We did not consider n-grams with n ≥ 4 because of the data sparsity problem and computational burden of the POMDP algorithm. We made the same conditional independence assumption for the Levin model. Furthermore, we assumed that the user response for a slot depends only on the system action associated with the slot. The admittable user responses for each system action for the slot were: (1) null and provide_info for null or request_info; (2) null, reprovide_info, correct_info, and reject_info for implicit_confirm; (3) yes_answer and no_answer for explicit_confirm. Therefore, the Levin model is specified as P (a′u |a) = Q ′ k P (au,k |ak ) where ak is a system action for slot k. The probabilities of the prohibited user responses are zero. The original Pietquin model conditions the model parameters on the user goal. The user goal is represented as a table of slot-value pairs, but our dialogues ignore the actual slot values. As a result, we circumvented the issue by having boolean values representing whether the information regarding the slot has been provided during each turn, instead of the full slotvalue table. Hence, the number of possible user goals was 24 = 16. Although this is not exactly same as the “goal consistency” in the original Pietquin model, this workaround was also used in [35]. In implementing the HMM model, we used a simple onelevel model in contrast to the original two-level model. This is because we only deal with the first leg flight reservation in the experiments, and it is regarded as a single dialogue goal [30]. The original HMM model generates both system actions and user responses. Because we only need to simulate user’s behavior, the user model in the original HMM model is only used. We decided to use the dialogue progress states as dialogue states for the HMMs, hence, the HMM model is specQ ified as P (a′u |sd , a) = k P (a′u,k |sd,k , ak ). The assumption of admissible user responses used in the Levin and Pietquin model is also used in the HMM model. While obtaining the observation probabilities which represent the uncertain results from the automated speech recognizer, we also had to deal with the data sparsity problem. The observation z is only dependent on the true user response, hence O(s, a, z) = P (z|au ). However the numbers of possible observations and user responses are 4096 each, and the table representation of the observation probabilities would require 4096 × 4096 parameters. Hence, we made the naive Bayes assumption that the observation for a particular slot is only dependent on the user response in the set
7
zorig city Fig. 5.
zdest city
zdepart date zdepart time
Graphical model of the observation probability.
of related (frequently confused) slots: the observation for orig_city or dest_city is only dependent on the user responses in orig_city and dest_city, and the observation for depart_date or depart_time is only dependent on the user responses in depart_date and depart_time. This is reasonable because, for example, the observation values that orig_city and dest_city are the same, and these two slots are often confused with each other. Fig. 5 shows the graphical model representation of the observation probability. This model is used in all of the three user models. When constructing the user models for MDPs, there are two possible approaches. The first approach would be taking the output from the automated speech recognizer while ignoring the true user response, and directly estimating the transition probabilities P (˜ a′u |a) by counting frequencies. We found that this approach suffers from data sparsity, especially in our experimental setting where we simulate speech recognition errors using the observation model from POMDP. We thus adopted the second approach, where we used the automated speech recognition output as well as the manually tagged true user response. This approach estimates the transition probaa′u |a′u ) bilities P (a′u |a) and the observation probabilities P (˜ as we do for POMDPs, then obtain the MDP user model by marginalizing out the true user response a′u , i.e., P (˜ a′u |a) = P ′ ′ ′ au |au )P (au |a). a′ P (˜ u
D. Solving MDPs and POMDPs
When obtaining MDP strategies, we modeled the dialogue management as a factored MDP, and used SPUDD [24]. We ran the algorithm until the Bellman error was lower than 0.02. When obtaining POMDP strategies, we modeled the problem as factored POMDP, and used Symbolic HSVI [14]. We ran the algorithm for 25 recursive backups at the initial belief state. E. Cross-model Evaluation Result In the cross-model evaluation, we tested the learned strategy across different user models. Fig. 6 shows the cross-model evaluation result reporting the average returns with 95% confidence intervals over 1000 runs terminating at hangup or after the maximum of 70 turns. The results of the MDP dialogue strategies are consistent with the results previously reported in [13]: a strategy computed from a naive user model may appear to perform well when evaluated on the same user model, but shows poor performance when tested on a different user model. The performances of the Bigram and Trigram strategies degraded drastically when tested on different user models, whereas the strategies obtained from the sophisticated user models, such as the Levin, Pietquin and HMM strategies,
8
IEEE TRANSACTIONS ON AUDIO, SPEECH, AND LANGUAGE PROCESSING
TABLE I A N E XAMPLE D IALOGUE WITH PARTIALLY F ILLED S LOTS . System utterance (M) / User utterance (U) / ASR result (O) M1: Hello. U1: I want to depart from Indianapolis. O1: [From Indianapolis] M2: Traveling from Indianapolis, Where would you like to go? U2: Portland. O2: [Atlanta] M3: Traveling to Atlanta, departing on what date? U3: No. O3: [–] M4: Traveling to Atlanta, departing on what date? U4: Correction. O4: [–] M5: Going to Atlanta, departing on what date? U5: I am not going to Atlanta. O5: [–] M6: Where would you like to go? U6: [User hangs up] O6: [User hangs up] M7: hangup.
System action (a) / True user response (au ) / Recognized user response (˜ au ) a = greet au = (proi, null, null, null) a ˜u = (proi, null, null, null) a = (impc, reqi, null, null)
Reward (r) / True dialogue progress state (sd ) / Most likely state for each slot and its probability from POMDP (ˆ sd ) r = −1 sd = (k, u, u, u) sˆd = (k : 0.998, u : 0.988, u : 0.894, u : 0.968) r = −1
au = (null, proi, null, null) a ˜u = (null, proi, null, null) a = (null, impc, reqi, null)
sd = (c, k, u, u) sˆd = (c : 0.985, k : 0.996, u : 0.881, u : 0.960) r = −1
au = (null, reji, null, null) a ˜u = (null, null, null, null) a = (null, impc, reqi, null)
sd = (c, u, u, u) sˆd = (c : 0.978, k : 0.871, u : 0.790, u : 0.951) r = −11 (−1 plus −10 for implicit_confirm on unknown slot)
au = (null, reji, null, null) a ˜u = (null, null, null, null) a = (null, impc, reqi, null)
sd = (c, u, u, u) sˆd = (c : 0.971, k : 0.764, u : 0.709, u : 0.943) r = −11 (−1 plus −10 for implicit_confirm on unknown slot)
au = (null, reji, null, null) a ˜u = (null, null, null, null) a = (null, reqi, null, null) – – a = hangup
sd = (c, u, u, u) sˆd = (c : 0.964, u : 0.672, u : 0.636, u : 0.934) r = −1 sd = (c, u, u, u) sˆd = (c : 0.964, u : 0.672, u : 0.636, u : 0.934) r = 50 (only one slot is c in sd ).
The shorthand notations used above are as follows: The states (sd,origin city , sd,dest city , sd,depart date , sd,depart time ) are represented using u = unknown, k = au,origin city , known, and c = confirmed. The true user response (au,origin city , au,dest city , au,depart date , au,depart time ) and the recognized user response (˜ ˜u,depart date , a ˜u,depart time ) are represented using proi = provide_info and reji = reject_info. The system action (aorigin city , adest city , a ˜u,dest city , a adepart date , adepart time is represented using reqi = request_info and impc = implicit_confirm. Note that recognition errors in O3, O4, and O5 decrease the probability of known for dest_city, making POMDP strategies eventually reask for the information. MDP strategies, in contrast, will never do so as they do not maintain such probability.
still perform reasonably well on different user models (The performance degradation was relatively small compared to the Bigram and Trigram strategies). The results of the POMDP dialogue strategies are also generally consistent with the previous results in [31], [36]: the POMDP strategies significantly outperform the MDP strategies when tested on the same user model, and also generalizes better than the MDP strategies when evaluated on different user models. We also make an interesting observation about the results from the Trigram simulator. Although the Levin, Pietquin and HMM strategies are regarded as good strategies, all of them show severe performance degradation. This phenomenon can be explained by the fact that Trigram model is the only model that looks at past system actions more than one turn. Hence, the user responses generated from the Trigram simulator may appear to be non-stationary for all the strategies other than the Trigram strategy. This is because the strategies look only at the past one system action to predict the user response, whereas the simulator looks at the past two system actions to sample the user response. This non-stationarity makes the strategies suffer more than in other user model simulators. We also note that MDP strategies occasionally outperform POMDP strategies in Trigram simulator. This is because in a nonstationary environment, it is sometimes more advantageous to just take the most recent experience (MDP) rather than using all the past experiences (POMDP).
F. Corpus-based Correlation Evaluation Result Table II shows the evaluation results on 300 dialogues in the C OMMUNICATOR corpus. For each dialogue similarity metric and each learned strategy, we show the average dialogue similarity and the correlation coefficient. Note that the average similarity does not stand for the quality of the learned strategy. The best correlation result is highlighted in bold face for each similarity metric. The results did not exactly follow those reported in [13]. The overall correlation coefficients were much higher. We conjecture that this is because our reward function is slightly different. It was also hard to find any significant consistency across different similarity metrics. This indicates that corpusbased evaluation results depend heavily on how the action similarity metric is defined. The POMDP strategies obtained from the Levin, Pietquin, and HMM models showed higher correlation than other strategies when the SQ metric is used. Moreover, the SQ metric was the only metric that yielded consistently higher correlation for POMDP strategies compared to MDP strategies within the same user model assumption. This seems to indicate that the metric needs to be some direct function of Q-values in order to capture the linear relationship between dialogue similarities and dialogue returns.
KIM et al.: ROBUST PERFORMANCE EVALUATION OF POMDP-BASED DIALOGUE SYSTEMS
9
Bigram strategy
Trigram strategy
Levin strategy
Bigram simulator
Bigram simulator
Bigram simulator
115.84
MDP strategy POMDP strategy
108.40
MDP strategy POMDP strategy
MDP strategy POMDP strategy 93.76 41.12 88.71
Trigram simulator
HMM simulator 74.59
65.66
68.28 66.98
HMM simulator
Trigram simulator
-4.51 54.31
Trigram simulator
HMM simulator 97.85
117.09 129.69
92.22 74.15
-6.99
50
60
65.35 69.81
70
80
90 100 110 120
76.49
−50
0
50
100
150
50
60
70
80
90 100 110 120
63.56 -14.68
65.35
-11.24 90.42
49.88
92.48
50.65 99.25
Pietquin simulator
Pietquin simulator
Levin simulator
(a) Bigram strategy
99.53
Pietquin simulator
Levin simulator
Levin simulator
(c) Levin strategy
(b) Trigram strategy Pietquin strategy
HMM strategy
Bigram simulator
Bigram simulator MDP strategy POMDP strategy
MDP strategy POMDP strategy
87.13
85.1
72.54
Trigram simulator
HMM simulator
83.61
HMM simulator
Trigram simulator
101.34
100.88
80.91
90.79
93.01
71.87
72.46
50
90.84
60
70
68.67
80
90 100 110 120
50
91.29
91.51
97.12
98.27
99.06
Pietquin simulator
Pietquin simulator
Levin simulator
60
70
80
90 100 110 120
90.22
97.39
Levin simulator
(e) HMM strategy
(d) Pietquin strategy
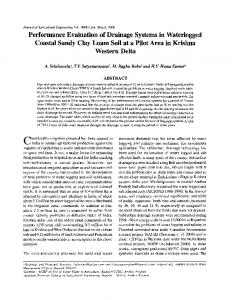
Fig. 6. Cross-model evaluation result. Each graph shows the average returns of the MDP and POMDP dialogue strategies obtained from each user model. The performance on each user model simulator is shown at each axis. The error bars indicate 95% confidence intervals. Note that the scale changes in the Trigram strategy graph. TABLE II C ORPUS - BASED C ORRELATION E VALUATION R ESULTS Dialogue strategy MDP Bigram MDP Trigram MDP Levin MDP Pietquin MDP HMM POMDP Bigram POMDP Trigram POMDP Levin POMDP Pietquin POMDP HMM
G. Bias-Variance Evaluation Result Adopting the Monte-Carlo approximation technique in Section IV-C, we sampled 30 models for each user model simulator. We used the Dirichlet prior of which the parameters are all set to 1 and sampled the POMDP models from the updated Dirichlet posterior. Model sampling for the Bigram and Trigram model can be done in a straightforward way. For the Levin, Pietquin and HMM models that prohibit inappropriate user responses, we also set Dirichlet parameters for the prohibited user responses to 1, allowing the prohibited user responses to have non-zero probabilities. We also experimented with the sampled models in which the prohibited user
responses were enforced to have zero probabilities, but the result was not significantly different. For each sampled models, we calculated the average of 1000 samples of returns by simulating the model, terminating each run at hangup or after the maximum of 70 turns. Hence, we gathered 30 average returns, each corresponding to the sampled user model. Fig. 7 shows bias-variance evaluation results reporting the average returns with 95% confidence intervals. The confidence intervals were calculated from the 30 average returns. First, note that each strategy yields similar graph shape across the simulators. There was no significant tendency of high average returns when evaluated on the same user model
10
IEEE TRANSACTIONS ON AUDIO, SPEECH, AND LANGUAGE PROCESSING
Bigram strategy
Trigram strategy
Levin strategy
Bigram simulator
Bigram simulator
Bigram simulator
MDP strategy POMDP strategy
MDP strategy POMDP strategy
MDP strategy POMDP strategy 28.09
5.20
5.13
16.25 -11.01
HMM simulator
Trigram simulator
HMM simulator
39.16
Trigram simulator
-69.75
65.52
17.04
28.00
-61.59
−100
-24.50
−50
-21.58 -54.02
0
50
100
54.01
1.22 -37.42
-101.24
−100
-48.03 27.11
Trigram simulator
HMM simulator
−50
0
50
100
−100
−50
0
50
100
-49.19
27.16
41.33
21.97
44.57
57.52
23.69
58.44 71.23
69.61
Pietquin simulator
Pietquin simulator
Levin simulator
Pietquin simulator
Levin simulator
(b) Trigram strategy
(a) Bigram strategy
Levin simulator
(c) Levin strategy
Pietquin strategy
HMM strategy
Bigram simulator
Bigram simulator
MDP strategy POMDP strategy
MDP strategy POMDP strategy
27.82 11.43 11.14 11.14
Trigram simulator
HMM simulator 68.97 49.12
61.45
3.61
Trigram simulator
HMM simulator 48.88 -18.03
-39.57
−100
51.49 72.17
Pietquin simulator
−50
-53.83
0
50
100
−100
54.40
51.47 73.00
Levin simulator
(d) Pietquin strategy
64.59
Pietquin simulator
−50
0
50
100
53.91 66.19
Levin simulator
(e) HMM strategy
Fig. 7. Bias-variance evaluation result. Note that the overall performance is degraded compared to cross-model evaluation results due to the bias. The error bars indicate 95% confidence intervals for the expected return over the model parameter values.
simulator. This is because if the strategy is overfit to a specific user model, the perturbation incurred by model sampling will result in a large bias. This is particularly true for poor dialogue strategies such as Bigram and Trigram strategies evaluated in the same user model simulator. Hence, whatever simulator we use, good dialogue strategies will yield high average returns and poor ones will yield low average returns. This consistent property is highly desirable, which could not be found in the cross-model evaluation method. Second, observe that the difference in performance between the POMDP and MDP strategies was more distinctive than in the cross-model evaluation. This indicates the POMDP strategies are more robust to the model uncertainty than the MDP strategies, reflecting the advantage of maintaining the distribution over the dialogue states. Third, the POMDP strategies from the Levin, Pietquin, and HMM models showed better performance than other strategies whatever simulator we used. We can make a qualitative explanation as follows: consider a poor dialogue strategy such as the Bigram strategy. This strategy is often opportunistic in the sense that it tries to exploit every possible user response. For example, the user may provide additional information about some slots even though prompted with an explicit confirmation, and the strategy may be betting on such event albeit it is of a small probability. The performance of the strategy can thus be sensitive to the myriad of events with small probabilities. However, good dialogue strategies such as
Levin strategy typically ignore those events, and thus achieve better performance under parameter perturbation. VI. C ONCLUSION This paper experimentally investigates the effect of user modeling on POMDP-based dialogue systems. Building on the previous results on MDP-based dialogue systems, we extended the experiments to the POMDP case, and showed that good user model is essential for computing good dialogue strategies. Our findings in POMDP dialogue strategies are consistent with those in MDPs. We also showed that POMDP strategies significantly outperform MDP strategies, whether the user model used in learning the strategy is identical or different to the one used in the evaluation, except when tested on the non-stationary user model simulator. We also proposed a model-based simulated evaluation scheme, which has connection to the recent work on the biasvariance analysis of value functions in MDPs and POMDPs. The key idea behind this evaluation method is to evaluate the dialogue strategies under model uncertainty. We experimentally showed that this evaluation method yields more reliable results. Although the experiments in this paper focused on dialogues without slot values, the proposed methodology should be extended in the future to deal with dialogues with slot values, making our method a step closer to evaluating deployed spoken dialogue systems. Another potential research direction
KIM et al.: ROBUST PERFORMANCE EVALUATION OF POMDP-BASED DIALOGUE SYSTEMS
includes the use of other metrics in addition to average returns for evaluating dialogue strategies with further analyses of the influence of user models on learned dialogue strategies. ACKNOWLEDGMENT The authors would like to thank the anonymous reviewers for the invaluable comments for improving the paper. R EFERENCES [1] N. Fraser, “Assessment of interactive systems,” in Handbook of Standards and Resources for Spoken Language Systems, 1997, pp. 564–614. [2] M. F. McTear, “Spoken dialogue technology: Enabling the conversational user interface,” ACM Comput. Surv., vol. 34, no. 1, pp. 90–169, 2002. [3] J. D. Williams and S. Young, “Partially observable Markov decision processes for spoken dialog systems,” Comput. Speech Lang., vol. 21, no. 2, pp. 393–422, 2007. [4] J. Pineau, G. Gordon, and S. Thrun, “Anytime point-based approximations for large POMDPs,” J. Artif. Intell. Res., vol. 27, pp. 335–380, 2006. [5] T. Smith and R. Simmons, “Heuristic search value iteration for POMDPs,” in Proc. 20th Conf. Uncertainty Artif. Intell. (UAI), Banff, Canada, 2004, pp. 520–527. [6] ——, “Point-based POMDP algorithms: Improved analysis and implementation,” in Proc. 21st Conf. Uncertainty Artif. Intell. (UAI), Edinburgh, U.K., 2005, pp. 542–555. [7] J. D. Williams and S. Young, “Scaling POMDPs for spoken dialog management,” IEEE Trans. Audio Speech Lang. Process., vol. 15, no. 7, pp. 2116–2129, 2007. [8] B. Thomson, J. Schatzmann, K. Weilhammer, H. Ye, and S. Young, “Training a real-world POMDP-based dialog system,” in HLT/NAACL Workshop ”Briding the Gap: Academic and Industrial Research in Dialog Technologies, Rochester, 2007. [9] B. Thomson and S. Young, “Bayesian update of dialogue state: A POMDP framework for spoken dialogue systems,” Comput. Speech and Lang., vol. 24, no. 4, pp. 562–588, 2010. [10] H. Geffner and B. Bonet, “Solving large POMDPs using real time dynamic programming,” in Fall AAAI Symp. on POMDPs, 1998. [11] D. Wierstra and M. Wiering, “Utile distinction hidden Markov models,” in Proc. 21st Int. Conf. Machine Learning (ICML), Banff, Alberta, Canada, 2004, pp. 855–862. [12] S. Ross, J. Pineau, and B. Chaib-draa, “Bayes-adaptive POMDPs,” in Proc. Adv. Neural Inf. Process. Syst. 20 (NIPS), 2008. [13] J. Schatzmann, M. N. Stuttle, K. Weilhammer, and S. Young, “Effects of the user model on simulation-based learning of dialogue strategies,” in Proc. IEEE Workshop Autom. Speech Recognition Understanding (ASRU), San Juan, Puerto Rico, 2005, pp. 412–417. [14] H. S. Sim, K.-E. Kim, J. H. Kim, D.-S. Chang, and M.-W. Koo, “Symbolic heuristic search value iteration for factored POMDPs,” in Proc. 23rd Nat. Conf. Artif. Intell. (AAAI), Chicago, IL, 2008. [15] S. Mannor, D. Simester, P. Sun, and J. N. Tsitsiklis, “Bias and variance approximation in value function estimates,” Manag. Sci., vol. 53, no. 2, pp. 308–322, 2007. [16] M. M. Fard, J. Pineau, and P. Sun, “A variance analysis for POMDP policy evaluation,” in Proc. 23rd Nat. Conf. Artif. Intell. (AAAI), Chicago, IL, 2008. [17] J. R. Tetreault, D. Bohus, and D. J. Litman, “Estimating the reliability of MDP policies: A confidence interval approach,” in Proc. of Human Language Technologies: The Annual Conf. of the North American Chapter of the Association for Computational Linguistics (NAACLHLT), Rochester, NY, 2007. [18] L. P. Kaelbling, M. L. Littman, and A. R. Cassandra, “Planning and acting in partially observable stochastic domains,” Artif. Intell., vol. 101, pp. 99–134, 1998. [19] C. Boutilier, R. Dearden, and M. Goldszmidt, “Exploiting structure in policy construction,” in Proc. 14th Int. Joint Conf. Artif. Intell. (IJCAI), Montreal, Canada, 1995, pp. 1104–1111. [20] C. Boutilier and D. Poole, “Computing optimal policies for partially observable decision processes using compact representations,” in Proc. 13th Nat. Conf. Artif. Intell. (AAAI), Portland, OR, 1996, pp. 1168–1175. [21] T. Dean and K. Kanazawa, “A model for reasoning about persistence and causation,” Comput. Intell., vol. 5, no. 3, pp. 142–150, 1989.
11
[22] C. H. Papadimitriou and J. N. Tsitsiklis, “The complexity of Markov decision-processes,” Math. Oper. Res., vol. 12, no. 3, pp. 441–450, 1987. [23] R. I. Bahar, E. A. Frohm, C. M. Gaona, G. D. Hachtel, E. Macii, A. Pardo, and F. Somenzi, “Algebraic decision diagrams and their applications,” in Proc. IEEE/ACM Int. Conf. Computer-Aided Design (ICCAD), Santa Clara, CA, 1993, pp. 188–191. [24] J. Hoey, R. St-Aubin, A. Hu, and C. Boutilier, “SPUDD: Stochastic planning using decision diagrams,” in Proc. 15th Conf. Uncertainty Artif. Intell. (UAI), Stockholm, Sweden, 1999, pp. 279–288. [25] W. Eckert, E. Levin, and R. Pieraccini, “User modeling for spoken dialogue system evaluation,” in Proc. IEEE Workshop Autom. Speech Recognition Understanding (ASRU), 1997, pp. 80–87. [26] K. Georgila, J. Henderson, and O. Lemon, “Learning user simulations for information state update dialogue systems,” in Proc. of Interspeech, Lisbon, Portugal, 2005, pp. 893–896. [27] ——, “User simulation for spoken dialogue systems: Learning and evaluation,” in Proc. of Interspeech, Pittsburgh, PA, 2006, pp. 1065– 1068. [28] E. Levin, R. Pieraccini, and W. Eckert, “A stochastic model of humanmachine interaction for learning dialog strategies,” IEEE Trans. Speech Audio Process., vol. 8, no. 1, pp. 11–23, 2000. [29] O. Pietquin, “A framework for unsupervised learning of dialogue strategies,” Ph.D. dissertation, Facult´e Polytechnique de Mons, 2004. [30] H. Cuay´ahuitl, S. Renals, O. Lemon, and H. Shimodaira, “Humancomputer dialogue simulation using hidden Markov models,” in Proc. IEEE Workshop Autom. Speech Recognition Understanding (ASRU), San Juan, Puerto Rico, 2005. [31] D. Kim, H. S. Sim, K.-E. Kim, J. H. Kim, H. Kim, and J. W. Sung, “Effects of user modeling on POMDP-based dialogue systems,” in Proc. Interspeech, Brisbane, Australia, 2008. [32] M. Walker, J. Aberdeen, J. Boland, E. Bratt, J. Garofolo, L. Hirschman, A. Le, S. Lee, S. Narayanan, K. Papineni, B. Pellom, J. Polifroni, A. Potamianos, P. Prabhu, A. Rudnicky, G. Sanders, S. Seneff, D. Stallard, and S. Whittaker, “DARPA Communicator dialog travel planning systems: The June 2000 data collection,” in Proc. Eurospeech, Aalborg, Denmark, 2001, pp. 1371–1374. [33] M. Walker, R. Passonneau, and J. Boland, “Quantitative and qualitative evaluation of DARPA Communicator spoken dialogue systems,” in Proc. Assoc. Comput. Ling. (ACL), 2001, pp. 515–522. [34] K. Georgila, O. Lemon, and J. Henderson, “Automatic annotation of COMMUNICATOR dialogue data for learning dialogue strategies and user simulations,” in Proc. 9th Workshop Semantics Pragmatics Dialogue (SEMDIAL), 2005, pp. 61–68. [35] J. Schatzmann, K. Georgila, and S. Young, “Quantitative evaluation of user simulation techniques for spoken dialogue systems,” in Proc. SIGdial Workshop Discourse Dialogue, Lisbon, Portugal, 2005, pp. 45– 54. [36] N. Roy, J. Pineau, and S. Thrun, “Spoken dialogue management using probabilistic reasoning,” in Proc. Assoc. Comput. Ling. (ACL), 2000, pp. 93–100.
Dongho Kim studied computer science and mathematics as an undergraduate at KAIST where he received his BS degree in 2003. He is currently a PhD candidate in computer science at KAIST. His research interests include decision-making in complex, uncertain environments.
12
Jin H. Kim received the BS degree from Seoul National University, Korea, in 1971, and the MS and PhD degrees in computer science from University of California Los Angeles, in 1979 and 1983, respectively. He was a research engineer at the Korea Institute of Science and Technology from 1973 to 1976 and a senior staff member in computer science at Hughes Research Laboratories, California, from 1981 to 1985. In 1985, he joined the faculty of KAIST Computer Science Department. In 1990, he founded the Center for AI Research and became a chief director. He was a visiting scientist at the IBM Watson Research Center in 1990. From 1995 to 1999, he served as the president of the Korea R&D Information Center, which is responsible for the scientific and technical information services in Korea. He is a fellow of the Korean Academy of Science and Technology, a fellow of International Association of Pattern Recognition, and a member of the National Academy of Engineering of Korea. He published about 70 international journal papers in the area of artificial intelligence and pattern recognition. His research is now focused on dependency modeling for pattern recognition.
Kee-Eung Kim received the BS degree in Computer Science from KAIST, Korea, in 1995, and the ScM and PhD degrees in Computer Science from Brown University, USA, in 1998 and 2001, respectively. From 2001 to 2006, he was a senior software engineer at Samsung SDS, Korea, and a senior research staff member at Samsung advanced institute of technology, Korea. In 2006, he joined the faculty of Computer Science Department at KAIST. His research interests are representations and algorithms for sequential decision making problems in artificial intelligence and machine learning, including Markov decision processes and reinforcement learning.
IEEE TRANSACTIONS ON AUDIO, SPEECH, AND LANGUAGE PROCESSING