JOURNAL OF INFORMATION SCIENCE AND ENGINEERING 19, 267-282 (2003)
Robust Speaker Identification System Based on Wavelet Transform and Gaussian Mixture Model CHING-TANG HSIEH, EUGENE LAI AND YOU-CHUANG WANG Department of Electrical Engineering Tamkang University Taipei, 251 Taiwan E-mail:
[email protected] This paper presents an effective and robust method for extracting features for speech processing. Based on the time-frequency multiresolution property of wavelet transform, the input speech signal is decomposed into various frequency channels. For capturing the characteristics of the vocal track and vocal codes, the traditional linear predictive cepstral coefficients (LPCC) of the approximation channel, and the entropy of the detail channel for each decomposition process are calculated. In addition, a hard thresholding technique for each lower resolution is applied to remove interference from noise. Experimental results show that using this mechanism not only effectively reduces the influence of noise, but also improves recognition. Finally, the proposed feature extraction algorithm is evaluated on the MAT telephone speech database for text-independent speaker identification using the Gaussian Mixture Model (GMM) identifier. Some popular existing methods are also evaluated for comparison in this paper. The results show that the proposed method of feature extraction is more effective and robust than other methods. In addition, the performance of our method is very satisfactory even at low SNR. Keywords: wavelet transform, linear predictive cepstral coefficients (LPCC), MAT (Mandarin Speech Across Taiwan), Gaussian mixture model (GMM), speaker identification
1. INTRODUCTION A speech signal consists of several levels of information, which can be divided into two main categories. First, the speech signal conveys words or a message being spoken, and second, the signal also conveys information about the identity of the speaker. While the area of speech recognition is concerned with extracting the underlying linguistic message in an utterance, the area of speaker recognition is concerned with extracting the identity of the person speaking. Generally, speaker recognition can be divided into two parts: speaker verification and speaker identification. Speaker verification refers to whether or not the speech samples belong to some specific speaker. Thus, the result can only be yes or no depending on the calculation by an a priori threshold. However, in speaker identification, the goal is to determine which one of a group of known voices best matches the input voice samples. Furthermore, for both of the tasks the speech can be either text-dependent (TD) or text-independent (TI). Text-dependent means that the
Received August 19, 2000; revised January 12 & May 11 & June 27, 2001; accepted February 22, 2002. Communicated by C. C. Jay Kuo.
267
268
CHING-TANG HSIEH, EUGENE LAI AND YOU-CHUANG WANG
text used in the training system is the same as that used in the test system, while text-independent means that there is no limitation on the text used in the test system. Certainly, how to extract and model the speaker-dependent characteristics of the speech signal that can effectively distinguish one speaker from another is the key point seriously affecting the performance of the system. Much research has been done on speaker recognition. Linear predictive coding (LPC) is used because of its simplicity and effectiveness in speaker/speech recognition [1, 2]. Another widely used feature parameters, mel frequency cepstral coefficients (MFCC), are used [3] because they are calculated by using a filter-bank approach in which the set of filters has equal bandwidth with respect to the mel-scale frequencies. This is based on the fact that human perception of frequency content of sounds does not follow a linear scale. Cepstral coefficients and their time functions derived from orthogonal polynomial representations are used as feature spaces [4]. In that paper, Furui uses mean normalization technique to improve the identification performance by minimizing intersession variability. However, the average spectra are susceptible to variations due to manner of speech (for example, loud or soft) and noisy environments. Speech collected at different times can also caused disparity in system performance. In addition to the above three most commonly used feature extractions, there are other special speech features extracted often for speaker identification. Gopalan et al. [5] propose a compact representation for speech using Bessel functions because of the similarity between voiced speech and Bessel functions. It has been shown that the features obtained from the Fourier-Bessel expansion of speech are comparable to the cepstral features in representing the spectral energy. Phan et al. [6] use a wavelet transform to divide speech signals into four octaves by using quadrature mirror filters (QMFs). In their evaluations, each utterance is constrained to within 0.5 sec, and thus the speech samples are edited to truncate each trailing space in the utterance. Furthermore, the speech features are extracted by calculating the mean value of the coefficients that fall within the bins. Their experiments show that the performance is plagued by noise because of the simplified extraction method. In this paper we propose an effective and robust extraction method for speech features based on time-frequency multi-resolution analysis. First, the input speech signal is double sampled by an interpolation mechanism because of the down sampling process within the wavelet transform. After preprocessing, the wavelet transform is applied to decompose the input signal into two different uncorrelation frequency channels: lower frequency approximations and higher frequency details by using the compact and orthogonal QMFs. For capturing the characteristics of individual speaker, the traditional linear predictive cepstral coefficients (LPCC) of the lower frequency channel and the entropy of higher frequency channel are calculated. Based on this mechanism, one can easily extract the multi-resolution features from the approximation channel just by using the wavelet decomposition and calculate the related coefficients. To further alleviate the problem of noise, a hard thresholding technique is used before the next decomposition process. The experimental results show that using this thresholding technique not only reduces the effects of noise but also improves recognition. Finally, the MAT speech database is used to evaluate the proposed extraction algorithm for text independent speaker identification. The results show that the proposed method is more effective and robust than other existing methods, especially on speech signals corrupted by additive
WAVELET TRANSFORM WITH APPLICATION TO SPEAKER IDENTIFICATION
269
noise. Furthermore, a satisfactory performance can also be obtained even at low SNR. This paper is organized as follows. In section 2, we briefly review the theory of wavelet transforms. The proposed extraction algorithm of speech features is described in section 3. Section 4 gives the matching algorithm. Experimental results and several comparisons with other existing methods are presented in section 5. Concluding remarks are given in section 6.
2. REVIEW OF WAVELET TRANSFORM Wavelets are families of functions ψ j , k ( t ) generated from a single base wavelet, called the “mother wavelet,” by dilations and translations, i.e.,
ψ j ,k (t ) = 2 j / 2ψ (2 j t − k )
j, k ∈ Z
(1)
where Z is the set of all integers, j is the dilation (scale) parameter and k is the translation parameter. In order to use the idea of multi-resolution, we must define the scaling function and then define the wavelet in terms of it. First, we define a set of scaling functions in terms of integer translates of the basic scaling function by
ϕ k (t ) = ϕ (t − k )
k∈Z
ϕ ∈ L2 .
(2)
The subspace of L2 ( R ) spanned by these functions is represented as V0 = Span{ϕ k (t )}
(3)
k∈Z
for all k ∈ Z . As described for the wavelet in the previous paragraph, one can generally increase the size of the subspace by changing the time scale of the scaling function. A two-dimensional family of functions is generated from the basic scaling function by scaling and translation
ϕ j , k (t ) = 2 j / 2 ϕ ( 2 j t − k )
j, k ∈ Z
(4)
V j = Span{ϕ k (2 j t )} = Span{ϕ j ,k (t )}
(5)
in which the span over k is
k
k
for k ∈ Z . When j > 0 , the span is large since ϕ j ,k (t ) is narrow and is translated in small step. It therefore can represent finer detail. When j < 0 , ϕ j ,k (t ) is wide and is translated in large step. Hence these wide scaling functions can represent only coarse information, and the space they span is small. Another way to consider the effects of the change of scale is in terms of resolution. Accordingly, the family ϕ j ,k (t ) forms an orthonormal basis for V j , and the family
CHING-TANG HSIEH, EUGENE LAI AND YOU-CHUANG WANG
270
ψ j ,k (t ) forms an orthonormal basis for W j , where W j is the orthogonal complement of V j in V j −1 defined as follows: V j −1 = V j ⊕ W j j ∈ Z
(6)
with V j ⊥ W j , where ⊕ denotes the direct sum. Because the Vj spaces have a scaling property, there ought to exist a scaling property for the Wj spaces. Using recursion of (6), the V0 space can be decomposed in the following manner: V0 = W1 ⊕ ⋅ ⋅ ⋅ ⊕ W j −1 ⊕ W j ⊕ V j
(7)
A function can be written as a linear combination of scaling functions and wavelet functions in V0 and can be rewritten as f 0 (t ) = ∑ c0,k ϕ 0,k (t ) k
J
= ∑ (c J ,k ϕ J ,k (t ) + ∑ d j ,kψ j ,k (t )) k
(8)
j =1
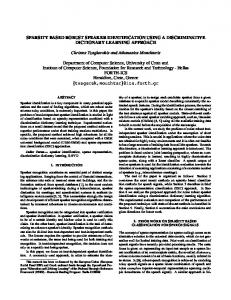
by simply iterating the decomposition J times. The decomposition of the input signal into “approximation” and “detail” space is called a multi-resolution approximation, and can be realized by using a pair of finite impulse response (FIR) filters h and g called low-pass and high-pass filters, respectively. These filters form one stage of the filter-bank structure shown in Fig. 1. Obviously, wavelet analysis can be considered to be a time-scale method embedded with the characteristic of frequency. It is most effective when it is applied to the detection of short-time phenomena, discontinuities, or abrupt changes in signal. The classical Two-Band wavelet system results in a logarithmic frequency resolution. The low frequencies have narrow bandwidths and the high frequencies have wide bandwidths. An analytical description and details regarding the implementation of wavelet analysis can be found in reference [7].
Fig. 1. Filter-bank structure implementing a discrete wavelet transform.
WAVELET TRANSFORM WITH APPLICATION TO SPEAKER IDENTIFICATION
271
3. MULTI-RESOLUTION FEATURES BASED ON WAVELET TRANSFORM FOR REPRESENTING SPEECH SIGNALS Speech signals have a very complex waveform because of the superposition of various frequency components. How to determine a representation that is well adapted for extracting information content of speech signals is an important problem in speech recognition and speaker identification/verification systems. Two types of information are inherent in speech signals, time and frequency. In time space, sharp variations in signal amplitude are generally the most meaningful features. So one can distinguish complicated signals by means of their detailed contours. In other words, when the signal includes important structures that belong to different scales, it is often helpful to decompose the signal into a set of “detail components” of various sizes. In the frequency domain, although the dominant frequency channels of speech signal are located in the middle frequency region, different speakers may have different responses in all frequency regions. Thus traditional methods which just consider fixed frequency channels may lose some useful information in the feature extraction process. Accordingly, using the multi-resolution decomposing technique, one can decompose the speech signal into different resolution levels. The characteristics of multiple frequency channels and any change in the smoothness of the signal can then be detected to perfectly represent the signals. As described in section 2, the scaling functions and wavelets form orthonormal base. According to Parseval’s theorem, the energy of the speech signal can be represented by the energy in each of the expansion components and their wavelet coefficients [8] as follows:
∫
2
f 0 (t ) dt =
∞
∑
k = −∞
ck
2
∞
+∑
∞
∑d
2 j ,k
(9)
j = 0 k = −∞
Consequently, the information within the signals will be partitioned into different resolution levels depending on the scaling functions. For this reason, in our extraction algorithm of speech features, the linear predictive cepstral coefficients (LPCC) within the approximation channel are calculated for capturing the characteristic of the vocal track. The main reasons for using these parameters are their good representation of the envelope of speech spectrum of vowels and its simplicity. In order to capture the detailed characteristic of vocal track for constructing more effective and robust speech features, the multi channel linear predictive cepstral coefficients (MCLPCC) based on the wavelet transform are calculated. As described in section 2, a down sampling operation is performed in each decomposition process, but this may cause damage to the original sampled signals. To alleviate this, a simple interpolation technique is used before the first decomposition process. According to the concept of the proposed method, the number of MCLPCC coefficients depends on the number of decomposition levels of the wavelet transform. However, one need to consider the trade-off between the identification rate and computation time. As we know, the LPCC are bothered by interference from noise. For this reason, a hard thresholding technique is applied in each approximation channel before the next decomposition process. Since conspicuous peaks in the time domain have large compo-
CHING-TANG HSIEH, EUGENE LAI AND YOU-CHUANG WANG
272
nents over many wavelet scales, while superfluous variations die out swiftly with increasing scale. This allows a characterization of the wavelet transform coefficients with respect to their amplitudes. The most significant coefficients at each scale, with amplitude above one threshold, are given by:
θ j = σ j ⋅ MF
(10)
where σj is the standard deviation of the wavelet transform coefficients within the approximation channel at scale j, and MF is an adjustable multiplicative factor used to restrict the threshold to a certain extent. Experimental results show that using this method not only reduces the influence of noise but improves the recognition rate. Besides, considering the characteristic of the vocal track, other speech features related to vocal codes are also considered in this paper. Based on the lack of correlation between the approximation and detail coefficients derived from QMFs, the coefficients within the high frequency detail channel are used to capture the characteristic of the vocal codes. Our experiments show that using entropy features gives better performance than using variance features. Hence, in this paper all the entropy values within detail channels are also calculated to construct a more compact feature vector. The entropy of wavelet coefficients is calculated by: N
E ( B ) = −∑ P(bi ) log( P (bi ))
(11)
i =1
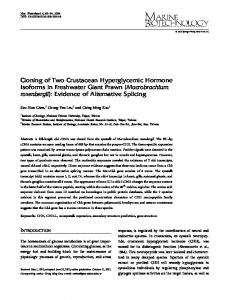
where P(bi) is the probability that wavelet coefficients are located in ith bin, and N is the number of bins used to partition the coefficients space. In our evaluation, the best performance is given by N is selected in the range 10 to 20. A schematic for the proposed feature extraction method is shown in Fig. 2. The recursive decomposition process lets us easily acquire the multi-resolution features of the speech signal. In the final stage, a combination of these MCLPCC and entropy values is implemented by: L
FinalFeatures = ∑ ( MCLPCC + w × E (i ))
(12)
i =1
where L is the number of decomposition processes and w represents a weight. In this paper, the calculation of wavelet transform is based on the orthonormal bases introduced by Daubechies [9] using her quadrature mirror filters (QMFs) of 16 coefficients (see the Appendix).
4. MATCHING ALGORITHM Gaussian Mixture Model (GMM) has been widely used in speaker identification and shows the good performance [10-13]. A Gaussian mixture density is a weighted sum of M component densities, as depicted in Fig. 3 and given by:
WAVELET TRANSFORM WITH APPLICATION TO SPEAKER IDENTIFICATION
273
Input Speech Signal
Double Sampling
Y
Save all features
Decomposition Thresholding mechanism
N DWT
Approximation coefficient
Detail coefficients
LPCC feature
Entropy Feature
Fig. 2. Stages in the proposed feature extraction algorithm.
Fig. 3. Depiction of an M component Gaussian mixture density. →
M
→
P( x | λ ) = ∑ Pi Bi ( x )
(13)
i =1
→ v where x is an N-dimensional ranom vector, Bi ( x ), i = 1,..., M , are the component densi-
CHING-TANG HSIEH, EUGENE LAI AND YOU-CHUANG WANG
274
ties and Pi , i = 1,..., M , are the mixture weights. Each component density is a N-variate Gaussian function of the form: →
Bi ( x ) =
(2π )
→ 1 1 → → −1 → exp{− ( x − µ i )' ∑i ( x − µ i )} 1/ 2 2 | ∑ i|
→
with mean vector µ i and covariance matrix straint that
∑
M i =1
(14)
N /2
Σ i . The mixture weights satisfy the con-
Pi = 1 .
The complete Gaussian mixture density is parameterized by the mean vectors, covariance matrices and mixture weights from all component densities. These parameters are collectively represented by the notation: →
λ = {Pi , µ i , Σ i ) i = 1,..., M .
(15)
For Speaker identification, each speaker is represented by a GMM and is referred to by his/her model λ. Given training speech from a speaker, the goal of speaker model training is to estimate the parameters of the GMM, λ, which in some sense best matches the distribution of the training feature vectors. There are several techniques available for estimating the parameters of a GMM [14]. By far the most popular and well-established method is maximum likelihood (ML) estimation. The estimation of ML parameter can be obtained iteratively using a special case of the expectation-maximization (EM) algorithm [15]. For Speaker identification, a group of S speakers S = {1, 2, …, S} is represented by GMM’s λ1, λ2, …, λS. The objective is to find the speaker model which has the maximum v v v a posteriori probability for a given observation sequence ( x1 , x2 , …, xT ): ∧
T
→
S = arg max ∑ log P( x t | λk ) 1≤ k ≤ S
(16)
t =1
→
in which P( x t , λk ) is given in (13).
5. EXPERIMENTAL RESULTS 5.1 Database Description The proposed method is evaluated on the MAT-400 database compiled by the association for Computational Linguistics and Chinese Language Processing [16], which is a Mandarin speech database of 400 speakers collected through telephone networks in Taiwan. Include are 216 male and 184 female speakers. The speech signal is recorded at 8 kHz and 16 bits per sample. The speech data files are grouped into five categories: short spontaneous speech, numbers, isolated Mandarin syllables, isolated words of 2-4
WAVELET TRANSFORM WITH APPLICATION TO SPEAKER IDENTIFICATION
275
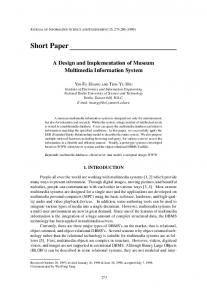
characters, and sentences. In this paper, two subsets of the MAT-400, referred to as SPDB1 and SPDB2, are used for evaluation, each containing 500 sentences from 50 speakers (25 males, 25 females). 5.2 Effects of Decomposition Levels From section 3, it is obvious that the number of extracted speech features is proportional to the number of decomposition levels. In our experiment, 12 coefficients of LPCC with one entropy value for each decomposition process are used as the speech features. As a result, the number of the features will be significantly affected by the selected decomposition levels. Although more decomposition processes can obtain more information from the input signals, the computational complexity and the number of useless features will increase greatly. Accordingly, how to strike a balance for choosing an appropriate decomposition level between the recognition rate and these drawbacks becomes a significant problem. In this experiment, the frame size of the analysis is 512 samples with 256 samples overlapping, and the multiplicative factor MF and the weighting value w are set to zero. Furthermore, in order to eliminate the silent section from an utterance, a simple segmentation based on signal energy of each speech frame is used. For our text-independent evaluations, five arbitrary sentence utterances in the MAT-400 speech database for each speaker are used as training patterns for 32 component densities. One seconds of speech waveform cut from the other five sentence utterances are used as test patterns. In this paper, nodal, diagonal covariance matrices are used for all speaker GMM models. Experimental results are plotted in Fig. 4, from which we can see that the number of decomposition levels have a similar effect on the two test subsets, and the good identification rates are achieved when the decomposition level are equal to 3. It is also obvious that as the decomposition level increases, not only does the computational loading increase, but also the recognition rate declines in SPDB1 because of the useless features. However, at level 3 a satisfactory performance, greater than 96% and 97% for SPDB1 and SPDB2, is obtained for a one second utterance. Accordingly, the experimental results give us a distinct guide for choosing the good decomposition level for the wavelet transform.
Correct Rate (%)
100 98 96 94
SPDB1
92
SPDB2
90 88 1
2
3
4
Number of Decomposition Levels Fig. 4. Effects of decomposition levels on the identification performance, where w and MF are set to zero.
CHING-TANG HSIEH, EUGENE LAI AND YOU-CHUANG WANG
276
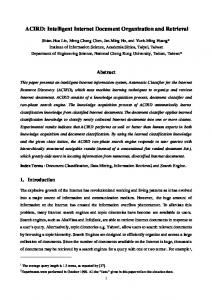
5.3 Effects of MF Our proposed feature extraction method is based on the wavelet transform and wavelet domain filtering. Hence, the effect on performance of adjusting the multiplicative factor MF is investigated. From section 5.2, we can see that by performing three decompositions, a satisfactory recognition rate can be achieved independent of the test patterns. The experiments presented here are almost the same as in the previous section except for the change in MF. Fig. 5 depicts the effect of MF on the performance of the proposed method. The results for the two test subsets are similar, and a good choice for MF is 0.03. So, the proposed method for deciding MF is stable even when using different testing patterns. From our evaluations, we know that too small a value of MF will preserve an excess of non-significant information, and conversely, too large a value of MF may eliminate significant information. Although different values of MF cause a variation in recognition rate, by choosing an appropriate value for MF a satisfactory result can be obtained even for different data sets.
Correct Rate (%)
98 97.5 97 96.5 SPDB1
96
SPDB2
95.5 0
0.01
0.02
0.03
0.04
0.05
MF
Fig. 5. Speaker identification rate as a function of multiplicative factor MF, where the decomposition level is set to 3.
5.4 Evaluation of Entropy Features As described in section 3, for constructing the compact feature vectors, the entropy of each detail channel is taken as the speech feature for vocal codes. Here the effect of the additive entropy value is investigated. Fig. 6 illustrates the experimental results, where the parameters of the decomposition level and multiplicative factor MF are set to 3 and 0.03, respectively. From the results we can see that even though we use different data sets for testing, a similar situation occurs. Choosing an appropriate weighting of entropy features, the identification rate can be improved. A large weight will increase the contribution of detail channels, which contains the high frequency components of speech signals. In our simulation, a good weighting value w is 0.1.
WAVELET TRANSFORM WITH APPLICATION TO SPEAKER IDENTIFICATION
277
Correct Rate (%)
98.5 98 97.5 97
SPDB1
96.5
SPDB2
96 0
0.1
0.2
0.3
0.4
W
Fig. 6. Speaker identification performance versus weighting value w of the entropy features.
5.5 Effects of Utterance Length The evaluation of a speaker identification experiment is conducted in the following manner. The test speech is first processed by the front-end analysis to produce a se→
→
→
quence of feature vectors { x 1 , x 2 ,..., x T } . To evaluate different test utterance lengths, the sequence of feature vectors is divided into overlapping segments of N feature vectors. The first two segments from a sequence will be: Segment _ 1 647 48 x1 , x 2 ,..., x N , x N +1 , x N + 2 ,..., xT _2 6Segment 4748 x1 ,..., xt ,..., x N ,..., x N +t ,..., xT
A test segment length of one second corresponds to N = 31 speech frames. Each segment of N frames is treated as a separate test utterance. The final performance is evaluated by the percent of correctly identified N-length segments over the total number of segments. The evaluation is repeated for different values of N to evaluate performance with respect to test utterance length. In this experiment, the first test pattern SPDB1 is used. Fig. 7 shows the results. Obviously, the rate of correct identification increases as the duration of the test utterance increases. However, for a test utterance of more than two seconds, the increase in identification rate is considerably slow. The identification rate of two seconds is about 99% and the perfect identification can also be achieved for a test utterance of four seconds. 5.6 Comparison With Existing Methods In the final set of experiments we compare the performance of the proposed extraction method with other methods. In the literature, some models have been proposed for representing speech features [1, 3-6, 17-19]. In this paper, four well-known models, Linear Predict Coding Cepstrum (LPCC) [1], Fourier Transform Cepstral Coefficients
CHING-TANG HSIEH, EUGENE LAI AND YOU-CHUANG WANG
278
Correct Rate (%)
100 99 98 97 96 1
2
3
4
Test Utterance (Sec)
Fig. 7. Speaker identification performance versus test utterance length.
(FTCC) [17], Generalized Mel Frequency Cepstral Coefficients (GMFCC) [3] and Wavelet Packet Transform (WPT) [18], are compared. These different modeling techniques are worthy of comparison because they represent different ways of modeling the acoustic feature distribution. The main reasons of applying LPCC model are its good representation of the envelope of the spectra of vowels and its simplicity. The advantage of using the FTCC model is its better representation of unvoiced consonants compare to using the LPCC model. The idea of using Mel-scale is that it can map an acoustic frequency into a perceptual frequency scale to improve the speech recognition rate. Finally, the advantage of using WPT is its ability to do time-frequency analysis. In our experiments, the model conditions are set as follows: 24 cepstral coefficients are used for the LPCC, FTCC and MFCC models. Five scales of the wavelet packet transform are used to construct 32 speech feature vectors for the WPT model. The feature vectors of the proposed model are derived from three levels of decomposition of the wavelet transform with the related coefficients, and the MF factor and the weight w are set as 0.03 and 0.1, respectively. The experimental results are tabulated in Table 1, where the SPDB1 subset is used for testing and the length of a test utterance is one second. From the results we can see that in the original speech data test, an identification rate of over 96.8% is achieved by the proposed feature model, while the best performance achieved among all the other models is 95.7% in the MFCC model. In order to evaluate the performance of the proposed method in a noisy environment, the test patterns for five utterances are corrupted by additive white Gaussian noise. In addition, the Wiener filter [20] is also applied to the other models for comparison. The degraded signal is generated by adding zero-mean white Gaussian noise to the original signal so that the signal to noise ratio (SNR) is 20 dB. The SNR is defined as 10 log 10 ( ∑ x 2 ( n ) / ∑ w 2 ( n )) , n
n
where the summation is over the entire length of the original signal. When the test pattern is corrupted with white Gaussian noise, the performance of the other methods is affected significantly by the added noise. In this noisy environment testing, the MFCC model also has the best identification rate of 84.7% among all models. On the contrary, by using the proposed feature extraction method, a satisfactory identification rate of 91.5% is achieved even in a noisy environment.
WAVELET TRANSFORM WITH APPLICATION TO SPEAKER IDENTIFICATION
279
Table 1. Comparison of identification rate with other methods. Model Patterns
LPCC
FTCC
MFCC
WPT
Proposed
Original Speech
95.02%
93.8%
95.76%
91.24%
96.81%
Corrupted Denoise Corrupted Denoise Corrupted Denoise Corrupted Denoise SNR = 20 dB
56.51% 68.26% 42.79% 51.8% 62.71% 84.72% 69.64% 81.5%
91.56%
6. CONCLUSIONS In this paper we propose an effective and robust method for extracting speech features. Based on the time-frequency analysis of the wavelet transform, all uncorrelated resolution channels are obtained by using QMFs. The traditional linear predictive cepstral coefficients (LPCC) of all approximation channels are calculated for capturing the characteristics of the vocal track, and the entropy of all detail channels are calculated for capturing the characteristics of the vocal cords. In addition, hard thresholding is applied to the approximation channel for each decomposition to remove the interference from noise. The results show that this strategy not only effectively reduces the problem of noise but also improves recognition. Finally, the proposed method is evaluated on the MAT-400 telephone speech database for text-independent speaker identification. Experimental results show that the proposed method, combined with the wavelet transform and the traditional speech feature model, is more effective and robust than previous used models in any situation. Additionally, the identification rate of the proposed method is satisfactory even in the presence of noise.
APPENDIX The lowpass QMF coefficients hk used in this paper are listed in Table 2. The coefficients of the highpass filter gk are calculated from the hk coefficients by: Table 2. The used QMF coefficients hk.
h0 h1 h2 h3 h4 h5 h6 h7
0.766130 0.433923 -0.050202 -0.110037 0.032081 0.042068 -0.017176 -0.017982
h8 0.008685 h9 0.008201 h10 -0.004354 h11 -0.003882 h12 0.002187 h13 0.001882 h14 -0.001104 h15 -0.000927
280
CHING-TANG HSIEH, EUGENE LAI AND YOU-CHUANG WANG
g k = ( −1) k hn −1− k
k = 0,1,..., n
(17)
where n is the number of QMF coefficients.
REFERENCES 1.
2.
3.
4.
5.
6.
7.
8. 9. 10.
11.
12.
13.
B. Atal, “Effectiveness of linear prediction characteristics of the speech wave for automatic speaker identification and verification,” Journal of Acoustic Society America, Vol. 55, 1974, pp. 1304-1312. G. M. White and R. B. Neely, “Speech recognition experiments with linear prediction, bandpass filtering, and dynamic programming,” IEEE Transactions on Acoustics, Speech, Signal Processing, Vol. 24, 1976, pp. 183-188. R. Vergin, D. O’Shaughnessy, and A. Farhat, “Generalized mel frequency cepstral coefficients for large-vocabulary speaker-independent continuous-speech recognition,” IEEE Transactions on Speech and Audio Processing, Vol. 7, 1999, pp. 525-532. S. Furui, “Cepstral analysis technique for automatic speaker verification,” IEEE Transactions on Acoustics, Speech, Signal Processing, Vol. ASSP-29, 1981, pp. 254-272. K. Gopalan, T. R. Anderson, and E. J. Cupples, “A comparison of speaker identification results using features based on cepstrum and Fourier-Bessel expansion,” IEEE Transactions on Speech and Audio Processing, Vol. 7, 1999, pp. 289-294. F. Phan, M. T. Evangelia, and S. Sideman, “Speaker identification using neural networks and wavelets,” IEEE Engineering in Medicine and Biology Magazine, Vol. 191, 2000, pp. 92-101. S. G. Mallat, “A theory for multiresolution signal decomposition: the wavelet representation,” IEEE Transactions on Pattern Analysis Machine Intelligence, Vol. 11, 1989, pp. 674-693. C. S. Burrus, R. A. Gopinath, and H. Guo, Introduction to Wavelets and Wavelet Transforms, Prentice Hall, New Jersey, 1997. I. Daubechies, “Orthonormal bases of compactly supported wavelets,” Communication Pure Applied Mathematics, Vol. 41, 1988, pp. 909-996. D. A. Reynolds and R. C. Rose, “Robust test-independent speaker identification using Gaussian mixture speaker models,” IEEE Transactions on Speech Audio Processing, Vol. 3, 1995, pp. 72-83. C. Miyajima, Y. Hattori, K. Tokuda, T. Masuko, T. Kobayashi, and T. Kitamura, “Text-independent speaker identification using Gaussian mixture models based on multi-space probability distribution,” IEICE Transactions on Information & System, Vol. E84-D, 2001, pp. 847-855. C. M. Alamo, F. J. C. Gil, C. T. Munilla, and L. H. Gomez, “Discriminative training of GMM for speaker identification,” in Proceedings of IEEE International Conference of Acoustic Speech Signal Processing, 1996, pp. 89-92. B. L. Pellom and J. H. L. Hansen, “An effective scoring algorithm for Gaussian mixture model based speaker identification,” IEEE Signal Processing Letters, Vol. 5, 1998, pp. 281-284.
WAVELET TRANSFORM WITH APPLICATION TO SPEAKER IDENTIFICATION
281
14. G. McLachlan, Mixture Models, New York, Marcel Dekker, 1988. 15. A. Dempster, N. Laird, and D. Rubin, “Maximum likelihood from incomplete data via the EM algorithm,” Journal of Royal Statistic Society, Vol. 39, 1977, pp. 1-38. 16. H. C. Wang, “MAT-A project to collect mandarin speech data through telephone networks in Taiwan,” Computational Linguistics and Chinese Language Processing, Vol. 2, 1997, pp. 73-90. 17. J. W. Picone, “Signal modeling techniques in speech recognition,” in Proceedings of IEEE, Vol. 81, 1993, pp. 1215-1247. 18. M. T. Humberto and L. R. Hugo, “Automatic speaker identification by means of mel cepstrum, wavelets and wavelets packets,” in Proceeding of IEEE International Conference 22nd Annual EMBS, 2000, pp. 978-980. 19. D. A. Reynolds, “Experimental evaluation of features for robust speaker identification,” IEEE Transactions on Speech Audio Processing, Vol. 2, 1994, pp. 639-643. 20. J. R. Deller, J. G. Proakis, and H. L. Hansen, Discrete Time Processing of Speech Signals, Macmillan, New York, 1993.
Ching-Tang Hsieh (謝景棠) is an associate professor of Electrical Engineering at Tamkang University, Taiwan, Republic of China. He received the B.S. degree in electronics engineering in 1976 from Tamkang University and the M.S. and Ph.D. degree in 1985 and 1988, respectively, from Tokyo Institute of Technology, Japan. From 1990 to 1996, he acted as the Chairman of the Department of Electrical Engineering. His current research interests include speech analysis and synthesis, speech recognition, natural language processing, image processing, neural networks, and fuzzy system.
Eugene Lai (賴友仁) received his B.S. degree at the Department of Electrical Engineering, National Taiwan University, Republic of China, in 1963. He received his M.S. and Ph.D. at the Department of Electrical Engineering, Iowan State University, U.S.A., in 1969 and 1971, respectively. He is currently a professor at the Department of Electrical Engineering, Tamkang University. His major interests are in electromagnetics and semiconductor physics.
282
CHING-TANG HSIEH, EUGENE LAI AND YOU-CHUANG WANG
You-Chuang Wang (王有傳) received the B.E. and M.E. degrees in electrical engineering from Tamkang University, Taiwan, Republic of China, in 1995 and 1997, respectively. He is currently pursuing the Ph.D. degree at Tamkang University. His research interests include biometrics, multimedia, and digital signal processing.